
To standardize the single nucleotide polymorphism array (SNPa) method in acute myeloid leukemia/myelodysplastic syndromes, and to identify the similarities and differences between the results of this method and karyotyping.
MethodsTwenty-two patients diagnosed with acute myeloid leukemia and three with myelodysplastic syndromes were studied. The G-banding karyotyping and single nucleotide polymorphism array analysis (CytoScan® HD) were performed using cells from bone marrow, DNA extracted from mononuclear cells from bone marrow and buccal cells (BC).
ResultsThe mean age of the patients studied was 54 years old, and the median age was 55 years (range: 28–93). Twelve (48%) were male and 13 (52%) female. Ten patients showed abnormal karyotypes (40.0%), 11 normal (44.0%) and four had no mitosis (16.0%). Regarding the results of bone marrow single nucleotide polymorphism array analysis: 17 were abnormal (68.0%) and eight were normal (32.0%). Comparing the two methods, karyotyping identified a total of 17 alterations (8 deletions/losses, 7 trissomies/gains, and 2 translocations) and single nucleotide polymorphism array analysis identified a total of 42 alterations (17 losses, 16 gains and 9 copy-neutral loss of heterozygosity).
ConclusionIt is possible to standardize single nucleotide polymorphism array analysis in acute myeloid leukemia/myelodysplastic syndromes and compare the results with the abnormalities detected by karyotyping. Single nucleotide polymorphism array analysis increased the detection rate of abnormalities compared to karyotyping and also identified a new set of abnormalities that deserve further investigation in future studies.
Acute myeloid leukemia (AML) is a group of clonal disorders resulting from acquired somatic genetic lesions accumulated in hematopoietic progenitors in a step-wise fashion throughout life. The mutations give rise to a malignant hematopoietic clone; malignant hematopoiesis subsequently suppresses normal hematopoiesis.1,2
The myelodysplastic syndromes (MDS) are a group of clonal hematopoietic stem cell disorders involving cytogenetic changes, and gene mutations that occur in a multistep process, with widespread gene hypermethylation at advanced stages. MDS are characterized by ineffective hematopoiesis leading to blood cytopenias or, in some cases, evolution to AML.3
The detection of chromosomal abnormalities in AML/MDS supports the diagnosis, classification, prognostic stratification, therapy option, treatment monitoring and better understanding of the disease's biology.3,4 The consequence of chromosomal investigations is major advances in the treatment and survival of patients. However, about 50% of AML/MDS have either normal karyotypes or non-recurrent chromosomal abnormalities, which prevents a better characterization of the disease.5,6 Therefore, an increased abnormality detection rate by other methods and improved understanding of pathogenesis are urgently needed.1,7,8
In this context, the single nucleotide polymorphism array (SNPa) method, also referred to as molecular karyotyping, is a sensitive technology used to perform high-resolution genome-wide DNA copy number analysis and to detect segmental regions of homozygosity, known as regions of copy-neutral loss of heterozygosity (CN-LOH).2,9
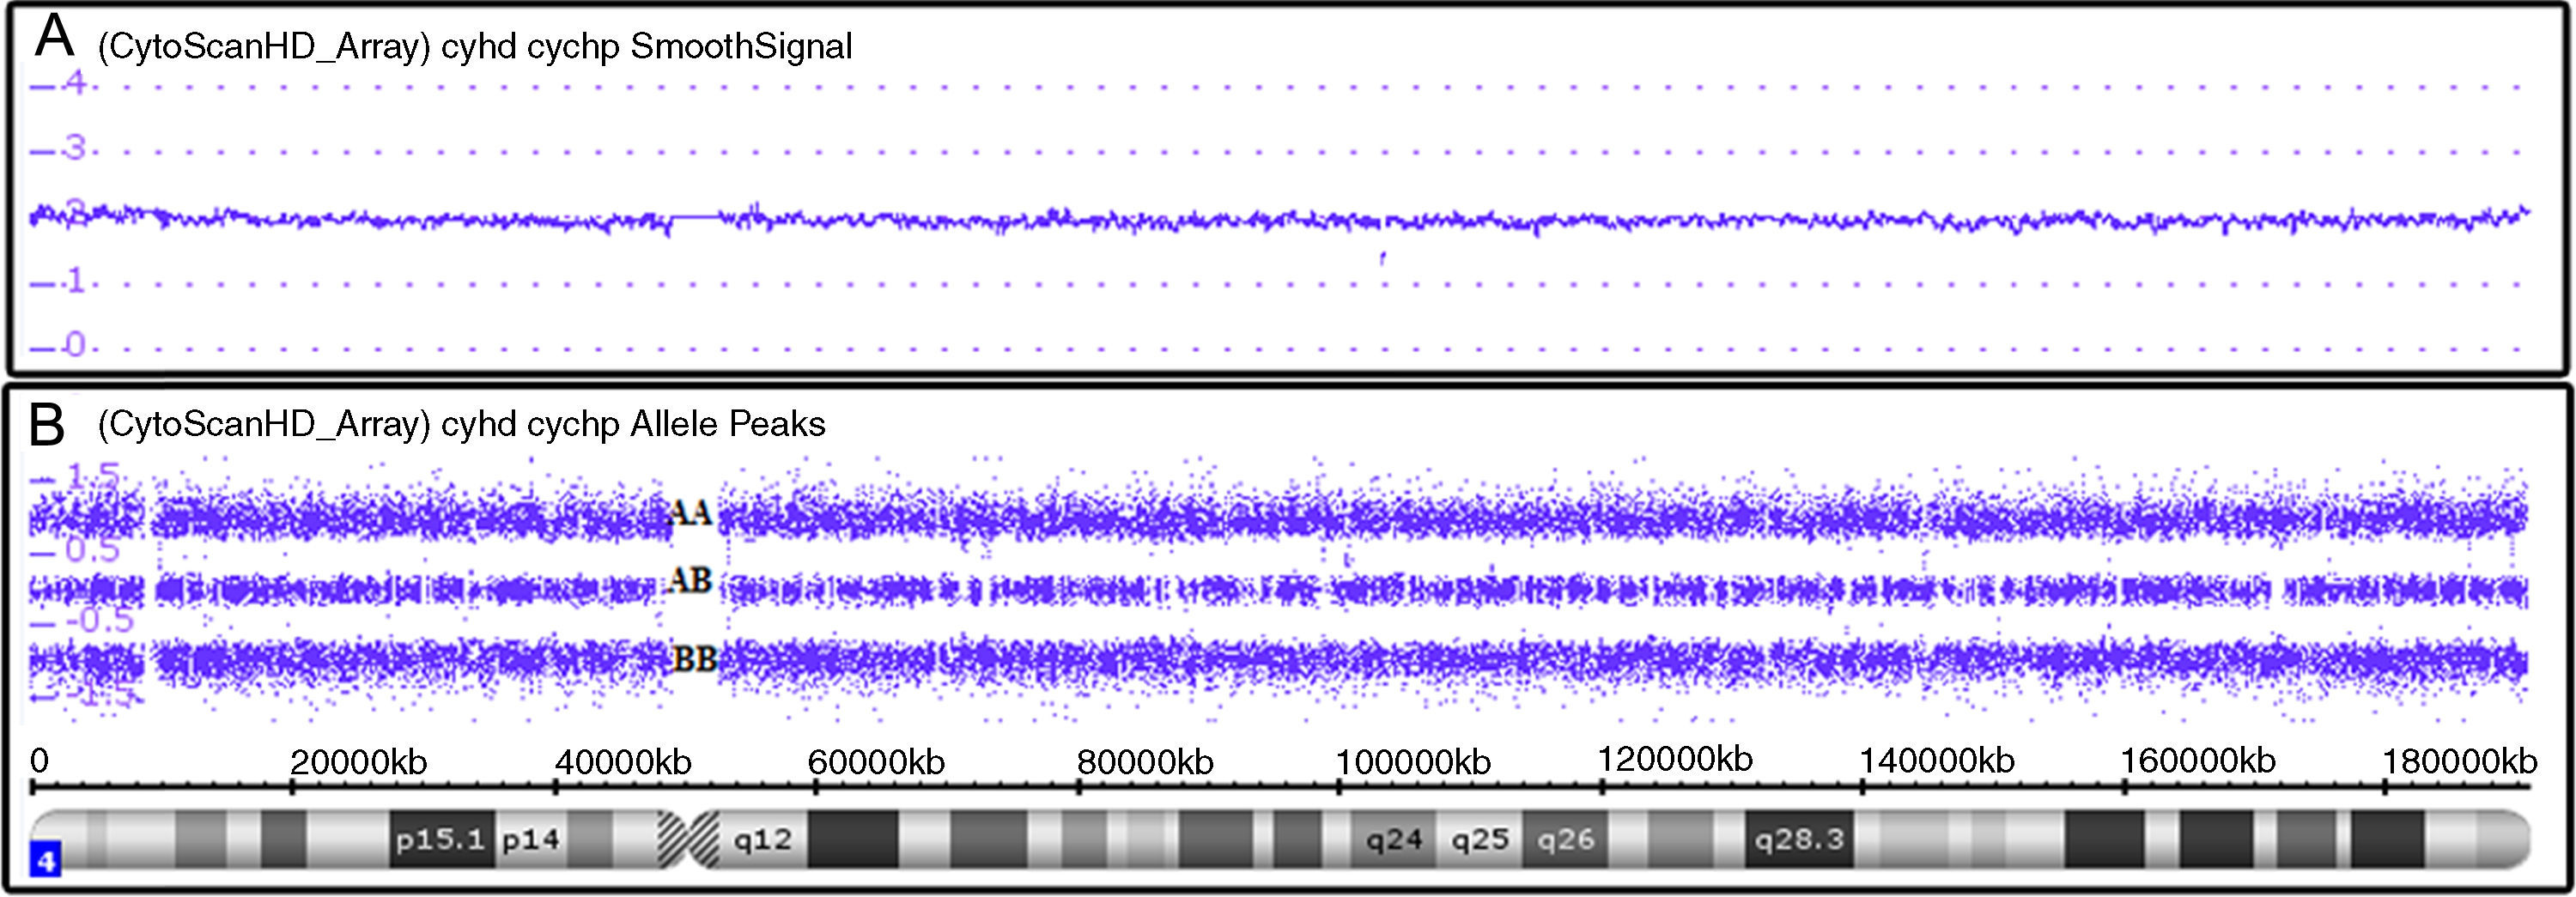
SNPa analysis uses millions of markers (probes comprise 25-mer oligonucleotides) across the entire human genome.10 There are two types of probes: non-polymorphic probes, used only for assessing copy number variations (CNV) (Figure 1A), and polymorphic probes, used to assess genotypes (Figure 1B).11 For copy number analysis, patient DNA labeled with a fluorochrome provides signal intensity that, when compared to a set of reference DNAs, indicates whether there is a gain or loss of genetic material. For genotype analysis, a single nucleotide polymorphism (SNP) has a single base pair substitution (A, T, C, or G) of one nucleotide to another, then, the alleles corresponding to the nucleotide base changes are arbitrarily given the designation allele A and allele B (polymorphic probes) and reveal which of the genotypes (for example, AA, BB or AB) is present.12
 Smooth signal representing a normal copy number (purple line CN: 2.00). The information on copy number variations is from non-polymorphic probes. (B) Allele peaks representing a normal genotype with AA, AB and BB alleles (three purple lines). Information on the genotype is from polymorphic probes.")
Affymetrix® Chromosome Analysis Suite image showing normal chromosome 4. (A) Smooth signal representing a normal copy number (purple line CN: 2.00). The information on copy number variations is from non-polymorphic probes. (B) Allele peaks representing a normal genotype with AA, AB and BB alleles (three purple lines). Information on the genotype is from polymorphic probes.
In order to better define the genetic abnormalities, the objective of this study was to identify the similarities and differences between SNPa analysis and karyotyping in 25 AML/MDS cases at diagnosis.
MethodsCase selectionTwenty-five patients with AML (n=22, non-acute promyelocytic leukemia) and MDS (n=3) diagnosed according to WHO criteria at the Escola Paulista de Medicina, Universidade Federal de São Paulo (UNIFESP) from March 2012 to January 2014 were studied.4 Bone marrow (BM) aspirate was collected at diagnosis from all patients.
At the same time, buccal cells (BC) were also collected (DNA-SAL™Oasis Diagnostics®) to distinguish clonal abnormalities from constitutional findings.13,14
The study was approved by the Ethics Committees of UNIFESP and Grupo Fleury and was conducted in accordance with the Helsinki Declaration as revised in 2008. All patients gave informed consent prior to entering the study.
KaryotypingThe karyotyping was performed for all BM samples at the time of initial diagnosis and conventional cytogenetic analyses of 24–48h cultures were performed on bone marrow aspirates using standard techniques. The karyotype results were described according to the International System for Human Cytogenetic Nomenclature 2009.15–17 Whenever possible, at least 20 metaphases were analyzed.17
Single nucleotide polymorphism array analysisSNPa analysis was performed for all samples (BM and BC).13 Mononuclear cells from BM were separated (Ficoll method) and DNA was extracted from these cells as well as from BC (Nucleic Acid and Protein Purification kit from Marcherey-Nagel®).14,18 DNA (250ng) was digested, amplified, purified, fragmented, labeled and hybridized using Affymetrix CytoScan® HD Array GeneChip; CEL files were created using the GeneChip® System 3000 7G according to the manufacturer's instructions (Affymetrix). The CEL files were analyzed using Chromosome Analysis Suite v2.0 (ChAS) software.19,20
Equipment, instrumentation, and methodologies employed during the use of microarray platforms were calibrated, monitored, and regularly maintained as appropriate. Positive (Genomic DNA Control supplied by Affymetrix) and negative controls (Low EDTA TE Buffer) were used to validate chip, reagents, and instruments and every CytoScan® HD array has internal quality control metrics used to determine pass/fail for individual samples.21
Regions of CNV larger than 1Mb and CN-LOH larger than 10Mb identified by the ChAS Software or detected by visual inspection, regardless of gene content, are denoted as true aberrations, with the exception of those known to be normal genomic variants (present in the Genomic Variants Database [http://projects.tcag.ca/variation]) and/or found in constitutional (BC) SNPa analysis.9,18,22,23
SNPa results of BC indicate the individual constitutional genome. Thus, changes observed in BM and not found in BC are indicative of acquired abnormalities and were considered for evaluation.13
ResultsThe mean age of the patients was 54 years and the median age was 55 years (range: 28–93). Twelve patients (48%) were male and 13 (52%) were female.
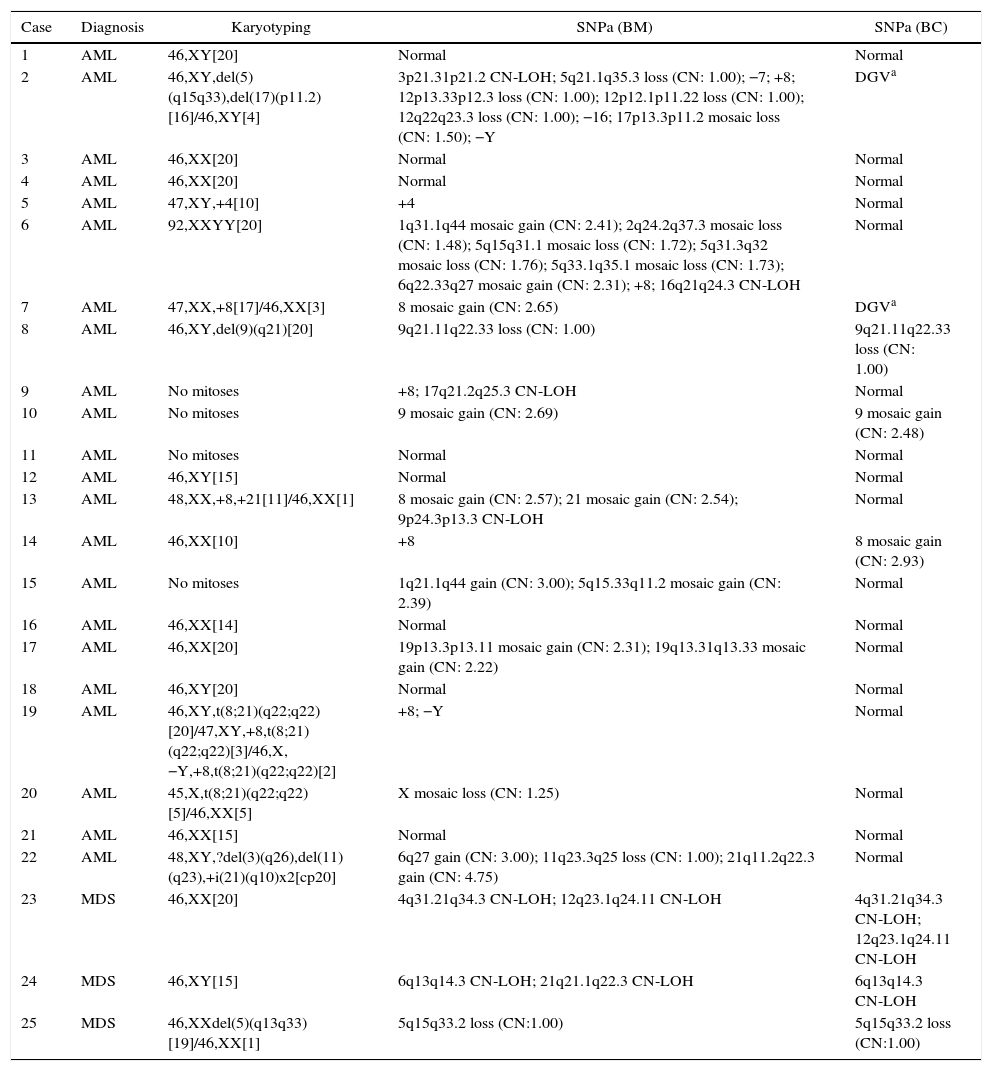
Karyotyping and SNPa results are listed in Table 1.
Karyotyping and single nucleotide polymorphism array results.
| Case | Diagnosis | Karyotyping | SNPa (BM) | SNPa (BC) |
|---|---|---|---|---|
| 1 | AML | 46,XY[20] | Normal | Normal |
| 2 | AML | 46,XY,del(5)(q15q33),del(17)(p11.2)[16]/46,XY[4] | 3p21.31p21.2 CN-LOH; 5q21.1q35.3 loss (CN: 1.00); −7; +8; 12p13.33p12.3 loss (CN: 1.00); 12p12.1p11.22 loss (CN: 1.00); 12q22q23.3 loss (CN: 1.00); −16; 17p13.3p11.2 mosaic loss (CN: 1.50); −Y | DGVa |
| 3 | AML | 46,XX[20] | Normal | Normal |
| 4 | AML | 46,XX[20] | Normal | Normal |
| 5 | AML | 47,XY,+4[10] | +4 | Normal |
| 6 | AML | 92,XXYY[20] | 1q31.1q44 mosaic gain (CN: 2.41); 2q24.2q37.3 mosaic loss (CN: 1.48); 5q15q31.1 mosaic loss (CN: 1.72); 5q31.3q32 mosaic loss (CN: 1.76); 5q33.1q35.1 mosaic loss (CN: 1.73); 6q22.33q27 mosaic gain (CN: 2.31); +8; 16q21q24.3 CN-LOH | Normal |
| 7 | AML | 47,XX,+8[17]/46,XX[3] | 8 mosaic gain (CN: 2.65) | DGVa |
| 8 | AML | 46,XY,del(9)(q21)[20] | 9q21.11q22.33 loss (CN: 1.00) | 9q21.11q22.33 loss (CN: 1.00) |
| 9 | AML | No mitoses | +8; 17q21.2q25.3 CN-LOH | Normal |
| 10 | AML | No mitoses | 9 mosaic gain (CN: 2.69) | 9 mosaic gain (CN: 2.48) |
| 11 | AML | No mitoses | Normal | Normal |
| 12 | AML | 46,XY[15] | Normal | Normal |
| 13 | AML | 48,XX,+8,+21[11]/46,XX[1] | 8 mosaic gain (CN: 2.57); 21 mosaic gain (CN: 2.54); 9p24.3p13.3 CN-LOH | Normal |
| 14 | AML | 46,XX[10] | +8 | 8 mosaic gain (CN: 2.93) |
| 15 | AML | No mitoses | 1q21.1q44 gain (CN: 3.00); 5q15.33q11.2 mosaic gain (CN: 2.39) | Normal |
| 16 | AML | 46,XX[14] | Normal | Normal |
| 17 | AML | 46,XX[20] | 19p13.3p13.11 mosaic gain (CN: 2.31); 19q13.31q13.33 mosaic gain (CN: 2.22) | Normal |
| 18 | AML | 46,XY[20] | Normal | Normal |
| 19 | AML | 46,XY,t(8;21)(q22;q22)[20]/47,XY,+8,t(8;21)(q22;q22)[3]/46,X,−Y,+8,t(8;21)(q22;q22)[2] | +8; −Y | Normal |
| 20 | AML | 45,X,t(8;21)(q22;q22)[5]/46,XX[5] | X mosaic loss (CN: 1.25) | Normal |
| 21 | AML | 46,XX[15] | Normal | Normal |
| 22 | AML | 48,XY,?del(3)(q26),del(11)(q23),+i(21)(q10)x2[cp20] | 6q27 gain (CN: 3.00); 11q23.3q25 loss (CN: 1.00); 21q11.2q22.3 gain (CN: 4.75) | Normal |
| 23 | MDS | 46,XX[20] | 4q31.21q34.3 CN-LOH; 12q23.1q24.11 CN-LOH | 4q31.21q34.3 CN-LOH; 12q23.1q24.11 CN-LOH |
| 24 | MDS | 46,XY[15] | 6q13q14.3 CN-LOH; 21q21.1q22.3 CN-LOH | 6q13q14.3 CN-LOH |
| 25 | MDS | 46,XXdel(5)(q13q33)[19]/46,XX[1] | 5q15q33.2 loss (CN:1.00) | 5q15q33.2 loss (CN:1.00) |
SNPa: single nucleotide polymorphism array; BM: bone marrow; BC: buccal cells; AML: acute myeloid leukemia; MDS: myelodysplastic syndrome; CN: copy number; LOH: loss of heterozygosity; DGV: genomic variants database.
Loss: CN<2.00; gain: CN>2.00; normal: CN=2.00. Y and X for male: normal: CN=1.00.
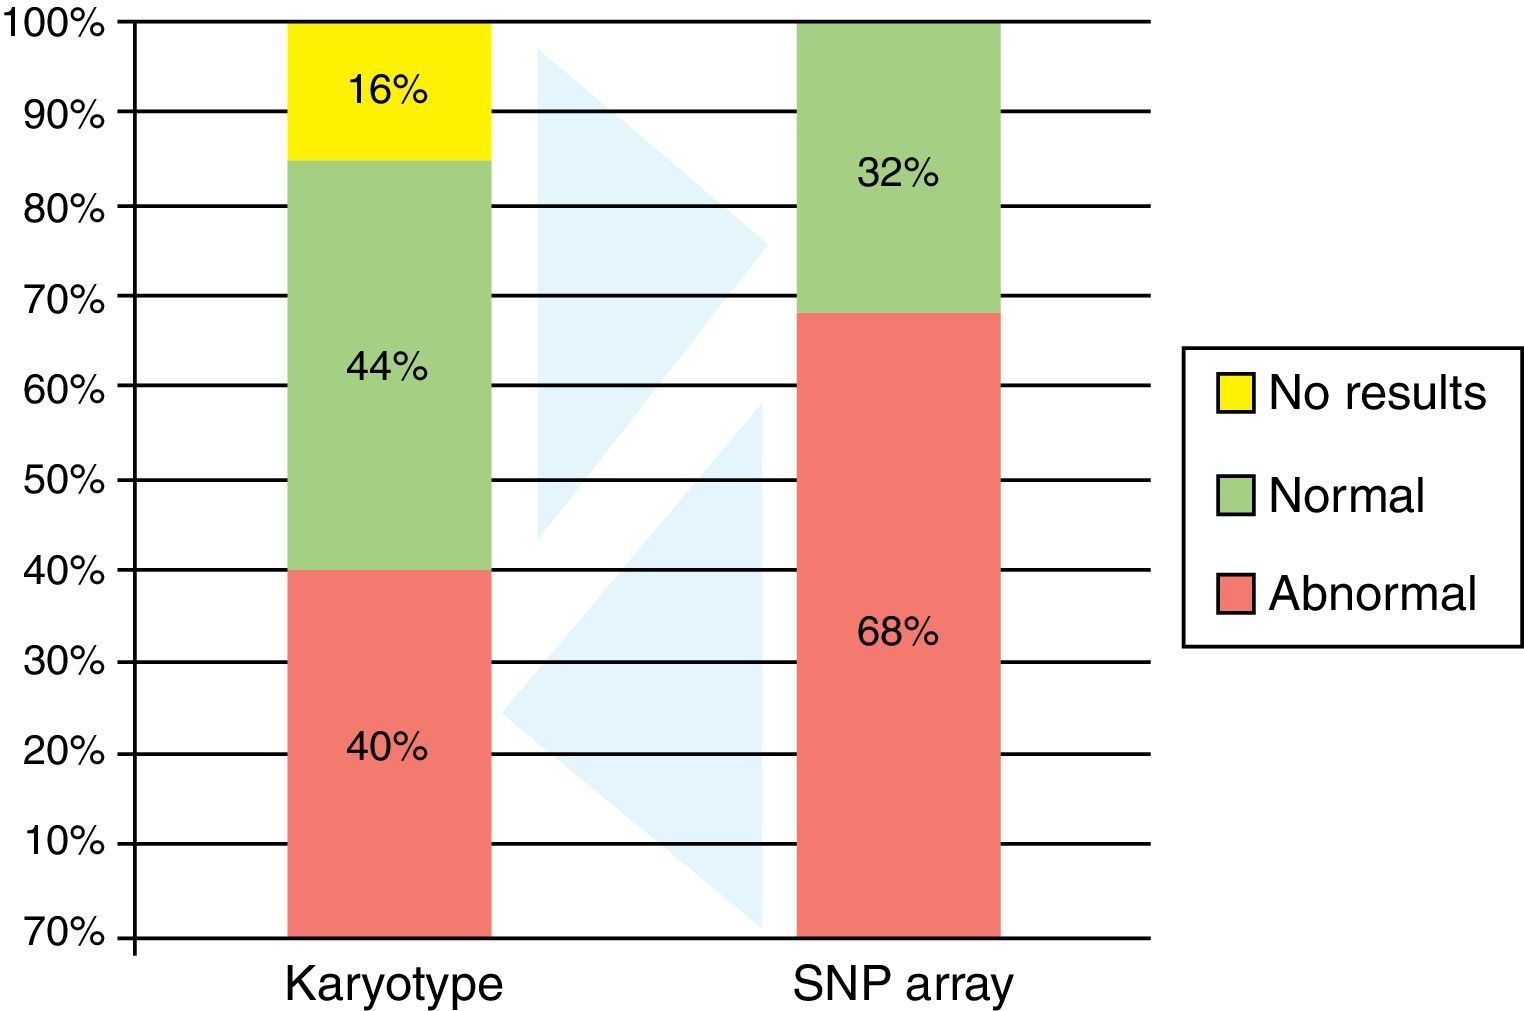
Ten patients had abnormal karyotypes (40.0%), 11 normal (44.0%) and four had no mitosis (16.0%) (Figure 2).
 and bone marrow single nucleotide polymorphism array analysis (SNPa; abnormal: 17 patients and normal: 8 patients).")
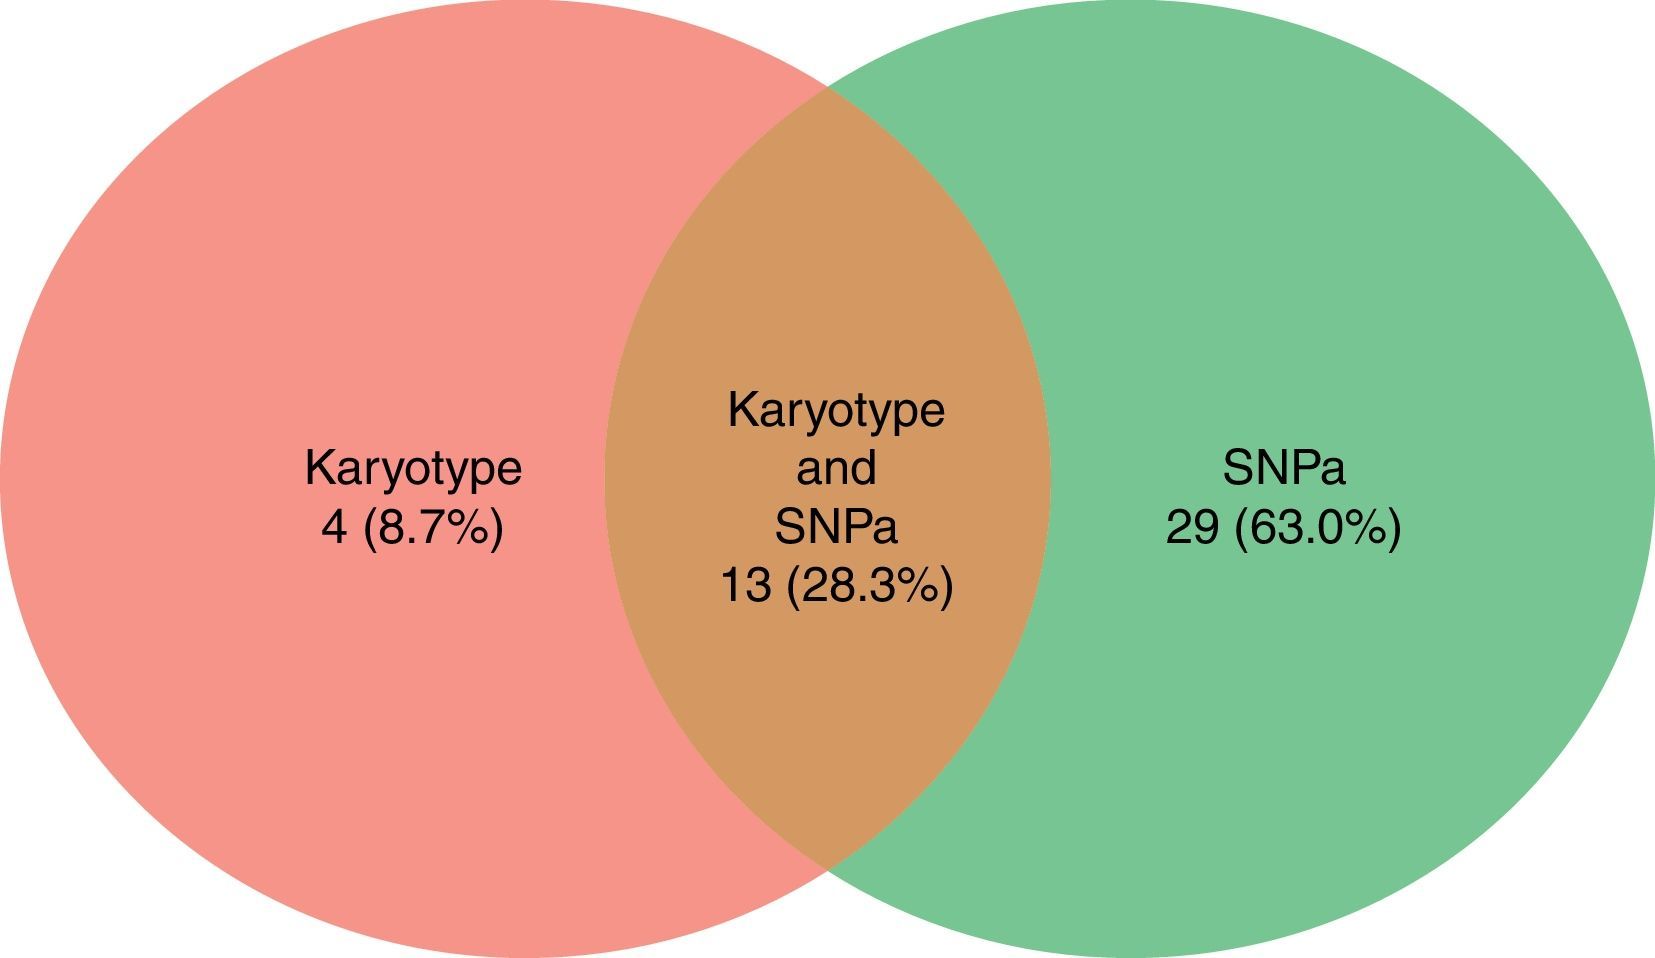
Karyotyping detected a total of 17 alterations (8 deletions/losses, 7 trisomies/gains and 2 translocations) in the 25 cases (Figure 3).
Single nucleotide polymorphism array, by bone marrow single nucleotide polymorphism array (SNPa) analysis only: 29 (63.0%) and by both methods simultaneously: 13 (28.3%).")
By BM SNPa analysis, 17 patients were abnormal (68.0%) and eight normal (32.0%) (Figure 2) and by BC SNPa analysis, six patients were abnormal (24.0%), 17 were normal (68.0%) and two had no results (8.0%). The internal quality control of Genechip failed for two samples.
SNPa analysis detected a total of 42 alterations (17 losses, 16 gains and 9 CN-LOH) in the 25 cases (Figure 3).
The SNPa method detected all abnormalities found by karyotype except for:
- •
polyploidy in Case 6;
- •
t(8;21) in Cases 19 and 20;
- •
?del(3)(q26) in Case 22.
On the other hand, SNPa detected many abnormalities not found by karyotyping:
- •
CN-LOH in 3p21.31p21.2, −7, +8, loss in 12p13.33p12.3, 12p12.1p11.22, 12q22q23.3, −16 and −Y in Case 1;
- •
mosaic gain in 1q31.1q44 and 6q22.33q27, +8 mosaic loss in 2q24.2q37.3, 5q15.q31.1, 5q31.3q32, 5q33.1q35.1 and CN-LOH in 16q21q24.3 in Case 6;
- •
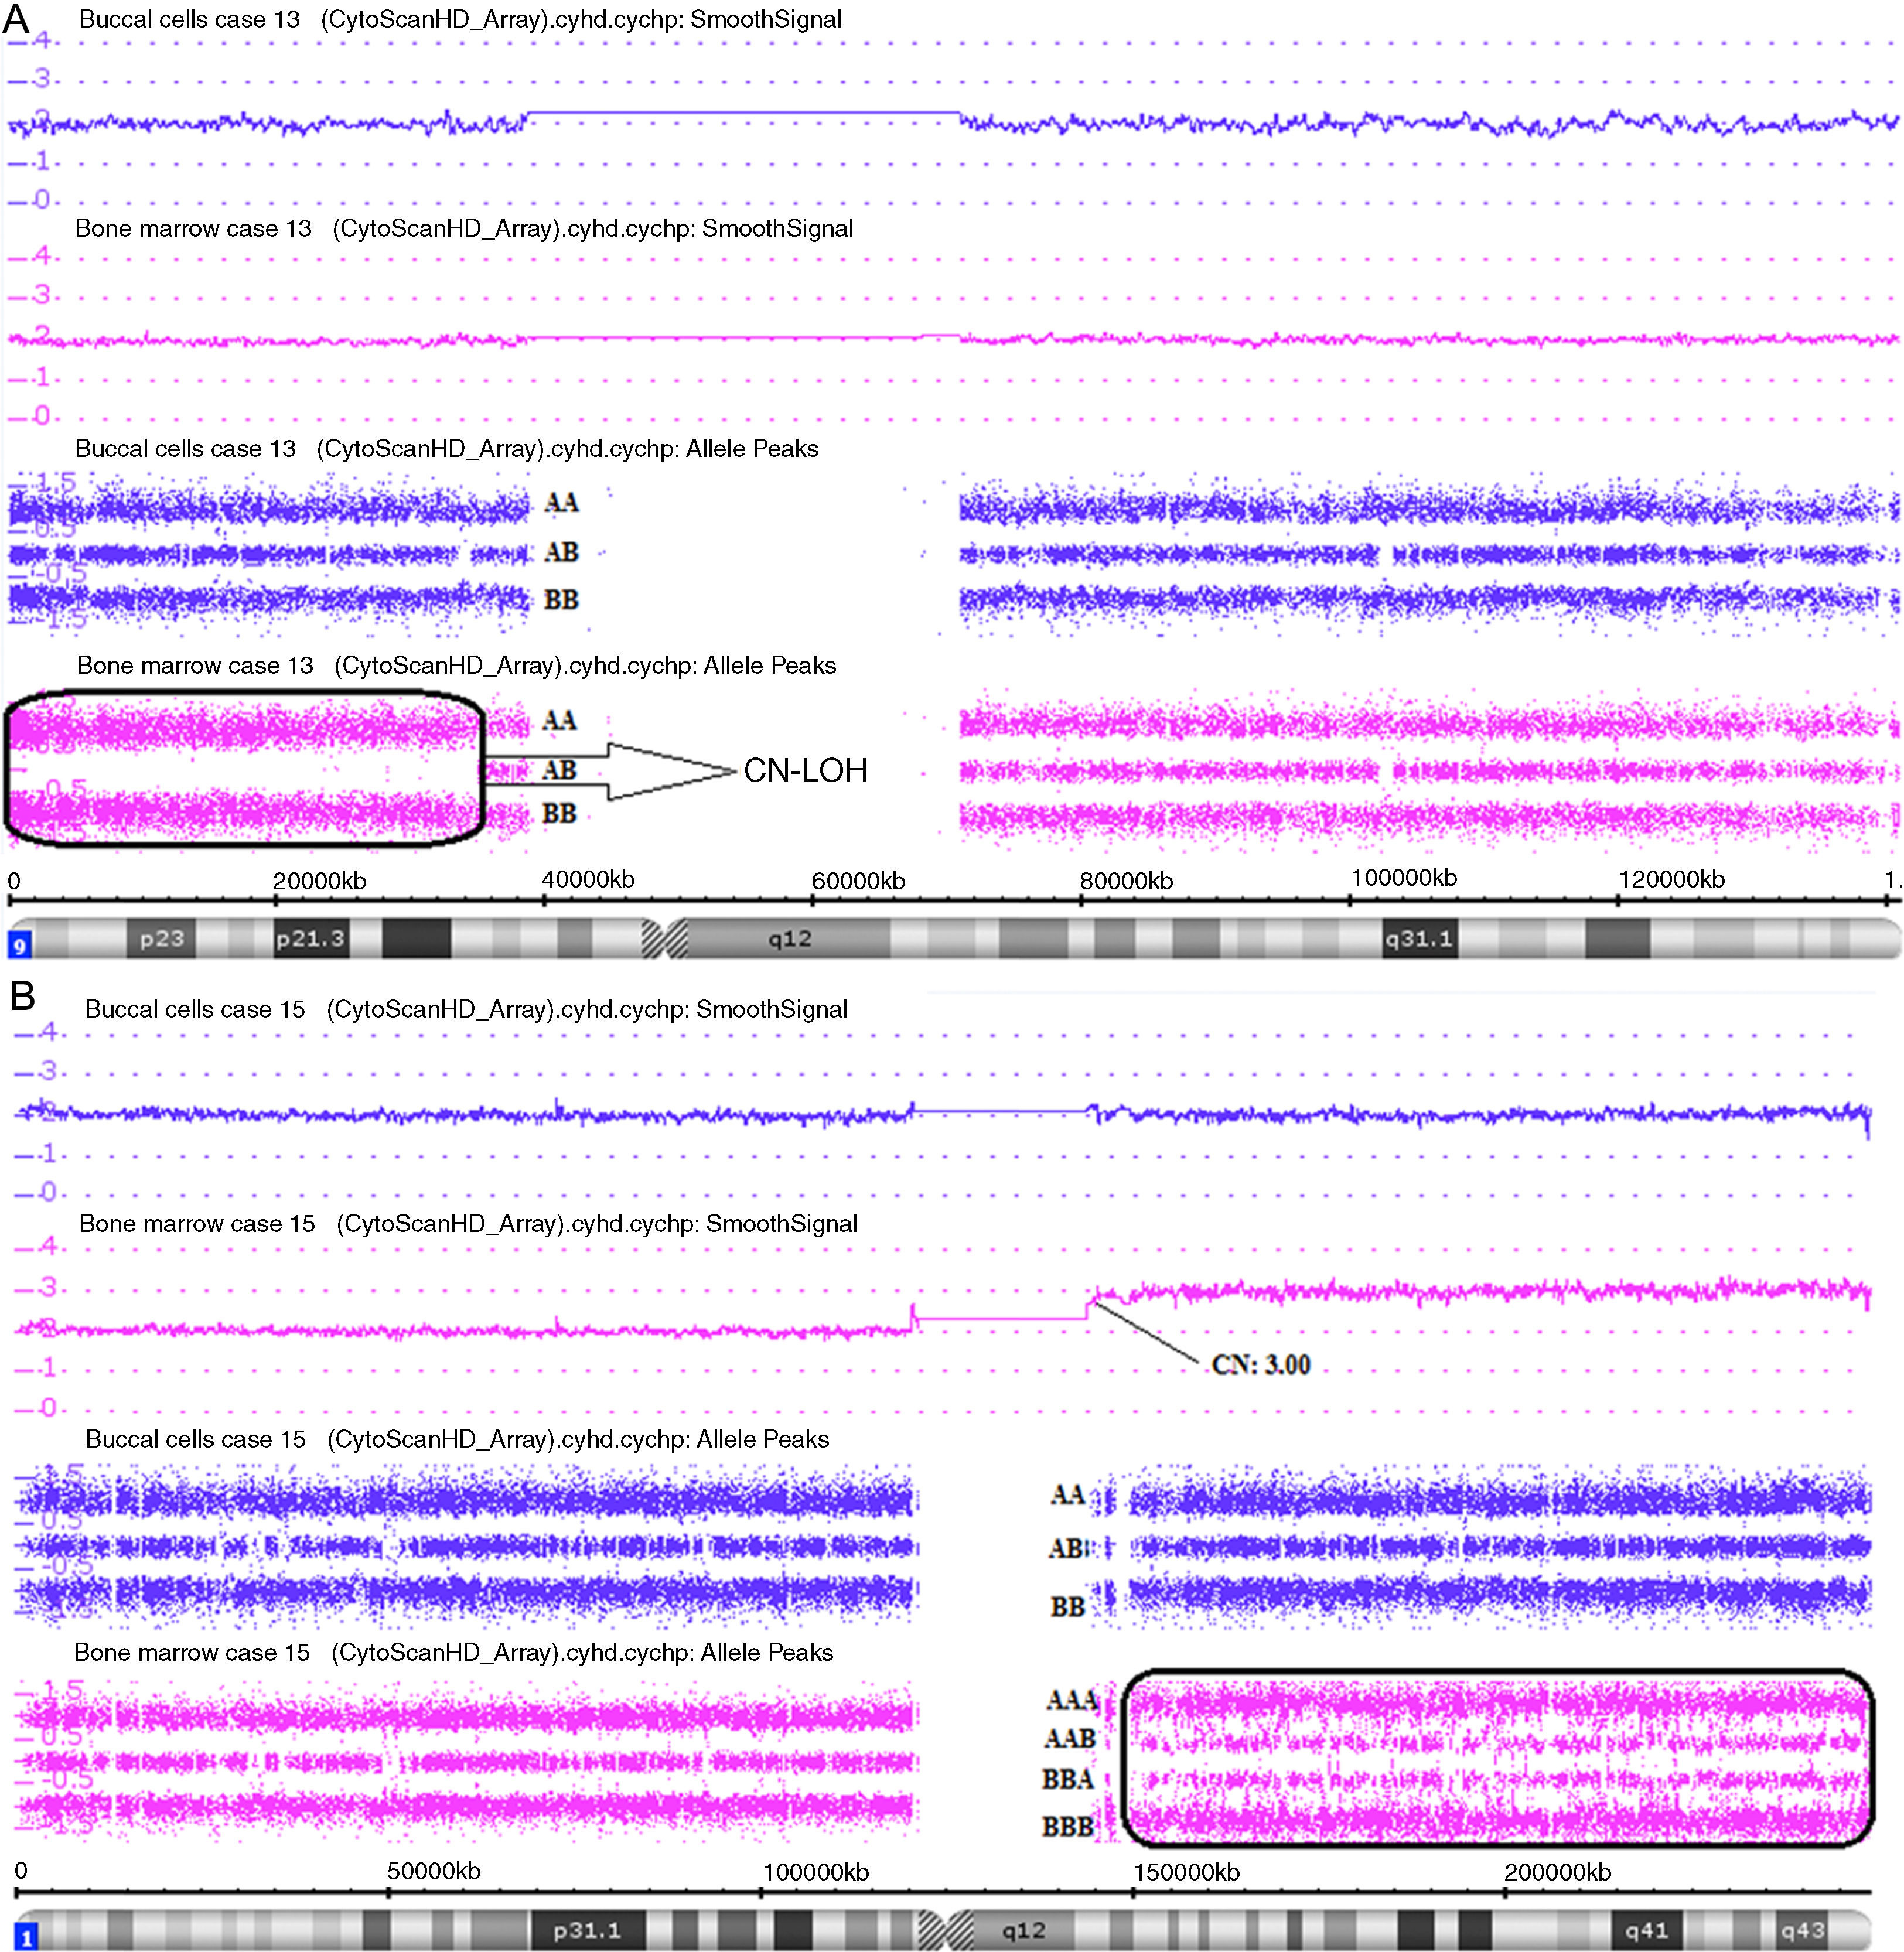
CN-LOH in 9p24.3p13.3 in Case 13 (Figure 4A);
 Paired analysis (Buccal cell and bone marrow single nucleotide polymorphism array analysis) of chromosome 9 showing copy-neutral loss of heterozygosity (CN-LOH) only in bone marrow. (B) Paired analysis (Buccal cell and bone marrow single nucleotide polymorphism array analysis) of chromosome 1 showing 1q21.1q44 gain only in bone marrow.") Figure 4.
Figure 4.Affymetrix® Chromosome Analysis Suite Image. (A) Paired analysis (Buccal cell and bone marrow single nucleotide polymorphism array analysis) of chromosome 9 showing copy-neutral loss of heterozygosity (CN-LOH) only in bone marrow. (B) Paired analysis (Buccal cell and bone marrow single nucleotide polymorphism array analysis) of chromosome 1 showing 1q21.1q44 gain only in bone marrow.
(1.48MB). - •
+8 in Case 14;
- •
mosaic gain in 19p13.3p13.11 and 19q13.31q13.33 in Case 17;
- •
gain in 6q27 in Case 22;
- •
CN-LOH in 4q31.21q34.3 and 12q23.1q24.11 in Case 23;
- •
CN-LOH in 6q13q14.3 and 21q21.1q22.3 in Case 24.
 Paired analysis (Buccal cell and bone marrow single nucleotide polymorphism array analysis) of chromosome 9 showing copy-neutral loss of heterozygosity (CN-LOH) only in bone marrow. (B) Paired analysis (Buccal cell and bone marrow single nucleotide polymorphism array analysis) of chromosome 1 showing 1q21.1q44 gain only in bone marrow.")
The following abnormalities were found by SNPa analysis in cases that karyotyping had no mitosis:
- •
+8 and CN-LOH in 17q21.2q25.3 in Case 9;
- •
mosaic gain in all chromosome 9 in Case 10;
- •
gain in 1q21.1q44, mosaic gain in 5q15.33q11.2 in Case 15 (Figure 4B).
Cytogenetic abnormalities identified by karyotyping remain the most important prognostic factor in AML.2,24
Molecular karyotyping of these cases by SNPa analysis demonstrated additional information regarding microscopic, submicroscopic, and CN-LOH alterations; the combination of SNPa analysis with karyotyping improves the detection rate for abnormalities.23
Clearly, the SNPa method does not replace karyotyping as it cannot detect balanced translocations that are relevant to the diagnosis and management of a variety of hematopoietic malignancies.11
In general, cytogenetic abnormalities observed in MDS, unlike AML, are losses or gains of genetic material. Despite the small number of MDS patients included in this study (three cases), all had abnormalities detected by SNPa analysis, while only one had an abnormal karyotype.
CN-LOH regions were found in Cases 6, 9, 13, 23 and 24 (20% of cases). This abnormality represents an important mechanism by which point mutations and other micro lesions can be established in an homozygous state detectable by SNPa analysis.13,25 CN-LOH is thought to be positively selected during clonal evolution because it can result in homozygosity for a mutation in one allele of a tumor suppressor gene or oncogene, together with the loss of the wild-type allele.13,26
Constitutional SNPa analysis (BC) was done in all cases in order to avoid false discoveries by comparing with the findings for BM (Figure 4).13,18 In Case 23 two regions of constitutional CN-LOH were found in 4q31.21q34.3 and 12q23.1q24.11. In Case 24 one region of constitutional CN-LOH was found in 6q13q14.3. Therefore, the interpretation of these cases is that the abnormalities were not acquired, but constitutional.
In four cases, the same alteration was found both by BM and BC SNPa analysis (constitutional). The alterations found by BC SNPa analysis in Cases 10 (mosaic gain in chromosome 9) and 14 (mosaic gain in chromosome 8) were present at a lower level than by the BM SNPa analysis, thus suggesting that the BC might have been contaminated with blood at the time of collection, though these changes might have been diluted in BC.13
In Cases 8 (loss in 9q21.11q22.33) and 25 (loss in 5q15q33.2), the alterations found in the BC SNPa analysis were seen by karyotyping and interpreted as an acquired alteration because in Case 8 this deletion would result in constitutional dimorphism or related syndrome, while in Case 25 the clone was detected by karyotyping along with normal cells. Supporting this interpretation, beyond the scope of this work, we performed SNPa analysis in Case 8 after induction therapy and the proportion of the change (CNV) was lower, thereby suggesting that this abnormality was affected by chemotherapy. With this evidence, we consider these two abnormalities as acquired.
The quality control metrics in the constitutional (BC) SNPa analysis failed in Cases 2 and 7 and in these cases we used the Genomic Variants Database to validate the findings of the BM SNPa analysis.27 Possibly, the failure was due to poor quality DNA from BC.
In Cases 2 and 14, after SNPa analysis, some chromosomal abnormalities (−7, +8, −16 and −Y) were found in sporadic metaphases during the karyotyping reanalysis, but had not initially been described because they did not meet the criterion to be considered as a cytogenetic clone,15 that is, more than three cells with the same numerical change or two cells with the same rearrangement.28
The application of the SNPa technique has been largely limited to exploratory research on cancer genetics. However, given its excellent performance in detecting genetic abnormalities in cancer, its application in clinical onco-hematology could be a logical step to attempt to establish better management of cancer patients.11,29 The redundancy of tests is beneficial for comprehensive and indistinct characterization of the disease.
SNPa analysis may add value to karyotyping-non-informative results and occasionally reveal cryptic abnormalities not recognized by karyotyping.23 However, SNPa analysis should be viewed as a complimentary tool. Some abnormalities detected by SNPa analysis and not always recognized by karyotyping are not yet included in classification and prognosis criteria.30
Notwithstanding the progress in this area, SNPa tests have not been studied to their full potential and many questions remain to be answered; for instance:
- •
In which situation could SNPa be performed in peripheral blood samples and would the test offer the same information as for marrow samples?
- •
Do abnormalities found only by SNPa analysis present the same prognostic value as karyotyping?
- •
Should abnormal karyotypes also be investigated by SNPa in order to amplify the detection of aberrations?
- •
Should treatment options targeting specific chromosomal abnormalities be investigated by SNPa analysis before introducing the drug?
- •
Which SNPa results would drive a treatment change?
- •
What additional costs are acceptable in order to obtain better treatment definition?
In summary, SNPa analysis was standardized in AML/MDS and results were compared with the abnormalities detected by karyotyping. SNPa analysis increased the detection rate of abnormalities compared to karyotyping and also identified a new set of abnormalities that should be further investigated in future studies.
Conflict of interestThe authors declare no conflicts of interest.
The SNPa test was supported by Grupo Fleury with incentive of Financiadora de Estudos e Projetos (Finep).
ML Chauffaille received a CNPQ-Produtividade em Pesquisa grant 307747/2012-3 and FAPESP-Auxílio Pesquisa 11/51751-0 that, in part, supported this study.


