


Myeloid neoplasms result from molecular alterations in hematopoietic stem cells, with acute myeloid leukemia (AML) being one of the most aggressive and with a poor prognosis. Hematopoietic cell kinase (HCK) is a proto-oncogene that encodes a protein-tyrosine kinase of the Scr family, and it is highly expressed in AML. The present study investigated HCK expression in normal hematopoietic cells across myeloid differentiation stages and myeloid neoplasm patients. Within the AML cohort, we explored the impact of HCK expression on clinical outcomes and its correlation with clinical, genetic, and laboratory characteristics. Furthermore, we evaluated the association between HCK expression and the response to antineoplastic agents using ex vivo assay data from AML patients. HCK expression is higher in differentiated subpopulations of myeloid cells. High HCK expression was observed in patients with chronic myelomonocytic leukemia, chronic myeloid leukemia, and AML. In patients with AML, high levels of HCK negatively impacted overall and disease-free survival. High HCK expression was also associated with worse molecular risk groups and white blood cell count; however, it was not an independent prognostic factor. In functional genomic analyses, high HCK expression was associated with several biological and molecular processes relevant to leukemogenesis. HCK expression was also associated with sensitivity and resistance to several drugs currently used in the clinic. In conclusion, our analysis confirmed the differential expression of HCK in myeloid neoplasms and its potential association with unfavorable molecular risks in AML. We also provide new insights into HCK biological functions, prognosis, and response to antineoplastic agents.
Myeloid neoplasms result from molecular alterations in hematopoietic stem cells and comprise a broad spectrum of blood cancers with different pathophysiology, prognosis, and therapy. Among these, acute myeloid leukemia (AML) stands out due to its aggressiveness and unfavorable clinical outcome. In recent years, a substantial amount of knowledge about the molecular basis of AML has been generated, leading to the approval of new therapies, better risk stratifications, and advances in clinical and basic research.1,2 One example is the update of diagnostic criteria for AML with recurring molecular alterations.3
In light of these facts, several initiatives have mapped the genome and transcriptome of patients with AML and made these data publicly available. The Cancer Genome Atlas (TCGA) and Beat AML initiatives are the most well-known and used.4,5 Accompanying the evolution and availability of data, online tools have provided data compilation and enabled the generation and testing of hypotheses in real and well-documented cohorts of AML.6–8
Our research group has been characterizing the biological functions of the hematopoietic cell kinase (HCK), a proto-oncogene encoding a protein tyrosine kinase of the Src family, and assessing its potential as a pharmacological target.9–11 The HCK gene was identified as highly expressed in CD34+ cells obtained from patients with myelodysplastic syndrome (MDS) using a microarray assay12 and in patients with de novo AML.9 Genetic (shRNA) or pharmacological inhibition of HCK demonstrated relevant antileukemic effects in vitro and ex vivo cell models. Despite the growing amount of evidence on the contribution of HCK to leukemogenesis, this field of oncohematology and pharmacology has much potential to be explored.
The present study evaluated HCK expression in normal hematopoietic cells at various stages of myeloid differentiation and patients with myeloid neoplasms [MDS, chronic myelomonocytic leukemia (CMML), chronic myeloid leukemia (CML), or AML]. Within the AML cohort, our investigation delved into the impact of HCK expression on clinical outcomes and its correlation with clinical, genetic, and laboratory results. Furthermore, we evaluated the association between HCK expression and the response to antineoplastic agents using in silico analyses, using data obtained from ex vivo assays conducted on samples from AML patients.
Material and methodsAnalysis from data available on public databasesExpression data in normal and malignant hematopoietic cells: HCK mRNA expression data (probe 208018_s_at) from the different hematopoietic cell populations were obtained from the GSE24759 data set using the GEO2R platform (https://www.ncbi.nlm.nih.gov/geo/geo2r). HCK mRNA expression data (probe 208,018_s_at) from samples obtained from healthy donors (CD34+ cells, n = 5), MDS (n = 29), CMML (n = 4), CML (n = 35), and AML (n = 89) patients were obtained from the AmaZonia! Database 2008 (http://amazonia.transcriptome.eu).8 The gene expression values were obtained from cDNA microarray experiments utilizing the Affymetrix HUG133 plus 2.0 array system, and the data were crossed using tumor-specific identification numbers. Gene expression, clinical, molecular risk, and mutational profile data from the RNA-seq analysis of the TCGA AML study were obtained from cBioPortal (https://www.cbioportal.org/).6,13 Graphical visualization of HCK mRNA levels in different cytogenetic subtypes of AML were obtained from BloodSpot (https://servers.binf.ku.dk/bloodspot/).
Functional genomics analysis: All transcripts from the RNA-seq data from the TCGA AML study4 were pre-ranked according to their differential expression by comparing samples with high and low HCK expression using the normalized quantile and the limma-voom package in Galaxy (https://usegalaxy.org/). Heatmaps displaying the top 25 upregulated and 25 downregulated genes in the low and high HCK expression samples were constructed using ClusterVis (https://biit.cs.ut.ee/clustvis/). Volcano and correlation plots were created using GraphPad Prism 8.0 (GraphPad Software, San Diego, CA, USA). Gene set enrichment analysis (GSEA) was performed with GSEA v.4.014 using the Hallmark gene sets curated by MSigDB. Enrichment scores (ES) were calculated based on the Kolmogorov–Smirnov statistic, tested for significance using 1000 permutations, and normalized (NES) to determine the size of each gene set. A false discovery rate (FDR) of 25 % (q-value of < 0.25) and a p-value of < 0.05 were considered statistically significant.
Drug sensitivity prediction: The area under the curve (AUC) values resulting from the 165 drugs tested in ex vivo assays by the Beat AML study (n = 520) were used to explore the correlation between the drug response and HCK expression.15 The AUC values from 448 drugs tested in AML cell lines16 and those available in the Genomics of Drug Sensitivity in Cancer (GDSC) resource (https://www.cancerrxgene.org)17 were also used. The following AML cell lines were considered: EOL-1, MOLM-13, MOLM-16, MV4-11, NB4, OCI-AML2, OCI-AML3, PL-21, SKM1, U-937, HL-60, Kasumi-1, KG-1, and THP-1. Gene expression data of cell lines were retrieved from the Expression Atlas database (www.ebi.ac.uk/gxa/experiments/E-MTAB-2770). For a better interpretation of the results obtained, the molecular targets (proteins/genes) of the identified drugs were listed and analyzed by the GeneMANIA software (https://genemania.org/) to determine the biological and molecular processes associated with the sensitivity and resistance correlated to HCK expression.
Experimental validationCell culture and chemical reagents: NB4 and HL-60 cell lines were used for experimental validation. The cell lines were tested and authenticated by short tandem repeat (STR) matching analysis using the PowerPlex 16 HS system (Promega, Madison, WI, USA) and an ABI 3500 Sequence Detector System (Thermo Fisher Scientific, Fairlawn, NJ, USA). Cell cultures were performed following the recommendations of Deutsche Sammlung von Mikroorganismen und Zellkulturen GmbH (DSMZ). ATRA was obtained from Sigma-Aldrich (St. Louis, MO, USA).
Cell differentiation: The NB4 and HL-60 leukemia cell lines were exposed to ATRA (1 μM) for 72 h. Next, the cells were washed with ice-cold phosphate-buffered saline (PBS), resuspended in 100 μL PBS containing 5 μL of PE-labeled anti-CD11b (clone MEM-174, EXBIO Praha, a.s., Czech Republic), and incubated at room temperature in a light-protected area for 30 min. Then, the cells were washed with ice-cold PBS and resuspended in 300 μL of PBS. All specimens were obtained by flow cytometry (FACSCalibur; Becton Dickinson, Mountain View, CA, USA) and analyzed using FlowJo software (Tree Star, Inc., San Carlos, CA, USA). For morphology analysis, cells (1 × 10⁵) were adhered to microscope slides using cytospin (Serocito, model 2400; FANEM, Guarulhos, Brazil), followed by Rosenfeld staining. Images were acquired using a Leica DM2500 optical microscope and the LAS software version 4.6 (Leica, Bensheim, Germany).
Quantitative PCR: Total RNA was obtained using TRIzol Reagent (Thermo Fisher Scientific). Complementary DNA was synthesized from 1 µg of RNA using a RevertAid™ First Strand cDNA Synthesis Kit (MBI Fermentas, St. Leon-Rot, Germany). Quantitative PCR (qPCR) was performed using an ABI 7500 Sequence Detector System (Thermo Fisher Scientific) with SybrGreen System (Thermo Fisher Scientific) and specific primers for HCK (FW: GAGTTCATGGCCAAAGGAAG, RV: GGAGGTCTCGGTGGATGTAG). HPRT1 (FW: GAACGTCTTGCTCGAGATGTGA, RV: TCCAGCAGGTCAGCAAAGAAT) was used as the reference gene. The relative quantification value was calculated using the 2−ΔΔCT equation.18 A negative "no template control" was included for each primer pair. The dissociation protocol was performed at the end of each run to check for nonspecific amplification.
Statistical analysisThe impact of HCK expression on clinical outcomes [overall survival (OS) and disease-free survival (DFS)] was investigated in the cohort of 173 adult AML patients from the TCGA.4 Dichotomization was performed according to the ROC curve and its respective AUC and C-index using a maximization metric provided by the R package, Cutpointr.19,20 Statistical analyses were performed using GraphPad Prism 8 (GraphPad Software, Inc.), Stata Statistic/Data Analysis 14.1 (Stata Corp., College Station, TX, USA), and SPSS Statistics for Windows, version 21.0 (SPSS, Chicago, IL, USA). The OS was calculated as the difference in months between the diagnosis and the last follow-up or death date, and DFS between the date of complete remission and relapse or the date of the last follow-up or death (which occurred first). Survival measures were estimated using Kaplan–Meier curves and compared using the Log-rank test and/or Cox regression. Student's t-test, ANOVA, Kruskal–Wallis, or Mann–Whitney test were used for measurable factors. The chi-squared test or Fisher's exact test was used for categorical factors. A value of p < 0.05 was considered statistically significant.
ResultsHCK is highly expressed in differentiated myeloid cellsFirst, HCK transcript levels were characterized in myeloid cell subpopulations with different degrees of maturation. HCK mRNA levels were highly expressed in granulocytic and monocytic cells compared to normal hematopoietic stem cells (all p < 0.05; Figure 1A,B). Notably, NB4 and HL-60 cells showed higher levels of HCK expression after ATRA-induced granulocytic differentiation (p < 0.05 Figure 1C).
 Graphical legend for the myeloid differentiation hierarchy illustrating the analyzed cell subpopulations used in the analysis (https://mindthegraph.com/). Abbreviations: HSC, hematopoietic stem cells; CMP, common myeloid progenitor; GMP, granulocyte–macrophage progenitor; MEP, Megakaryocyte/erythrocyte progenitor; ERY, erythrocytes MEGA, megakaryocytes; META, metamyelocytes; NEU, neutrophils; EOS, eosinophils; BASO, basophils; MONO, monocytes. (B) Gene expression profile of HCK (probe 208018_s_at) in myeloid cell subpopulations (GSE24759). The p-values and cell lineages are indicated in the graphs: * p < 0.05 cell lineage vs. HSC1, #p < 0.01 cell lineage vs. HSC2; ANOVA and Bonferroni post hoc test. (C) Rosenfeld-stained cytospin preparation (magnification 400 × ) and histogram of CD11b expression in NB4 and HL-60 cells exposed to a vehicle or 1 μM ATRA for 72 h. These data are representative of at least three independent experiments. HCK mRNA expression in NB4 and HL-60 cells exposed to a vehicle or 1 μM ATRA for 72 h. The HPRT1 was used as the reference gene, and samples from vehicle-treated cells were used as calibrators. The bars indicate the mean ± SD of at least four independent experiments; **p < 0.01; Student")
HCK mRNA levels in normal hematopoietic cells and upon cell differentiation. (A) Graphical legend for the myeloid differentiation hierarchy illustrating the analyzed cell subpopulations used in the analysis (https://mindthegraph.com/). Abbreviations: HSC, hematopoietic stem cells; CMP, common myeloid progenitor; GMP, granulocyte–macrophage progenitor; MEP, Megakaryocyte/erythrocyte progenitor; ERY, erythrocytes MEGA, megakaryocytes; META, metamyelocytes; NEU, neutrophils; EOS, eosinophils; BASO, basophils; MONO, monocytes. (B) Gene expression profile of HCK (probe 208018_s_at) in myeloid cell subpopulations (GSE24759). The p-values and cell lineages are indicated in the graphs: * p < 0.05 cell lineage vs. HSC1, #p < 0.01 cell lineage vs. HSC2; ANOVA and Bonferroni post hoc test. (C) Rosenfeld-stained cytospin preparation (magnification 400 × ) and histogram of CD11b expression in NB4 and HL-60 cells exposed to a vehicle or 1 μM ATRA for 72 h. These data are representative of at least three independent experiments. HCK mRNA expression in NB4 and HL-60 cells exposed to a vehicle or 1 μM ATRA for 72 h. The HPRT1 was used as the reference gene, and samples from vehicle-treated cells were used as calibrators. The bars indicate the mean ± SD of at least four independent experiments; **p < 0.01; Student's t-test.
Next, HCK expression was evaluated in myeloid neoplasms, including MDS, CMML, CML, and AML. Transcriptional levels of HCK were increased in patients with CMML, CML, and AML compared to CD34+ cells from healthy donors (all p < 0.05, Figure 2A). In patients with AML, HCK expression was higher in the intermediate and poor molecular risk groups (p < 0.05, Figure 2B). Among the AML molecular subgroups, the highest levels of HCK were observed in patients with normal, complex, trisomy 8, and t(9;11) + other karyotypes (Figure 2C). High HCK expression negatively impacted OS (HR: 2.02, p = 0.002) and DFS (HR: 1.80, p = 0.02) in AML patients (Figure 2D).
 HCK (probe 208018_s_at) mRNA levels were compared between samples from normal hematopoietic cells (CD34+ cells), myelodysplastic syndromes (MDS), chronic myelomonocytic leukemia (CMML), chronic myeloid leukemia (CML), and acute myeloid leukemia (AML) patients. The \"y\" axis represents mRNA expression levels at arbitrary values. Number of subjects for each group are indicated. The data sets were cross-referenced using tumor-specific identification numbers. *** p < 0.001; Kruskal–Wallis test and Dunn post-hoc test. (B) HCK mRNA levels were compared among AML patients from the TCGA cohort stratified by molecular risk. Number of subjects for each group are indicated. **p < 0.01, ***p < 0.0001; Kruskal–Wallis test and Dunn post-hoc test. (C) Schematic representation of HCK expression in the different molecular subtypes of AML obtained from the BloodSpot software (https://servers.binf.ku.dk/bloodspot/). (D) Kaplan-Meier curves represent overall survival for AML patients dichotomized according to high or low HCK expression (using the ROC curve as the cut-off point). Hazard ratio (HR), 95 % confidence interval, and p values are indicated (log-rank test).")
HCK is highly expressed and negatively impacts clinical outcomes in acute myeloid leukemia. (A) HCK (probe 208018_s_at) mRNA levels were compared between samples from normal hematopoietic cells (CD34+ cells), myelodysplastic syndromes (MDS), chronic myelomonocytic leukemia (CMML), chronic myeloid leukemia (CML), and acute myeloid leukemia (AML) patients. The "y" axis represents mRNA expression levels at arbitrary values. Number of subjects for each group are indicated. The data sets were cross-referenced using tumor-specific identification numbers. *** p < 0.001; Kruskal–Wallis test and Dunn post-hoc test. (B) HCK mRNA levels were compared among AML patients from the TCGA cohort stratified by molecular risk. Number of subjects for each group are indicated. **p < 0.01, ***p < 0.0001; Kruskal–Wallis test and Dunn post-hoc test. (C) Schematic representation of HCK expression in the different molecular subtypes of AML obtained from the BloodSpot software (https://servers.binf.ku.dk/bloodspot/). (D) Kaplan-Meier curves represent overall survival for AML patients dichotomized according to high or low HCK expression (using the ROC curve as the cut-off point). Hazard ratio (HR), 95 % confidence interval, and p values are indicated (log-rank test).
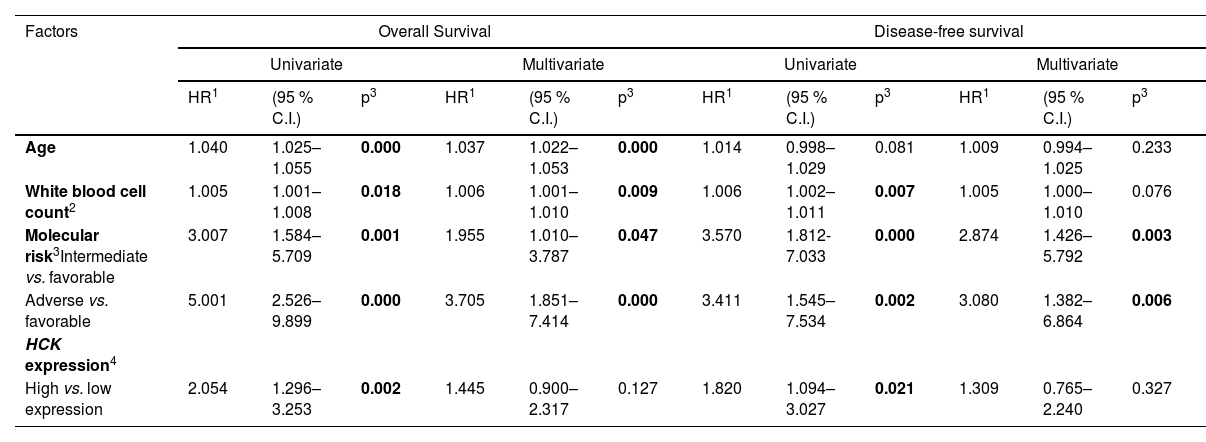
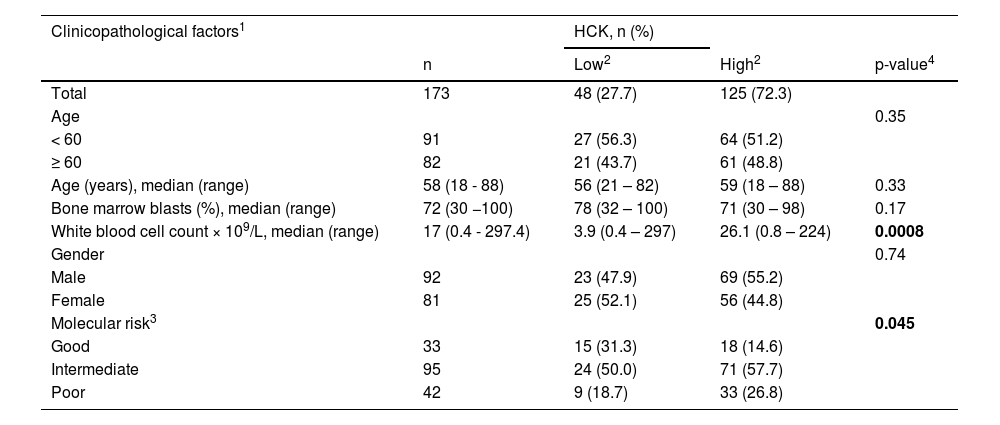
Similar results were obtained by Cox regression in univariate analyses (Table 1). However, when age, white blood cell count, and molecular risk were used as covariates, HCK expression was not an independent prognostic factor. However, a strong association between molecular risk and white blood cell count was observed (Table 2). Regarding the mutational profile, high HCK expression was associated with a lower frequency of mutations in IDH1 and a higher frequency of mutations in CEBPA (all p < 0.05, Supplementary Table 1).
Univariate and multivariate analysis for overall survival and disease-free survival of acute myeloid leukemia patients from TCGA cohort according to clinical and laboratorial characteristics and HCK expression.
| Factors | Overall Survival | Disease-free survival | ||||||||||
|---|---|---|---|---|---|---|---|---|---|---|---|---|
| Univariate | Multivariate | Univariate | Multivariate | |||||||||
| HR1 | (95 % C.I.) | p3 | HR1 | (95 % C.I.) | p3 | HR1 | (95 % C.I.) | p3 | HR1 | (95 % C.I.) | p3 | |
| Age | 1.040 | 1.025–1.055 | 0.000 | 1.037 | 1.022–1.053 | 0.000 | 1.014 | 0.998–1.029 | 0.081 | 1.009 | 0.994–1.025 | 0.233 |
| White blood cell count2 | 1.005 | 1.001–1.008 | 0.018 | 1.006 | 1.001–1.010 | 0.009 | 1.006 | 1.002–1.011 | 0.007 | 1.005 | 1.000–1.010 | 0.076 |
| Molecular risk3Intermediate vs. favorable | 3.007 | 1.584–5.709 | 0.001 | 1.955 | 1.010–3.787 | 0.047 | 3.570 | 1.812- 7.033 | 0.000 | 2.874 | 1.426–5.792 | 0.003 |
| Adverse vs. favorable | 5.001 | 2.526–9.899 | 0.000 | 3.705 | 1.851–7.414 | 0.000 | 3.411 | 1.545–7.534 | 0.002 | 3.080 | 1.382–6.864 | 0.006 |
| HCK expression4 | ||||||||||||
| High vs. low expression | 2.054 | 1.296–3.253 | 0.002 | 1.445 | 0.900–2.317 | 0.127 | 1.820 | 1.094–3.027 | 0.021 | 1.309 | 0.765–2.240 | 0.327 |
Abbreviations: TCGA, The Cancer Genome Atlas.
Significant statistical differences are highlighted in bold.
Association of HCK expression with clinical and molecular factors in TCGA acute myeloid leukemia cohort.
| Clinicopathological factors1 | HCK, n (%) | |||
|---|---|---|---|---|
| n | Low2 | High2 | p-value4 | |
| Total | 173 | 48 (27.7) | 125 (72.3) | |
| Age | 0.35 | |||
| < 60 | 91 | 27 (56.3) | 64 (51.2) | |
| ≥ 60 | 82 | 21 (43.7) | 61 (48.8) | |
| Age (years), median (range) | 58 (18 - 88) | 56 (21 – 82) | 59 (18 – 88) | 0.33 |
| Bone marrow blasts (%), median (range) | 72 (30 −100) | 78 (32 – 100) | 71 (30 – 98) | 0.17 |
| White blood cell count × 109/L, median (range) | 17 (0.4 - 297.4) | 3.9 (0.4 – 297) | 26.1 (0.8 – 224) | 0.0008 |
| Gender | 0.74 | |||
| Male | 92 | 23 (47.9) | 69 (55.2) | |
| Female | 81 | 25 (52.1) | 56 (44.8) | |
| Molecular risk3 | 0.045 | |||
| Good | 33 | 15 (31.3) | 18 (14.6) | |
| Intermediate | 95 | 24 (50.0) | 71 (57.7) | |
| Poor | 42 | 9 (18.7) | 33 (26.8) |
Abbreviations: TCGA, The Cancer Genome Atlas; AML, acute myeloid leukemia.
The dichotomization of AML patients into high and low HCK expression defined two groups with distinct genetic signatures (Figure 3A-C), which were associated with relevant biological and molecular processes in the development and progression of AML (Figure 3D and Supplementary Table 2). For example, there are positive correlations between high HCK expression and inflammatory response, IL6/JAK/STAT3 signaling, apoptosis, PI3K/AKT/mTOR signaling, IL2/STAT5 signaling, P53 pathway, KRAS signaling, hypoxia, reactive oxygen species (ROS) pathway, and NOTCH signaling (all FDR < 0.25 and p < 0.05, Figure 3D).
 Heatmap constructed using ClusterVis that summarizes the expression of the top 25 upregulated and 25 downregulated genes for high versus low HCK expression. Color intensity represents the ɀ-score within each row. (B) Volcano plots depicting the extent (x-axis) and significance (y-axis) of differential gene expression for each gene, comparing high versus low HCK. (C) Spearman correlation showing the genes positively and negatively correlating with the HCK in AML TCGA patients. (D) Gene Set Enrichment Analysis (GSEA) plots for biological processes associated with HCK expression in AML patients. The top portion of the plot shows the running enrichment scores (ESs) for the gene set. The point with the maximum deviation from zero is defined as the ES for the gene set. The leading-edge subset (the subset of genes with the most significant contribution to the ES) is shown as a vertical bar accumulating before the peak score for a positive ES or after the peak score for a negative ES. FDR-adjusted p values (NOM p-value) and enrichment scores normalized for gene set size (NES) are indicated.")
HCK transcript levels are associated with relevant biological and molecular processes involved in acute myeloid leukemia development and progression. (A) Heatmap constructed using ClusterVis that summarizes the expression of the top 25 upregulated and 25 downregulated genes for high versus low HCK expression. Color intensity represents the ɀ-score within each row. (B) Volcano plots depicting the extent (x-axis) and significance (y-axis) of differential gene expression for each gene, comparing high versus low HCK. (C) Spearman correlation showing the genes positively and negatively correlating with the HCK in AML TCGA patients. (D) Gene Set Enrichment Analysis (GSEA) plots for biological processes associated with HCK expression in AML patients. The top portion of the plot shows the running enrichment scores (ESs) for the gene set. The point with the maximum deviation from zero is defined as the ES for the gene set. The leading-edge subset (the subset of genes with the most significant contribution to the ES) is shown as a vertical bar accumulating before the peak score for a positive ES or after the peak score for a negative ES. FDR-adjusted p values (NOM p-value) and enrichment scores normalized for gene set size (NES) are indicated.
Finally, we questioned whether HCK levels could impact the response to antineoplastic agents in AML models. In the Beat AML study,5,15 transcriptional levels of HCK were positively correlated with fifteen drugs (artemisinin, GW-2580, DBZ, Bay 11–7085, S31–201, NF-kB activation inhibitor, CYT387, SB-431,542, doramapimod, idelalisib, azacytidine, JNJ-38,877,605, ruxolitinib, roscovitine, and GSK-1904529A; all p < 0.05) and negatively correlated with two drugs (entrectinib and panobinostat; all p < 0.05) in assays with primary cells from AML patients (Figure 4A). Additionally, in the study by Lee et al.16 that used AML cell lines, HCK mRNA levels were negatively correlated with twenty-two drugs (tretinoin, etoposide, mitoxantrone, vincristine, PKI-587, tamibarotene, bexarotene, cladribine, vinblastine, mitomycin C, melphalan, daunorubicin, AZD7762, AC-220, pazopanib, tozasertib, AT-7519, PD0332991, irinotecan, fludarabine, BI-2536, and PF-04691502; all p < 0.05) and positively correlated with three drugs (DBZ, valproic acid, and pravastatin; all p < 0.05; Figure 4B).
 and in vitro (B) assays. Drugs with p < 0.05, as determined by the Spearman correlation test, are indicated. (C) The molecular targets (proteins/genes) of the identified drugs were listed and analyzed by GeneMANIA software (https://genemania.org/) to determine the biological and molecular processes associated with the sensitivity and resistance correlated to HCK expression. FDR values are indicated.")
HCK expression is associated with drug sensitivity in ex vivo and in vitro assays in acute myeloid leukemia. Drug sensitivity according to HCK expression in ex vivo (A) and in vitro (B) assays. Drugs with p < 0.05, as determined by the Spearman correlation test, are indicated. (C) The molecular targets (proteins/genes) of the identified drugs were listed and analyzed by GeneMANIA software (https://genemania.org/) to determine the biological and molecular processes associated with the sensitivity and resistance correlated to HCK expression. FDR values are indicated.
The molecular targets of the identified drugs were analyzed in a network to identify the biological and molecular processes associated with sensitivity and resistance based on HCK expression. We found that drugs negatively associated with HCK expression modulate transmembrane receptor protein kinase activity, protein tyrosine kinase activity, ligand-activated transcription factor activity, regulation of PI3K signaling, and ERK1 and ERK2 cascade (all FDR < 0.01, Figure 4C). In contrast, drugs positively associated with HCK expression modulate transmembrane receptor protein kinase activity, protein serine/threonine kinase activity, response to peptide hormone, myeloid cell differentiation, and cytokine receptor binding (all FDR < 0.01, Figure 4C).
DiscussionIn the present study, we took advantage of publicly deposited data containing HCK gene expression in the normal and neoplastic myeloid compartment to better understand this gene's biological characteristics and role in the prognosis and potential response to therapies. The HCK gene was initially characterized as abundant in lymphoid and myeloid lineages of hematopoietic cells21; however, recent studies have indicated a role for this gene in solid tumors.22–26 The increased expression of HCK in differentiated myeloid cells is notable. Previously, our research group described a revealing role for HCK in erythroid cell differentiation.9 It was later shown that amplification of the HCK gene can result in aberrant marrow erythroid maturation and splenomegaly, recapitulating the phenotype of myeloproliferative neoplasm.27 In this present study, the increase in HCK expression in the myeloid compartment was validated in experiments using cell lines and suggests that HCK participates in signal transduction and functions in immune system cells. In this context, HCK has been associated with macrophage activation,28 neutrophil-mediated autoinflammation,29 tumor progression through myeloid infiltrates in solid tumors,30 or even participating in the response to immunotherapy through T cell infiltration.31 Thus, the role of HCK must be interpreted in a context-dependent manner.
Of note, paradoxical data was found in our analyses: HCK expression increases during cellular differentiation of normal myeloid cells, and HCK expression increases in leukemic cells. These data suggest that asynchronous expression of HCK during aberrant differentiation of leukemic blasts could confer proliferative, survival, and aberrant response to chemotaxis advantages. Indeed, asynchronous expression of differentiation markers is a common event in leukemic blasts.32,33 However, the different roles of HCK in the differentiation of normal and malignant hematopoietic cells still need further investigation.
In a previous study, our research group reported high HCK expression in CD34+ cells isolated from de novo AML patients and low-risk MDS patients from a small single-center cohort.9 Data obtained from publicly deposited cohorts confirm the initial findings and expand the observation to other myeloid neoplasms such as CMML and CML. Using the AML cohort of the TCGA and a statistical tool to define the best cut-off point for dichotomization into two groups (low and high HCK expression), we observed that high HCK expression negatively impacts the clinical outcomes of patients with AML. Similar results were reported for the TCGA and two independent cohorts but with arbitrary (median) cut-off points.34,35 Among these investigations, our study was better at accurately identifying two groups with distinct prognoses based on HCK expression, highlighting the importance of using statistical tools for dichotomizing cohorts for gene expression analysis.
Recently, HCK has gained prominence in the phosphoproteome analyses of the TCGA AML cohort: FLT3-TKD mutations were associated with phosphorylation of the active site tyrosine-411 of HCK, suggesting a role for HCK in the mutated-FLT3 signaling.36 In our functional genomics analysis, the correlation between high HCK expression and pathways known to be modulated by it, such as PI3K/AKT/mTOR, MAPK, and JAK/STAT,9,37 stands out. Functional in vitro and in vivo studies suggest that HCK may sustain the self-renewal ability of leukemic stem cells by activating the ERK1/2-MYC-CDK6 signaling axis in AML.34 On the other hand, pathways such as NOTCH signaling, hypoxia, and ROS identified in the present study open new perspectives for further investigation.
Given the promising results of the contributions of HCK to the phenotype of hematological neoplasms, pharmacological inhibitors of this kinase with different degrees of selectivity were identified, including iHCK-37,9 KIN-8194 (dual HCK/BTK inhibitor),38 dasatinib,31 and RK-20449.31 Faced with several possibilities for pharmacological intervention in HCK, our study identified the impact of HCK transcript levels on the response to antineoplastic agents, which may open new perspectives for therapeutic combinations. For example, in this present study, high HCK expression was associated with 5-azacytidine resistance in the ex vivo assays of the Beat AML study. In a previous study, the pharmacological HCK inhibition, using iHCK-37, potentiated the reduction in cell viability induced by 5-azacytidine in KG1a, HL-60, and K-562 leukemia cells.11 In addition, iHCK-37 increased 5-azacytidine-induced apoptosis in CD34+ cells isolated from de novo AML patients.11
Our study opens perspectives for the function of HCK in myeloid neoplasms; however, it has limitations. In the cohorts studied, the data available for MDS, CMML, and CML are limited and do not allow for a clinical-laboratory association with the expression of HCK, which would be relevant, especially in the case of MDS, a very heterogeneous disease. Another point that deserves to be highlighted is that our study was based on gene expression, and validations using protein expression analyses should be considered in future studies.
In summary, our analyses confirmed the differential expression of HCK in myeloid neoplasms and its potential association with unfavorable molecular risks in AML. We also provided new insights into the biological functions of HCK and its influence on disease prognosis and response to antineoplastic agents.
M.F.L.C., B.O.A., H.P.V., and K.L. received a fellowship from FAPESP (grants #2022/14505-6, #2022/11038-8, #2021/01460-1, and #2020/12842-0). This study was supported by grants #2019/23864-7 and #2021/11606-3 from the São Paulo Research Foundation (FAPESP). This study was financed in part by the Coordenação de Aperfeiçoamento de Pessoal de Nível Superior, Brasil (CAPES), Finance Code 001.


