


Dear Editor,
Acute myeloid leukemia (AML) comprises a molecularly heterogeneous group of diseases characterized by the proliferation and accumulation of myeloid blasts in the bone marrow, peripheral blood, and other organs, with suppression of normal hematopoiesis.1 Some recurrent genetic alterations play a central role in the pathogenesis, diagnosis, and prognosis of the disease.2 However, the identification of new prognostic markers may improve risk stratification and therapeutic decision in AML. Recently, our research group identified four genes associated with cytoskeletal regulation that impact the prognosis of patients with AML.3 In the present study, we sought to understand ARHGAP6 expression in association with clinical–biological features of AML.
Taking advantage of public available resources, we performed multiple transcriptomic analyzes to verify the potential contributions of ARHGAP6 to AML. ARHGAP6 mRNA expression data (probe 206167_s_at) from the different hematopoietic cell populations were obtained from the GSE24759 data set using the GEO2R platform (https://www.ncbi.nlm.nih.gov/geo/geo2r). ARHGAP6 transcript levels data (probe 206167_s_at) from samples obtained from healthy donors (CD34+ samples [n = 8] and total bone marrow cells [n = 5]) and AML patients (n = 577) were derived from AmaZonia! database 2008 (http://amazonia.transcriptome.eu).4 Gene expression, genetic and clinical data from The Cancer Genome Atlas (TCGA) AML study5 (n = 173, Table 1) were obtained from cBioPortal (https://www.cbioportal.org/).6 Gene expression data were used as continuous or categorical variables. Dichotomization was realized according to the ROC curve and its respective area under the curve and the C-index using a maximization metric provided by the R package Cutpointr.7 For internal data validation, the bootstrap resampling tool was used.8,9
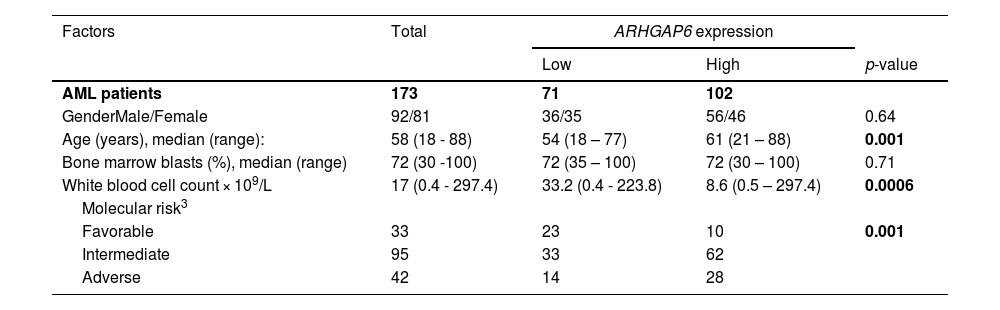
Acute myeloid leukemia (AML) patients’ characteristics from TCGA AML1 study and their association with ARHGAP6 gene expression2
Abbreviations: TCGA, The Cancer Genome Atlas; AML, acute myeloid leukemia.
1The clinical and laboratorial data of TCGA AML cohort were obtained from cBioPortal for Cancer Genomics (http://www.cbioportal.org).
2Gene expression values were dichotomized by ROC curve and C statistic.
3Molecular risk was stratified according TCGA study; 3 AML patients were not classified.
4For statistical analyzes, Mann–Whitney test was used for measured factors, and Fisher's exact test or Chi-squared test was used for categorical factors.
For functional genomic analysis, all transcripts were pre-ranked according to their differential expression by comparing samples with high and low ARHGAP6 expression using the limma-voom package at Galaxy (https://usegalaxy.org/). Gene Set Enrichment Analysis (GSEA) was performed with GSEA v.4.0,10 as previously described.3 A false discovery rate of 25% (FDR q-value < 0.25) and a p - value < 0.05 were considered statistically significant. A heatmap was constructed using ClusterVis (https://biit.cs.ut.ee/clustvis/) to represent the top 50 differentially expressed genes between high and low ARHGAP6 expression samples. Volcano plot correlating the adjusted -log10 p-value and log2-fold-change and Spearman correlation plot were constructed in GraphPad Prism 8.0 (GraphPad Software, Inc., CA, USA).
Statistical analyses were performed using GraphPad Prism 8, Stata Statistic/Data Analysis 14.1 (Stata Corporation, USA), and SPSS Statistics for Windows, version 21.0 (SPSS, Chicago, IL, USA). Overall survival (OS) was calculated as the difference in months between diagnosis and the last follow-up or death, and disease-free survival (DFS) between the date of complete remission and relapse or the date of the last follow-up or death (which occurred first). Survival measures were estimated using Kaplan-Meier curves and compared using the Log-rank test and/or Cox regression. ANOVA and Bonferroni post-test, Kruskal Wallis and Dunn's test, or Mann-Whitney test were used for measurable factors, as appropriate. A value of p < 0.05 was considered statistically significant.
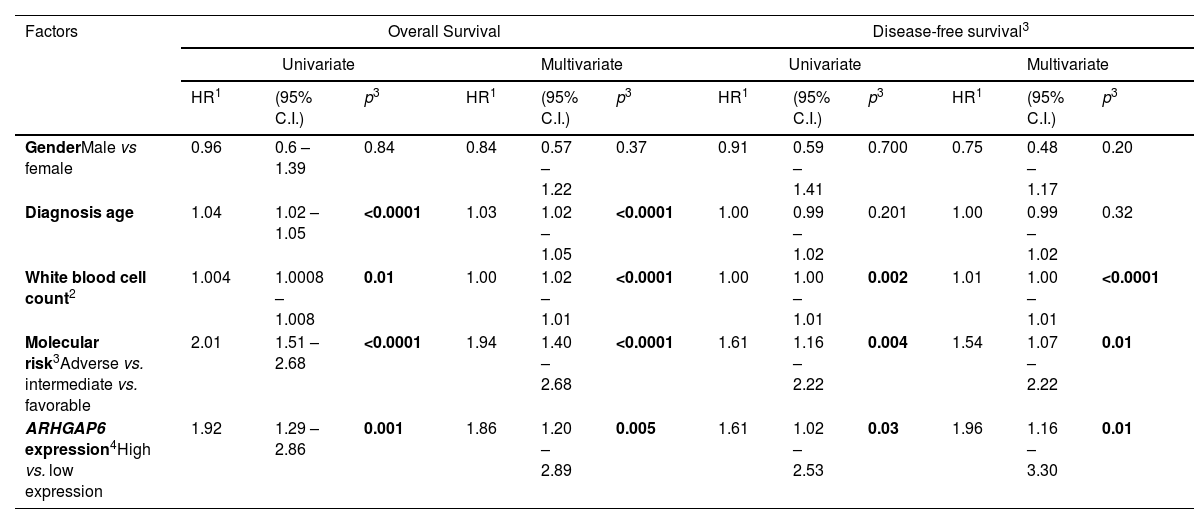
Firstly, since there are no descriptions of ARHGAP6 in processes associated with normal or malignant hematopoiesis, we characterized the expression of this gene in different subpopulations of myeloid cells (Figure 1A). Megakaryocytes and granulocytic progenitors had the highest levels of ARHGAP6 when compared to hematopoietic stem cells (p < 0.05, Figure 1B). Next, ARHGAP6 expression was compared between samples derived from healthy donors and patients with AML and a significant reduction in ARHGAP6 levels was observed in the group of patients with AML (p ≤ 0.05, Figure 1C). Among AML patients, ARHGAP6 expression was associated with age, white blood cell count, and molecular risk (p < 0.05, Table 1). Corroborating these findings, AML patients with intermediate and adverse molecular risk had higher transcriptional levels of ARHGAP6 compared with favorable risk group (p < 0.01, Figure 1D). Of note, high ARHGAP6 expression was associated with poor survival outcomes (p < 0.05, Figure 1E). The bootstrap resampling procedure revealed bias-independent accuracy of the ARHGAP6 prediction as well as the absence of overfitting in the cohort for overall survival analysis (Supplementary Table 1). In the multivariate analysis, ARHGAP6 transcript levels were an independent prognostic factor for overall and disease-free survival in the TCGA AML cohort (p < 0.03, Table 2).
 patients. (A) Schematic representation of the myeloid differentiation hierarchy illustrating the analyzed cell subpopulations used in the analysis (https://mindthegraph.com/). Abbreviations: HSC, hematopoietic stem-cells; CMP, common myeloid progenitor; GMP, granulocyte macrophage progenitor; MEP, Megakaryocyte/erythrocyte progenitor; ERY, erythrocytes; MEGA, megakaryocytes; META, metamyelocytes; NEU, neutrophils; EOS, eosinophils; BASO, basophils; MONO, monocytes. (B) Gene expression profile of ARHGAP6 (probe 206167_s_at) in myeloid cell subpopulations (GSE24759). The p-values and cell lineages are indicated in the graphs: * p < 0.05 cell lineage vs. HSC1, #p < 0.01 cell lineage vs. HSC2; ANOVA and Bonferroni post hoc test. (C)ARHGAP6 (probe 206167_s_at) mRNA levels were compared between samples from normal hematopoietic cells (normal bone marrow n = 5, CD34+ cells n = 8) and AML patients (n = 577). The “y” axis represents mRNA expression levels at arbitrary values. The data sets were cross-referenced using tumor-specific identification numbers. *** p < 0.001; Mann–Whitney U test. (D)ARHGAP6 mRNA levels were compared among AML patients from TCGA cohort stratified by molecular risk. Numbers of subjects for each group are indicated. **p < 0.01, ***p < 0.0001; Kruskal–Wallis test and Dunn post-hoc test. (E) Kaplan-Meier curves represent overall survival for AML patients dichotomized according to high or low ARHGAP6 expression (using the ROC curve as the cut-off point). Hazard ratio (HR), 95% confidence interval, and p values are indicated (log-rank test). (F) Heatmap constructed using ClusterVis that summarizes the expression of the top 25 upregulated and 25 downregulated genes for high versus low ARHGAP6 expression. Color intensity represents the ɀ-score within each row. (G) Volcano plots depicting the extent (x-axis) and significance (y-axis) of differential gene expression for each gene, comparing high versus low ARHGAP6. (H) Spearman correlation showing the genes positively and negatively correlating with the ARHGAP6 in AML TCGA patients. (I) Gene Set Enrichment Analysis (GSEA) plots for biological processes associated with ARHGAP6 expression in AML patients. The top portion of the plot shows the running enrichment scores (ES) for the gene set. The point with the maximum deviation from zero is defined as the ES for the gene set. The leading-edge subset (the subset of genes with the most significant contribution to the ES) is shown as a vertical bar accumulating before the peak score for a positive ES or after the peak score for a negative ES. FDR-adjusted p values (NOM p-value) and enrichment scores normalized for gene set size (NES) are indicated.")
ARHGAP6 transcript levels are associated with molecular risk and impact survival outcomes and biological characteristics in acute myeloid leukemia (AML) patients. (A) Schematic representation of the myeloid differentiation hierarchy illustrating the analyzed cell subpopulations used in the analysis (https://mindthegraph.com/). Abbreviations: HSC, hematopoietic stem-cells; CMP, common myeloid progenitor; GMP, granulocyte macrophage progenitor; MEP, Megakaryocyte/erythrocyte progenitor; ERY, erythrocytes; MEGA, megakaryocytes; META, metamyelocytes; NEU, neutrophils; EOS, eosinophils; BASO, basophils; MONO, monocytes. (B) Gene expression profile of ARHGAP6 (probe 206167_s_at) in myeloid cell subpopulations (GSE24759). The p-values and cell lineages are indicated in the graphs: * p < 0.05 cell lineage vs. HSC1, #p < 0.01 cell lineage vs. HSC2; ANOVA and Bonferroni post hoc test. (C)ARHGAP6 (probe 206167_s_at) mRNA levels were compared between samples from normal hematopoietic cells (normal bone marrow n = 5, CD34+ cells n = 8) and AML patients (n = 577). The “y” axis represents mRNA expression levels at arbitrary values. The data sets were cross-referenced using tumor-specific identification numbers. *** p < 0.001; Mann–Whitney U test. (D)ARHGAP6 mRNA levels were compared among AML patients from TCGA cohort stratified by molecular risk. Numbers of subjects for each group are indicated. **p < 0.01, ***p < 0.0001; Kruskal–Wallis test and Dunn post-hoc test. (E) Kaplan-Meier curves represent overall survival for AML patients dichotomized according to high or low ARHGAP6 expression (using the ROC curve as the cut-off point). Hazard ratio (HR), 95% confidence interval, and p values are indicated (log-rank test). (F) Heatmap constructed using ClusterVis that summarizes the expression of the top 25 upregulated and 25 downregulated genes for high versus low ARHGAP6 expression. Color intensity represents the ɀ-score within each row. (G) Volcano plots depicting the extent (x-axis) and significance (y-axis) of differential gene expression for each gene, comparing high versus low ARHGAP6. (H) Spearman correlation showing the genes positively and negatively correlating with the ARHGAP6 in AML TCGA patients. (I) Gene Set Enrichment Analysis (GSEA) plots for biological processes associated with ARHGAP6 expression in AML patients. The top portion of the plot shows the running enrichment scores (ES) for the gene set. The point with the maximum deviation from zero is defined as the ES for the gene set. The leading-edge subset (the subset of genes with the most significant contribution to the ES) is shown as a vertical bar accumulating before the peak score for a positive ES or after the peak score for a negative ES. FDR-adjusted p values (NOM p-value) and enrichment scores normalized for gene set size (NES) are indicated.
Univariate and multivariate analysis for overall survival and disease-free survival of acute myeloid leukemia patients from TCGA cohort according to clinical and laboratorial characteristics and ARHGAP6 expression.
| Factors | Overall Survival | Disease-free survival3 | ||||||||||
|---|---|---|---|---|---|---|---|---|---|---|---|---|
| Univariate | Multivariate | Univariate | Multivariate | |||||||||
| HR1 | (95% C.I.) | p3 | HR1 | (95% C.I.) | p3 | HR1 | (95% C.I.) | p3 | HR1 | (95% C.I.) | p3 | |
| GenderMale vs female | 0.96 | 0.6 – 1.39 | 0.84 | 0.84 | 0.57 – 1.22 | 0.37 | 0.91 | 0.59 – 1.41 | 0.700 | 0.75 | 0.48 – 1.17 | 0.20 |
| Diagnosis age | 1.04 | 1.02 – 1.05 | <0.0001 | 1.03 | 1.02 – 1.05 | <0.0001 | 1.00 | 0.99 – 1.02 | 0.201 | 1.00 | 0.99 – 1.02 | 0.32 |
| White blood cell count2 | 1.004 | 1.0008 – 1.008 | 0.01 | 1.00 | 1.02 – 1.01 | <0.0001 | 1.00 | 1.00 – 1.01 | 0.002 | 1.01 | 1.00 – 1.01 | <0.0001 |
| Molecular risk3Adverse vs. intermediate vs. favorable | 2.01 | 1.51 – 2.68 | <0.0001 | 1.94 | 1.40 – 2.68 | <0.0001 | 1.61 | 1.16 – 2.22 | 0.004 | 1.54 | 1.07 – 2.22 | 0.01 |
| ARHGAP6 expression4High vs. low expression | 1.92 | 1.29 – 2.86 | 0.001 | 1.86 | 1.20 – 2.89 | 0.005 | 1.61 | 1.02 – 2.53 | 0.03 | 1.96 | 1.16 – 3.30 | 0.01 |
Abbreviations: TCGA, The Cancer Genome Atlas.
Significant statistical differences are highlighted in bold.
Finally, the stratification of AML patients into high versus low ARHGAP6 expression identified distinct gene signatures (Figure 1F-H) associated with molecular and biological processes relevant to leukemogenesis (Supplementary Table 2). Of these, we highlight that the high ARHGAP6 expression was positively correlated with IL6/JAK/STAT3 signaling, NOTCH signaling, IL2/STAT5 signaling, TGF-BETA signaling, and KRAS signaling (all FDR < 0.25 and p < 0.05, Figure 1I).
The ARHGAP6 gene was cloned and characterized for the first time in a screening that sought to identify genes in the critical region in Xp22.3 associated with microphthalmia with linear skin defects syndrome is an X-linked dominant, a male-lethal disorder.11 Later, its functional characterization identified its action as GTPase-activating for RhoA and in the regulation of actin polymerization.12 In the field of oncology, the number of studies on ARHGAP6 is still very limited. In solid tumors (i.e., cervical carcinoma, lung cancer, breast cancer, and bladder cancer), ARHGAP6 acts as a tumor suppressor, inhibiting cell cycle progression, proliferation, survival, migration, invasion, and in vivo tumorigenesis.13–16 On the molecular level, ARHGAP6 function has been associated with the modulation of RhoA, MMP9, VEGF, STAT3, and β-catenin.14–16 These findings corroborate the lower expression of ARHGAP6 observed in AML patients. However, once the disease is established, ARHGAP6 may act as an oncogene, suggesting a paradoxical role for this gene in the development and progression of leukemia. The functional genomic analysis supports this hypothesis as high ARHGAP6 expression is positively associated with gene signatures of signaling pathways relevant to the proliferation and survival of leukemic blasts.
In summary, our results indicate that high expression of ARHGAP6 is associated with unfavorable molecular risk, poor survival outcomes, and molecular processes associated with leukemogenesis. Taken together, these findings suggest that ARHGAP6 may be involved with the pathogenesis and progression of AML and deserve future functional studies in experimental models.
J.C.L.S., H.P.V., and K.L. received a fellowship from FAPESP (grants #2020/12909-7, #2021/01460-1, and #2020/12842-0). This study was supported by grants #2019/23864-7 and #2021/11606-3 from the São Paulo Research Foundation (FAPESP). This study was financed in part by the Coordenação de Aperfeiçoamento de Pessoal de Nível Superior, Brasil (CAPES), Finance Code 001.


