
Urgent blood component transfusions may be life-saving for patients in hemorrhagic shock. Measures to reduce the time taken to provide these transfusions, such as uncrossmatched transfusion or abbreviated testing, are available. However, transport time is still an additional delay and the use of a pneumatic tube system (PTS) may be an alternative to shorten the transport time of blood components.
ObjectivesTo assess pneumatic tube system transportation of blood components based on a validation protocol. Methods: Pre- and post-transport quality control laboratory parameters, visual appearance, transport time and temperature of the packed red blood cells (RBCs), thawed fresh plasma (TFP), cryoprecipitate (CR), and platelet concentrate (PC) were evaluated. Parameters were compared between transport via pneumatic tube and courier.
ResultsA total of 23 units of RBCs, 50 units of TFP, 30 units of CR and ten units of PC were evaluated. No statistically significant differences were found between pre- and post-transport laboratory results. There was also no difference in laboratory parameters between transport modalities (PTS versus courier). All blood components transported matched regulatory requirements for quality criteria. The temperature during transport remained stable and the transport time via PTS was significantly shorter than the courier's transport time (p < 0.05).
ConclusionThe PTS was considered a fast, safe and reliable means of transportation for blood components, also securing quality prerequisites.
The transport of blood components from the blood bank to the medical ward is an essential step in blood transfusion, especially for bleeding patients, in hemorrhagic shock, when immediate transfusions may be decisive in this process.1-3
Currently, the transportation of blood components to the patient units occurs mainly via courier, using specific transport containers designed to keep the temperature within the regulatory limits for this purpose. In this modality of transport, a qualified employee assigned to this function personally takes the transport box from the blood bank, delivering it to the patient ward.
For being a fast and low-cost transport, some hospitals implement pneumatic tube systems (PTSs) to transport medications, blood samples and even blood components to different areas of the hospital.4,5
At our institution, the blood bank used a pneumatic tube system for many years. However, it was designed exclusively for the transport of blood samples for laboratory tests. In March 2020, an upgraded PTS, the Sumetzberger Pneumatic Tube System, replaced the structure of the previous PTS. The new system is capable of transporting blood components, providing a shorter waiting time for transfusions and relieving some workload. Furthermore, healthcare is constantly pursuing ways to optimize the use of resources and innovative technologies for better patient care.
The American Association of Blood Banks (AABB) provides some guidelines underscoring the main recommendations for PTS validation6:
- •
Suitability of the product type: evaluate which blood components will be transported via pneumatic tube and the maximum number of units transported in the same shipment.
- •
Temperature during transport: control the temperature during transport to ensure that blood components remain at the proper temperature.
- •
Time: control the transport time from the moment the capsule leaves the starting point to its arrival at the destination. This time should not exceed 10 min.
- •
Product receipt: have a mechanism that tracks the receipt of the blood component to perform visual inspection.
- •
Packing: provide a packing to prevent leakage and contamination of the transport system.
Several factors may affect the transport of blood components by PTS, potentially causing functional and biochemical alterations: the path traveled, the programmed speed of dispatch and the acceleration and deceleration forces. In addition to these factors, mechanical forces and the distance traveled through the PTS can also cause hemolysis in packed red blood cells (RBCs). Non-immune hemolysis in RBCs can elicit transfusion reactions in patients.2,7 Therefore, it is necessary to adequately assess these parameters to validate this transportation for blood components.2
This study aimed to validate the transport of blood components via PTS, evaluating the effect of mechanical forces and temperature on blood components before and after transport to secure their integrity and quality.
MethodsSystem descriptionThe Sumetzberger Pneumatic Tube System (Ing. Sumetzberger GMBH, Viena, Austria) is assembled as transmitting and receiving stations connected by a network of tubes. Transported material is placed in a carrier capsule that, through an airflow generated by one or more fans, is pushed through tubes with total autonomy. The transport speed ranges from a minimum of 3 m/s and a maximum of 6 m/s (75hz). Capsule braking occurs by staggered deceleration. An exclusive capsule was provided for transportation, with an approximate transport time of 2 to 3 min from the blood bank to the surgical ward, calculated based on the distance between the units (approximately 463 m).
Blood componentsThe RBCs, thawed fresh plasma (TFP), cryoprecipitate (CR) and platelet concentrate and plateletpheresis (PC) units were tested.
Selected RBCs had the following characteristics: irradiated units within up to 14 days of collection and unmodified units within up to 10 days of collection, from 11 to 20 days of collection and 21 to 30 days of collection. The frozen plasma (FP) units selected were within up to 30 days of collection and were thawed in an automatic defroster in the validated time of 10 to 12 min. The CR used was within up to 60 days of collection and thawed in an automatic defroster at the validated time of 3 min. The PC and plateletpheresis units selected had their collection time according to the component stock.
All RBC, FP, CR and PC units used for validation were subsequently discarded, except for plateletpheresis units, which were reintegrated into the stock after visual appearance and temperature analysis.
Parameters evaluated in blood componentsTo assess the impact of transportation via PTS on blood components, tests were performed before and after transport. For RBCs, the following parameters were evaluated: hemoglobin (Hb), hematocrit (Ht), using the ROCHE XN-9000® equipment, hemolysis index, potassium (K), aspartate aminotransferase (AST) and lactate dehydrogenase (LDH), by the ABBOTT Alinity C® equipment, free hemoglobin by Hemocue Plasma/Low Hb® and assessment of visual hemolysis using the Haemonetics® hemolysis ruler.
To assess the frequent pattern (FP) growth, prothrombin time (PT), activated partial thromboplastin time (APTT) and factor VIII, the STAGO Sta-R Max® and Sta-Compact Max® equipment were utilized. Fibrinogen was evaluated in computed radiography (CR) units, the platelet count and mean platelet volume (MPV), in parsec (PC) units, assessed by the ROCHE XN-9000® equipment, and the pH, PCO2, HCO3, and PO2 were determined by the RADIOMETER ABL 800 Flex® equipment.
The selected blood components were transported simultaneously via pneumatic tube and qualified courier. Tests were performed on blood components of both types of transport, before and after transport. Samples of the tested units were collected and immediately sent to the laboratory in coolers with adequate transport temperature for each blood component.
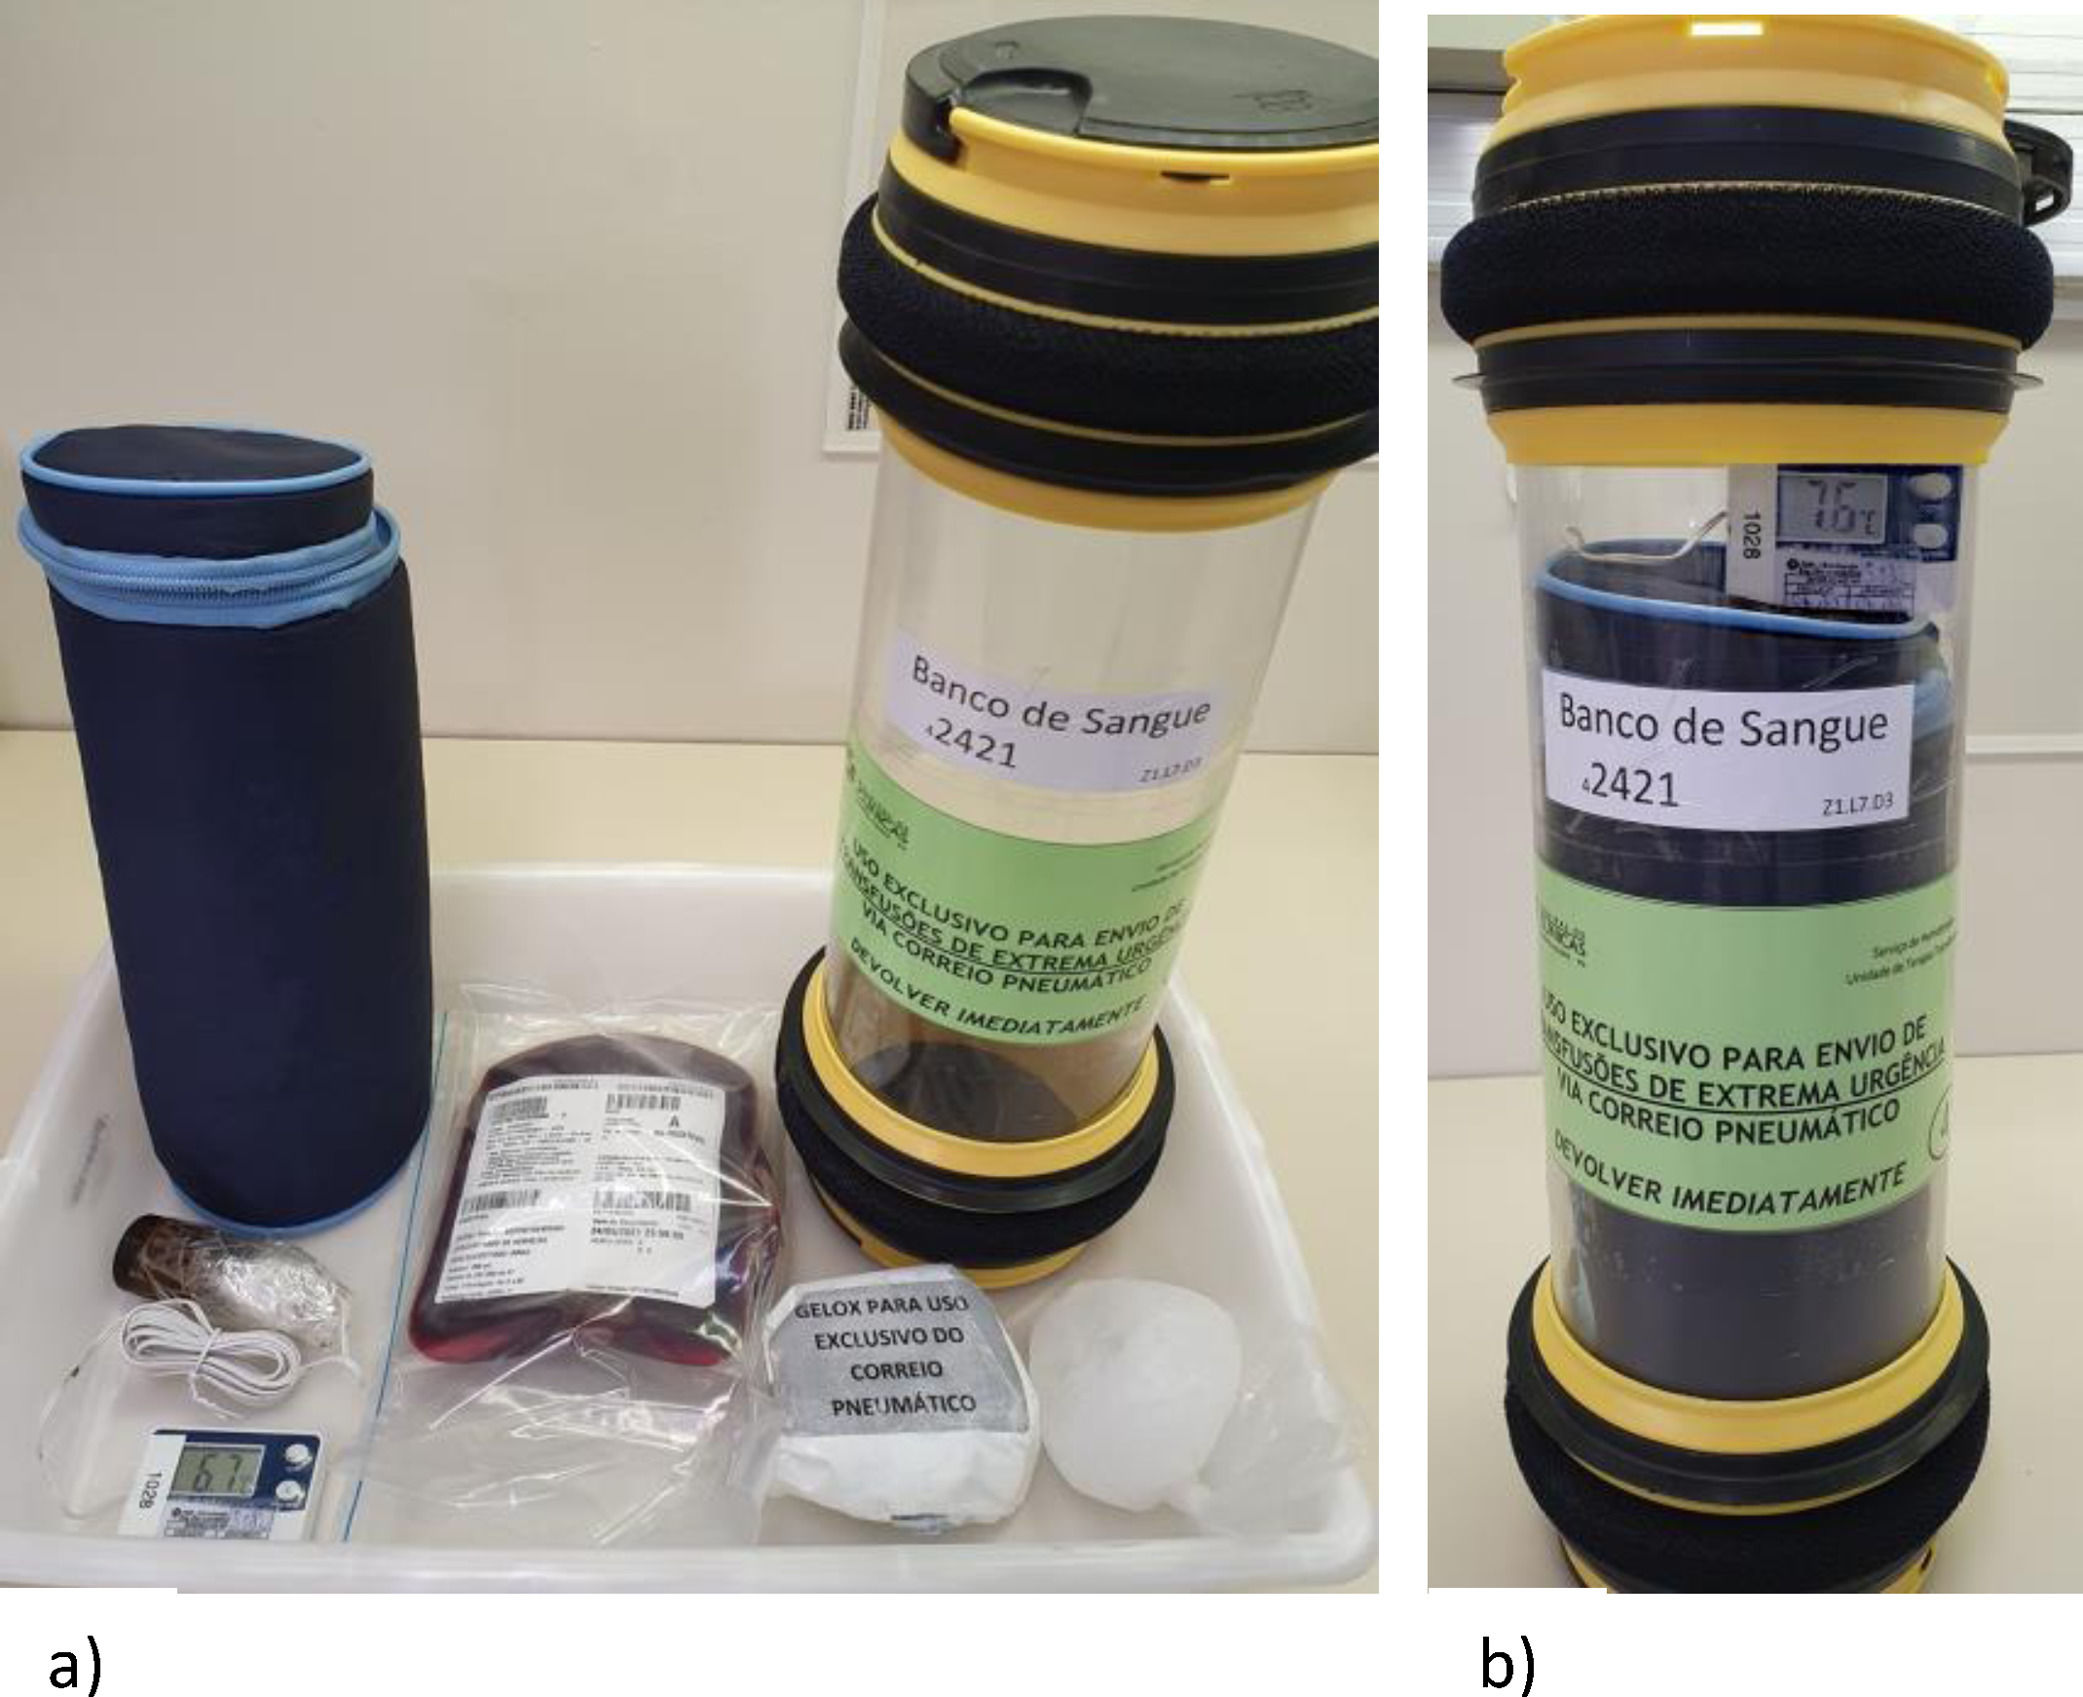
Transport via pneumatic tube system and courierThe units transported via PTS were inserted in the transport capsule in a padded wrap to prevent the units from moving during the journey and with reusable ice units, to keep the blood component at the appropriate temperature (Figure 1). The capsule temperature was monitored by a temperature data logger and a digital hygro-thermometer. The speed set for transportation was 6 m/s. Blood components were placed inside sealed zip lock plastic bags to prevent leakage and contamination of the capsule and tube system, in case any unit was broken during transport.
 Items used in the assembly of the transport capsule for refrigerated blood components: transport capsule, thermal bag, hygro-thermometer, two reusable ice packs and the blood component inserted in a zip lock plastic bag. Two reusable ice packs are inserted into the thermal bag, one at each end of the bag and then the plastic bag with the blood component is placed together with the hygro-thermometer (display positioned outside of the thermal bag). The thermal bag is closed and inserted into the transport capsule. b) Transport capsule ready for pneumatic tube system dispatch.")
Pneumatic tube system preparation. a) Items used in the assembly of the transport capsule for refrigerated blood components: transport capsule, thermal bag, hygro-thermometer, two reusable ice packs and the blood component inserted in a zip lock plastic bag. Two reusable ice packs are inserted into the thermal bag, one at each end of the bag and then the plastic bag with the blood component is placed together with the hygro-thermometer (display positioned outside of the thermal bag). The thermal bag is closed and inserted into the transport capsule. b) Transport capsule ready for pneumatic tube system dispatch.
The units transported by courier were packed in a transport carrier according to legal criteria and temperature was monitored by a temperature data logger.
The visual aspect of the blood components in both transport routes was assessed at three moments: pre-transport, arrival at the surgical ward and upon return to the blood bank. To monitor the transport time of each route (PTS and courier), the transport time was set from the moment the courier left the blood bank until his or her arrival at the destination, while the PTS, from the the moment shipping system was activated until the capsule arrived at the destination station. In all stages of the process, there were team members oriented so that the validation was conducted as planned.
Statistical analysisContinuous variables were presented as mean and standard deviation or median and interquartile range or minimum and maximum, according to the assessment of their distribution by the Shapiro-Wilk test. Categorical variables were described as absolute and relative frequency. The difference in the means of independent variables was measured using the Student's t-test or the Mann-Whitney U test, according to the distribution of the variable. For the difference between proportions, the Fisher's exact test was used. The threshold of statistical significance considered was p < 0.05. The sample N was of convenience, considering the availability of the blood component on the days tested.
ResultsThe blood components selected for each transport route had similar characteristics in terms of storage time, volume and, in the case of RBCs, the specification of irradiated, filtrate or low volume unit. It was possible to verify that the transport time by pneumatic tube was significantly shorter than the transport time by courier (Table 1).
General parameters of the blood component and transport.
| Parameter | Blood component | PTS (n)a | CRR (n)a | p-value |
|---|---|---|---|---|
| Storage Daysa | RBC | 11 (7 - 19) | 9 (7 - 21) | 0.885 |
| FP | 10 (6.5 – 14.5) | 10 (7.5 – 14.5) | 0.884 | |
| CR | 21 (18 - 47) | 21 (18 - 44) | 0.806 | |
| PC/PTP | 3 (3 - 4) | 3 (3 - 4) | 0.114 | |
| Volumea | RBC | 266 (242 - 298) | 267 (230 - 282) | 0.751 |
| FP | 191 (174.5 - 209) | 190 (174.5 – 212.5) | 0.712 | |
| CR | 32 (31 - 35) | 32.5 (31 – 34.5) | 1.0 | |
| PC | 53 (51.25 – 56.25) | 50,50 (48.50 – 51.75) | 0.114 | |
| PTP | 131b | 126b | - | |
| Irradiatedb | RBC | 8 (42.1%) | 8 (42.1%) | - |
| Leukoreducedb | RBC | 8 (42.1%) | 8 (42.1%) | - |
| LVUb | RBC | 1 (5.3%) | 1 (5.3%) | - |
| Transport Time (min)a | RBC | 3 (2 - 4) | 13 (13 - 14) | < 0.001 |
| FP | 3 (2-3) | 14 (13-15) | < 0.001 | |
| CR | 2c | 13 (10-27) | < 0.001 | |
| PC/PTP | 2d | 20e | 0.029 |
RBC: packed red blood cells. FP: fresh plasma. CR: cryoprecipitate. PC: platelet concentrate. PTP: plateletpheresis. LVU: low volume unit. PTS: pneumatic tube system. CRR: courier.
Seven RBC shipments were made, 4 of which were sent via PTS and three via courier on 3 different days, totaling 23 units of RBCs evaluated. Of these 23, 9 were sent by PTS and 14 by courier. The transport of the RBCs was performed both in the morning and in the afternoon, at an interval between 10:52 a.m. and 4:25 p.m., that covered the highest temperature time of the PTS.
In evaluating hemolysis parameters, such as Hb, K, AST, LDH, hemolysis index, and free Hb, there was no significant difference between the pre- and post-transport values in both transport routes. The potassium values of transport via pneumatic tube showed a greater variation in the values before and after transport, but it was still not statistically significant (Table 2).
Packed red blood cell validation parameters.
| Parameter | PTSa | CRRa | p-value |
|---|---|---|---|
| Temperature variation (°C) | 8.3 (5.3 – 10.7) | 4.1 (1.5 – 8.5) | 0,085 |
| Ht variation | 0.6 (-1.05 – 0.95) | 0 (-0.8 – 0.6) | 0.336 |
| Hb variation | 0 (-0.15 – 0.2) | -0.1 (-0.03 – 0.1) | 0.369 |
| Supernatant Potassium variation | 1.6 (0.1 – 2.45) | 0.1 (-1.85 – 2.25) | 0.345 |
| AST variation | 2 (1 – 7.5) | 3 (1 – 7.5) | 0.796 |
| LDH variation | 58 (17.5 – 149.5) | 108 (29.75 - 157) | 0.666 |
| Variation in Hemolysis Index | 37 (5.5 – 73.5) | 51 (27 – 132.5) | 0.554 |
| Variation of Visual Hemolysis | 169 (80.5 – 415.75) | 142.5 (81.5 - 321) | 0.412 |
| Free Hb variation | 0.03 (0.005 – 0.0925) | 0.01 (0 – 0.1) | 0.114 |
PTS: pneumatic tube system. CRR: courier. Hb: hemoglobin. Ht: hematocrit. AST: aspartate aminotransferase. LDH: lactic dehydrogenase. N sample: 9 PTS and 14 CRR.
Fifteen dispatches of fresh thawed plasma were performed, 10 of which were via PTS and five via courier on 5 different days, totaling 50 units of FP evaluated. The FPs were transported in the morning and afternoon shifts at an interval between 11:26 a.m. and 4:08 p.m., which covered the time when the temperature is highest in the pneumatic tube pipe.
The number of test days for FP was greater than the other blood components due to varied attempts to define the most adequate way to maintain the temperature inside the capsule.
The temperature varied more during transport by courier, when compared to the pneumatic tube, but it was not statistically significant. The evaluated clotting factors showed similar values in the pre- and post-transport, both by courier and pneumatic tube (Table 3).
Validation parameters of thawed fresh plasma.
| Parameter | PTSa | CRRa | p-value |
|---|---|---|---|
| Temperature variation (°C) | 0 (-0.5 - 7) | 2.9 (0.775 – 4.725) | 0.44 |
| PT variation (s) | 0.15 (-0.1 – 0.3) | 0.1 (-0.1 – 0.275) | 0.802 |
| APTT variation (s) | 0.15 (-0.1 – 0.575) | 0.25 (-0.15 – 0.5) | 0.451 |
| FVIII variation (%) | -4 (-7 - 1) | -2 (-7.5 - 1) | 0.629 |
PTS: pneumatic tube system. CRR: courier. PT: prothrombin time. APTT: activated partial thromboplastin time. °C: Celsius. S: seconds. FVIII: Factor VIII.
Seven CR shipments were made, 4 of which were sent via pneumatic tube and three via messenger on 3 days, totaling 30 units evaluated. The CRs were transported in the morning and afternoon, at an interval between 11:35 a.m. and 3:28 p.m., which covered the time when the temperature is highest in the pneumatic tube pipe.
There were no significant differences in the results of fibrinogen level before and after transport in both transport routes and the temperature remained stable throughout shipment (Table 4).
Platelet Concentrates (PC)Three PC shipments were made, 2 of which were sent via pneumatic tube and one via courier in 1 day, totaling 10 PC units evaluated. The PCs were transported during the morning shift, at an interval between 11:08 and 11:17 a.m. Only one day of platelet concentrate validation was performed due to the stock limitations for this blood component.
The temperature variation before and after transport via pneumatic tube was not significant. The only parameter evaluated in the PCs that showed a significant difference between pre- and post-transport was the PO2 by the courier. The values after transport were higher than those before transport (p = 0.032) (Table 5).
Platelet concentrate validation parameters.
| Parameter | PTSa | CRRa | p-value |
|---|---|---|---|
| Temperature variation (°C) | -0.6 (-0.6 - -0.05) | 0 | 0.151 |
| Platelet Count variation (x 103/mcL) | 8 (-5.5 - 40) | 1 (-14 - 34) | 0.841 |
| MPV variation (fL) | 0 (-1 – 0.05) | 0 (-1 - 0) | 0.841 |
| pH variation | 0.015 (0.003 – 0.025) | -0.009 (-0.0005 – 0.018) | 0.69 |
| PCO2 variation | -1.4 (-4.35 - -0.35) | -0.8 (-2.6 - -0.05) | 0.421 |
| HCO3 variation | -0.2 (-0.35 – 0.05) | -0.1 (-0.35 – 0.1) | 0.69 |
| PO2 variation | 1 (-5.6 – 9.5) | 17 (8.95 – 24.55) | 0.032 |
PTS: pneumatic tube system. CRR: courier. °C: Celsius. MPV: mean platelet volume.
The quality control parameters of all blood components evaluated after transport by pneumatic tube in this study met the recommended regulatory requirements, except for an RBC arrival temperature record that reached a temperature of 10.7°C (Table 6).
Post-transport parameters of PTS and CRR route group, compared to regulatory requirements.
| Blood component | Parameter | Distribution | Recommendation | |
|---|---|---|---|---|
| PTSa | CRRa | |||
| Packed red blood cellsb | Arrival Temperature Range (°C) | 5.3 – 10.7 | 1.5 – 8.5 | 1 - 10 °C |
| Hemoglobin | 52.43 – 75.69 | 45.54 – 77.0 | > 45 g/un | |
| Hematocrit | 70 – 84.3% | 66.6 – 87.9% | 65 - 80% | |
| Hemolysis Level | 0.06 – 0.32% | 0.07 – 0.50% | < 0.8% of the erythrocyte mass | |
| Thawed fresh plasma a | Arrival Temperature Range (°C) | 3.9 – 9.4b | 3.9 – 9.4b | 1-10 °C |
| PT (s) | 13.1 (12.9 – 13.275) | 13.1 (12.9 – 13.275) | < 15.6 sc | |
| APTT (s) | 35.1 (33.9 – 37.65) | 35.1 (33.9 – 37.65) | < 40.8 s | |
| FVIII | 0.91 (0.81 – 1.02) | 0.94 (0.70 – 1.07) | ≥ 0.7 UI/mL | |
| Cryoprecipitateb | Arrival Temperature Range (°C) | 20.8 – 22.1 | 18.3 – 23.5 | 20 - 24 °C |
| Fibrinogen/unit | 243.60 – 464.19 | 279.93 - 727.65 | > 150 mg/unit | |
| Platelet concentrateb | Arrival Temperature Range (°C) | 21.4 – 22.6 | 22,1 | 20 - 24 °C |
| pH | 6.896 – 7.349 | 7.009 – 7.349 | > 6.4 | |
°C: Celsius. S: seconds.
Previous studies on RBC validation via pneumatic tube used the HemoCue Plasma/Low Hb® equipment to assess hemolysis. Other parameters were also reported, such as potassium, AST and LDH.1,2,8,9 Regarding the PC validation, reported tests were the platelet count, MPV, pH, PO2, PCO2 and HCO3. For the validation of the FP, the performances of the PT and APTT are essential.9
As expected, the transport time was significantly shorter for the PTS, compared to the courier. The laboratory parameters evaluated, especially the hemolysis indicators, which is a critical factor in assessing the quality of red blood cells, did not change with the transport via pneumatic tube. The range of hemolysis in the RBCs after transport via the PTS was 0.06 - 0.32%, in accordance with the current regulatory requirements, in which the hemolysis is expected to be under 0.8% of the erythrocyte mass.10 A study carried out in Japan in 2019 evaluated the consecutive shipments of RBCs by pneumatic tube and found that after the third consecutive shipment, the RBCs showed hemolysis markers, such as AST and LDH slightly higher, but without statistical significance.8
It is known that irradiation increases the concentration of extracellular potassium; for this reason, some irradiated units were included in the validation of the RBCs, which did not show an increase in the hemolysis rate after transport by pneumatic tube. A validation carried out in India in 2015 using some irradiated RBCs also found no increase in hemolysis in these units after transport by pneumatic tube.2
It was possible to observe that the arrival temperature range of the RBCs was 5.3 to 10.7°C, exceeding the limit required by the legislation of 10°C. Due to the validation steps, that included collecting and aliquoting a large number of samples for quality control exams and identification tubes and records, the RBC units remained for a longer period than usual on the bench and, inevitably, the temperature rose during the sampling process. In an attempt to maintain the temperature of the RBCs within the required interval, the RBCs were placed in the refrigerator at 4°C for a few min before being sent in the transport capsule, but still the temperature did not recover completely.
After validation, the transport temperature of the RBCs will be assessed during real-life urgent transfusions. In these events, the bags are removed from the refrigerator at 4°C, registered in the blood bank data system and sent to the patient immediately. The average time for this delivery, performed by the blood bank team trained at our service, is 5 min. In this manner, we intend to reduce the manipulation on the bench and maintain the transport temperature of the RBCs within the legal standard.
In evaluating the results of the FP, the parameters evaluated (PT, APTT and Factor VIII) were not compromised by the transport via pneumatic tube. In agreement with the present study, in India in 2016, the authors did not observe the prolongation of the PT and APTT in units transported by pneumatic tube.9.
One of the possible reasons the transport by the PTS expectedly does not significantly impact plasma units is that this blood component is an acellular plasma-protein solution which is not affected by the action of the mechanical forces of the pneumatic tube system.1
The fibrinogen evaluated in the CR units did not change after the transport via pneumatic tube. No recent pneumatic tube validation studies for CR transport were found; only one study in 1987 in the United States did not observe any change in factor VIII after the cryoprecipitate transport via the pneumatic tube system.11
Regarding the tests evaluated in the PC and plateletpheresis units, such as platelet count, MPV and metabolic activity and parameters, such as pH, PCO2 and HCO3, there was no clinically significant variation between the pre- and post-transport results either via courier or pneumatic tube system.
The PO2 parameter of this study showed a significant variation between the two transport routes, with higher values in the post-transport of the units transported by courier. A study carried out in 2015 that discussed the transport of blood samples via pneumatic tube for gas assessment concluded that this transport route does not affect the pH and PCO2 values. However, it can generate erroneous results in the PO2, which, according to the authors, may be due to air bubbles in the syringe.12
In 2012, a study evaluated the platelet count, platelet function and metabolic markers after single or multiple transports via pneumatic tube and the results showed that the platelet counts and metabolic markers remained stable after this transport route, whether in single or multiple deliveries. Only one platelet aggregation parameter was affected after multiple transports.13 A study published in 2016 in India also found no significant change in platelet count and metabolic parameters pH, PO2, PCO2 and HCO3.9
In Japan in 2019, a study was also performed, evaluating platelet count, platelet function and metabolic markers of platelet concentrate transported via pneumatic tube, with some units being transported three times. Even these units did not show changes in the parameters evaluated, such as platelet count, MPV, pH, and PCO2, among others.8
A study evaluating platelet activation and aggregation of plateletpheresis units transported by pneumatic tube, developed in the United States, found that this transport did not alter platelet hemostasis.4
An issue involving a temperature in the validation tests was the choice of the thermometer. There are several models of thermometers that can be used, either those based on contact or those that monitor the temperature, such as infrared and temperature-sensitive readers. The latter may be more sensitive to temperature variation during rapid handling, but have the advantage of monitoring the temperature at 1-minute intervals, instead of doing a single check.
Regarding the integrity and visual inspection of the units transported by pneumatic tube, there was no leakage or change in the appearance of the evaluated blood components.
Some limitations should be considered while evaluating our findings. Convenience sampling and lack of sample size estimation (mostly due to scarce data in the literature from which to extract variables for a formal calculation) may have influenced the statistically non-significant comparisons performed. Notwithstanding, validation processes reported previously have gathered similar amounts of samples. Furthermore, most central tendency values for parameters evaluated between groups were roughly similar, thus any statistically significant difference, not identified because of a beta error, may not have been of a relevant magnitude.
Before the implementation of the transport of blood components via pneumatic tube to assist transfusions of extreme urgency, realistic simulations were carried out to train the team and identify potential improvements in the process, such as choosing the location of the materials used in the service (thermal bags, reusable ice, hygro-thermometer, transport form and protocol with the registration of departure times, temperatures and receipt of the blood component). In addition to providing training for the new routine, the simulations were useful to increase the confidence and engagement of the team because, in real-life critical situations, such as patients in hemorrhagic shock, the team alignment and agility are fundamental to guarantee a fast service and the transfusion safety of the patient.
Our findings indicate that the use of a pneumatic system for blood component transport is a fast and feasible alternative for high complexity healthcare centers. Further studies in different institutions are necessary to certify the adequate performance in diverse settings.
ConclusionIn general, there was no significant increase in the temperature inside the pneumatic tube capsule, even with the heat related to the season, movement and friction. There was also no change in the quality control parameters of the blood components evaluated after transportation by pneumatic tube, making this route of transport fast, safe and reliable for the transportation of blood components.
The authors would like to thank the Laboratory Diagnostic Service of the Hospital de Clínicas de Porto Alegre, Engineering Sector, Mechanical Section, for their support and the collaborators of the Hemotherapy Service at the same Hospital, who helped directly or indirectly in the process.


