
Time series studies related to blood donor candidates and blood donations are rare in Brazil. Population aging suggests a better understanding of the context related to blood donor candidates and blood donations performed.
ObjectiveThe monthly series of candidates eligible to donate blood and actual donations between 2005 and 2019 at the Hemominas Foundation, Minas Gerais, Brazil, were described and analyzed.
MethodsTen time series were constructed of blood donor candidates and blood donations. Each series covered the period from January 2005 to December 2019. The stationarity of the series was verified by the unit root test; the data distribution, by the Shapiro-Wilk test; the trend, by the Cox-Stuart test, and; the seasonality, by the Fisher's test (significance levels of 10% for the first test and 5% for the last three).
ResultsAll series were identified as non-stationary and presented trend and seasonality components. The rate of blood donor candidates and the rate of blood donations performed evidenced a positive upward trend until the last two-year analysis, when a drop occurred, from 1.75% and 1.42% in 2017 to 1.64% and 1.35% in 2019, respectively. The rate of blood donations trended downward, from 0.054% in 2005 to 0.046% in 2019. The proportion of unsuitable or unretained candidates reduced.
ConclusionThe study emphasized the need to stimulate blood donation by specific groups and increase ways to reduce the demand for blood components through the implementation of programs that expand alternatives to blood transfusions.
Hemotherapy is widely used in Brazil and worldwide.1 Approximately 5 million people are candidates for blood donations and approximately 3.7 million blood donations are performed annually in Brazil.2–5
The annual growth in demand for blood components in Brazil is greater than the growth in the blood supply, which are approximately 1% and 0.7%, respectively.1 Despite the increase in the number of candidates for blood donation and actual blood donations performed in Brazil, the ratio of the general Brazilian population who donate blood decreased from 1.8% in 2008 to 1.7% in 2016. Considering only the population eligible for donation by the age criterion, the rate of blood donations decreased from 0.9% in 2008 to 0.7% in 2016.2–4
Reductions in blood donation rates worldwide are associated with the aging population.6,7 However, few studies in Brazil have analyzed time series related to blood donor candidates and blood donations.7 Furthermore, the studies conducted have not considered the population eligible for donation, which is restricted by the age, among other factors, such as weight and sexual behavior, or the difference between men and women in the minimum interval between donations.
Hence, the objective of this study was to describe the components of the time series (trend, seasonality and randomness) of blood donation candidate rates and blood donation rates conducted between January 2005 and December 2019 by the Hemominas Foundation, which accounts for more than 91% of blood donations performed in the entire State of Minas Gerais (MG).8
A new approach to data analysis was developed by defining a new dependent variable to achieve the objectives of the present study. This new approach involved the creation of a blood donation rate, which was adjusted according to the potential number of donations that could be performed during the year from the population able to donate, according to the age and sex criteria.
MethodsA retrospective longitudinal study was conducted, referring to the period from 2005 to 2019, using data from the Hemominas Foundation, organized and compiled in the annual production reports. The data on the population of MG were obtained through the Department of Informatics of the Unified Health System of Brazil (DATA/SUS),9 from health information (demographic and socioeconomic tabs), demographic censuses and population estimates of the Brazilian Institute of Geography and Statistics (IBGE) sent to the Federal Audit Court (TCU).10
Series formationSeven time series were constructed with monthly data on the number of candidates for blood donation and three time series, with data on the number of blood donations, as presented in Table 1.
Formation of the time series of blood donor candidates and blood donations performed between 2005 and 2019, Minas Gerais, Brazil.
Source of information: Annual reports of the Hemominas Foundation.
The rate of blood donor candidates was obtained by analyzing the ratio between the number of blood donor candidates and the total population of the state for the same month. The total population for each month analyzed was obtained by the projections of IBGE for each respective year on July 1. Similarly, the rate of blood donations performed (number of blood samples taken/total population) was found.
The adjusted rate of blood donations performed was obtained by the ratio between the number of donations performed and the total population eligible for donation, according to the following expression:

In which,
d: is the number of donations performed in the month;
P: is the population eligible to donate by the minimum and maximum age criterion, which was 18 to 65 years old, from 2005 to 2010; 18 to 67 years old, from 2011 to 2012, and; 16 to 69 years old, from 2013 to 2019.
The population (P) was obtained by the sum of pf and pm, which are, respectively, the female and male populations eligible to donate due to the age criterion.
To estimate pm and pf, the difference in the frequency distribution of donations by gender in Brazil was considered, in which approximately 60% of blood donations in Brazil are from men and 40% from women.2–4 The proportion of blood donations performed by men at the Hemominas Foundation was 55.5% in 2018 and 53.8% in 2019 (mean of 54.6% for the two years). The mean found for those two years was applied to obtain the pf and pm, as the Hemominas Foundation only divulged information about donor gender in 2018 and 2019.
In addition, the estimation of pf and pm considered the necessary period between donations for the men and women, which is three months for men and four months for women. Thus, to calculate pf, the number of blood donations performed in the three months prior to the month considered was subtracted from the female population. For men, the number of blood donations performed in the two months prior to the month considered was subtracted from the male population.
Therefore, pf and pm were obtained separately:


In which,
dt is the number of blood donations performed in month t;
t is the month analyzed;
pf(t) is the female population in the month analyzed;
pm(t) is the male population in the month analyzed.
The first three observations in the series of the actual blood donation rates, adjusted by the population eligible to donate by the age criterion, were excluded because no data on the candidates and donations are available for the year 2004. Thus, this series had 177 observations. The other series were formed by 180 observations, as shown in Table 1.
Statistical analysisThe statistical analysis was performed according to the classic model for time series,11 in which a series can be described as the sum or multiplication of the components of a trend, seasonality, and randomness. This study employed the following additive model with normal distribution:

In which
Zt is the temporal observation of t;
Tt is the trend component;
St is the seasonality component;
at is the random component.
The analysis of time series can identify the behavior of the series and their components, as well as make projections for better decision-making.11
The KPSS (Kwiatkowski-Phillips-Schmidt-Shin) unit root test was performed to determine whether the series exhibited stationarity or not (the stationarity hypothesis is rejected if the p-value < 0.1).12 In case of non-stationarity of the series, first order differentiation was performed and then, the second unit root test was performed to verify the stationarity of the differentiated series.
The Cox-Stuart test was employed to identify the presence or absence of the trend component, and the Fisher test used to identify the presence or absence of the seasonality component.
The KPSS unit root test, the Cox-Stuart test and the Fisher test were applied to the original data of all series, without taking the first order differentiation from the original data. The stationarity of the series was verified by the unit root test, the normality of the data distribution of the series was verified by the Shapiro-Wilk test, the trend, by the Cox-Stuart test and the seasonality, by the Fisher test (significance levels 10% for the first test and 5% for the last three).
To verify the assumption on the absence of correlation and partial correlation between successive residues, the graphs of the autocorrelation and partial autocorrelation functions of the residues with 48 lags were presented after the first order differentiation process of each series, with a confidence interval of 95%. Orders of moving averages that decay quickly to points on the graph, where the autocorrelations quickly become essentially zero, indicate short memory for the terms. The existence of significant terms above the confidence interval with similar frequency would indicate the existence of the seasonal component in each series.
The statistical program R version 3.5.3 was employed for statistical analyses and production of graphs. To conduct the tests, the “urca”, “LSTS”, “stats” and “aTSA” packages were required.
Data donation was authorized through the research project approved by the Research Ethics Committee of the Hemominas Foundation, under opinion number 4,104,831.
ResultsThe annual descriptive analysis of the data found growth in the number of blood donor candidates, as well as the number of blood donations conducted over the series up to 2016, then a drop in the last two years, were analyzed. In addition, the decrease in the percentage of blood donor candidates and the percentage of blood donations was pronounced in the last two years of the series, from 1.75% and 1.42% in 2017 to 1.64% and 1.35% in 2019, respectively. The adjusted blood donation rate fell steadily from 0.054% in 2005 to 0.046% in 2019, as presented in Table 2.
Population, total blood donor candidates, blood donations made, percentage of candidates able to donate and percentage of donations made between 2005 and 2019 in Minas Gerais, Brazil.
| Year | *Total population | ⁎⁎Blood donor candidates | % Blood donor candidates | ⁎⁎Blood donations performed | % Blood donations performed | ⁎⁎⁎% Blood donation performed adjusted by population eligible to donate |
|---|---|---|---|---|---|---|
| 2005 | 19,237,434 | 331,115 | 1.72 | 254,296 | 1.32 | 0.054 |
| 2006 | 19,479,262 | 340,321 | 1.75 | 258,301 | 1.33 | 0.053 |
| 2007 | 19,719,285 | 345,448 | 1.75 | 265,793 | 1.35 | 0.052 |
| 2008 | 19,850,072 | 347,982 | 1.75 | 267,497 | 1.35 | 0.051 |
| 2009 | 20,034,068 | 347,809 | 1.74 | 275,684 | 1.38 | 0.052 |
| 2010 | 19,597,330 | 345,713 | 1.76 | 275,705 | 1.41 | 0.052 |
| 2011 | 19,728,701 | 340,196 | 1.72 | 274,758 | 1.39 | 0.048 |
| 2012 | 19,855,332 | 335,942 | 1.69 | 274,046 | 1.38 | 0.047 |
| 2013 | 20,371,328 | 340,555 | 1.67 | 275,667 | 1.35 | 0.046 |
| 2014 | 20,508,631 | 354,699 | 1.73 | 282,717 | 1.38 | 0.047 |
| 2015 | 20,648,978 | 358,948 | 1.74 | 286,869 | 1.39 | 0.047 |
| 2016 | 20,780,264 | 362,243 | 1.74 | 291,522 | 1.40 | 0.047 |
| 2017 | 20,908,628 | 366,305 | 1.75 | 296,289 | 1.42 | 0.048 |
| 2018 | 21,040,662 | 354,957 | 1.69 | 290,425 | 1.38 | 0.046 |
| 2019 | 21,168,791 | 348,158 | 1.64 | 285,525 | 1.35 | 0.046 |
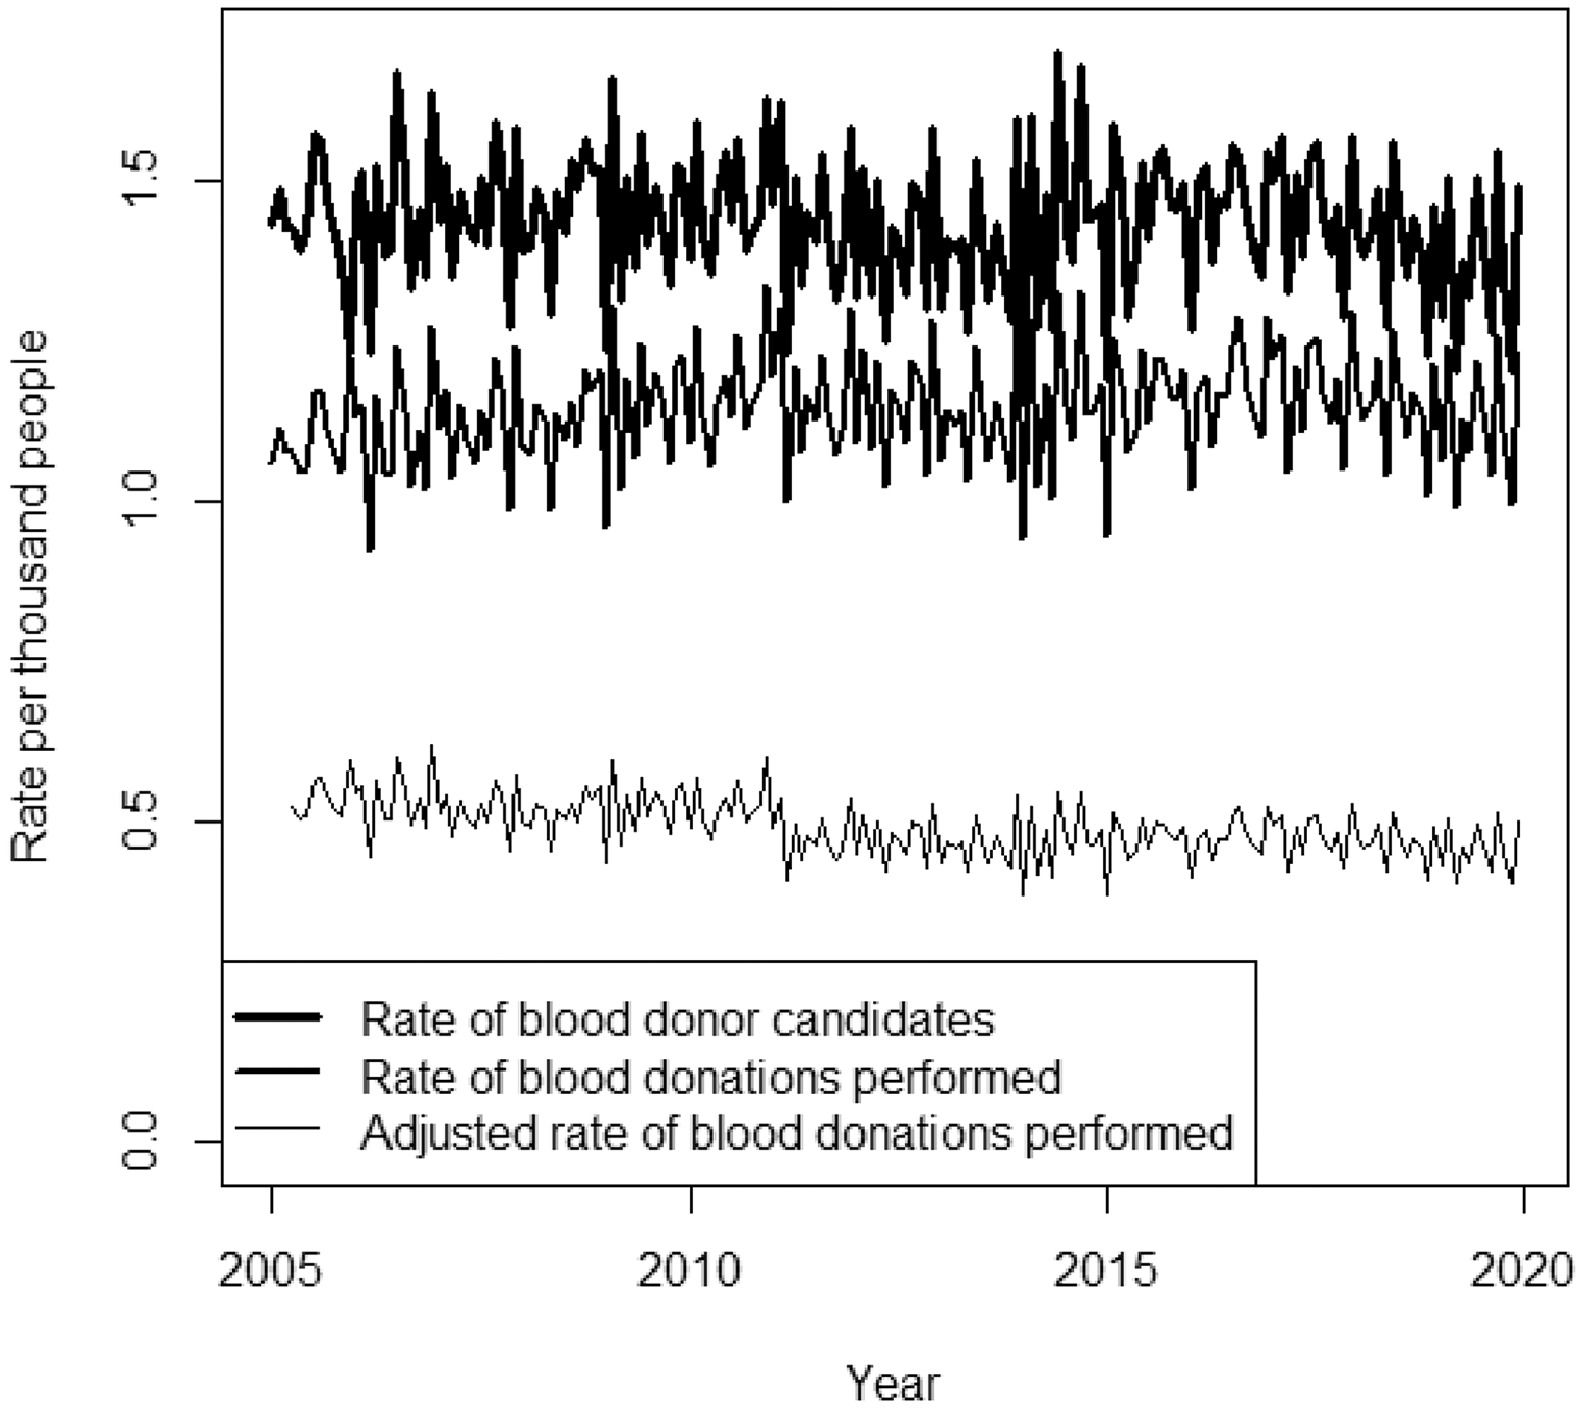
The monthly descriptive analysis of the data found that the monthly mean rates of blood donor candidates, rate of blood donations performed and adjusted rate of blood donations performed were 1.4 donations and the donations performed per thousand people per month were 1.1 and 0.5, respectively (Figure 1). An approximation was observed between the rate curves of candidates for blood donation and the rates of blood donations performed. Both curves exhibit a downward trend in the last two years. At the same time, the curve for the adjusted rate of blood donation presented a constant drop and greater distance from the blood donation rate curve performed at the end of the series.

All series were non-stationary (p-value < 0.1), with stationary periods, and all of them required a differentiation process for transformation into stationary series. The trend and seasonality components were present in all series. Only the series of unretained candidates who quit donating presented abnormal data distribution. In other words, according to the results obtained by the statistical tests, all series were influenced by trend and seasonality in their composition. The results of the stationarity tests, data normality, trend and seasonality are provided in Table 3.
Results of the tests of stationarity, normality and components of trend and seasonality for the 10 studied time series.
| Series | Unit Root Test (KPSS)* | Shapiro-Wilk Test⁎⁎ | Cox-Stuart Test⁎⁎⁎ | Fisher Test⁎⁎⁎⁎ | |
|---|---|---|---|---|---|
| Original Data | After order differentiation 1 | ||||
| Blood donor candidates | 0.047 | 0.1 | 0.565 | T =58 ≥ n – t = 35.70 | P < 0.001 |
| Rate of blood donor candidates | 0.080 | 0.1 | 0.546 | T = 52 ≥ n – t = 35.70 | P < 0.001 |
| Candidates able to donate blood | 0.043 | 0.1 | 0.486 | T = 69 ≥ n – t = 35.70 | P < 0.001 |
| Candidates unable to donate blood | 0.040 | 0.1 | 0.152 | T = 64 ≥ n – t = 35.70 | P < 0.001 |
| Unretained blood donor candidates | 0.010 | 0.1 | 0.001 | T = 85 ≥ n – t = 35.70 | P < 0.001 |
| Eventual blood donor candidates | 0.068 | 0.1 | 0.075 | T = 42 ≥ n – t = 35.70 | P < 0.001 |
| Blood donation by return candidates | 0.047 | 0.1 | 0.223 | T = 54 ≥ n – t = 35.70 | P < 0.001 |
| Blood donations performed | 0.053 | 0.1 | 0.256 | T = 69 ≥ n – t = 35.70 | P < 0.001 |
| Rate of blood donations performed | 0.040 | 0.1 | 0.688 | T = 42 ≥ n – t = 35.70 | P < 0.001 |
| Adjusted rate of blood donations performed | 0.040 | 0.1 | 0.843 | T = 72 ≥ n – t = 34.81 | P < 0.001 |
Seasonality present if p-value < 0.05.
The Unit Root test was applied to the original data and to the data after first order differentiation. The Shapiro-Wilk test, the Cox-Stuart test and the Fisher test were applied to the original data. The original data are those that did not go through a differentiation process.
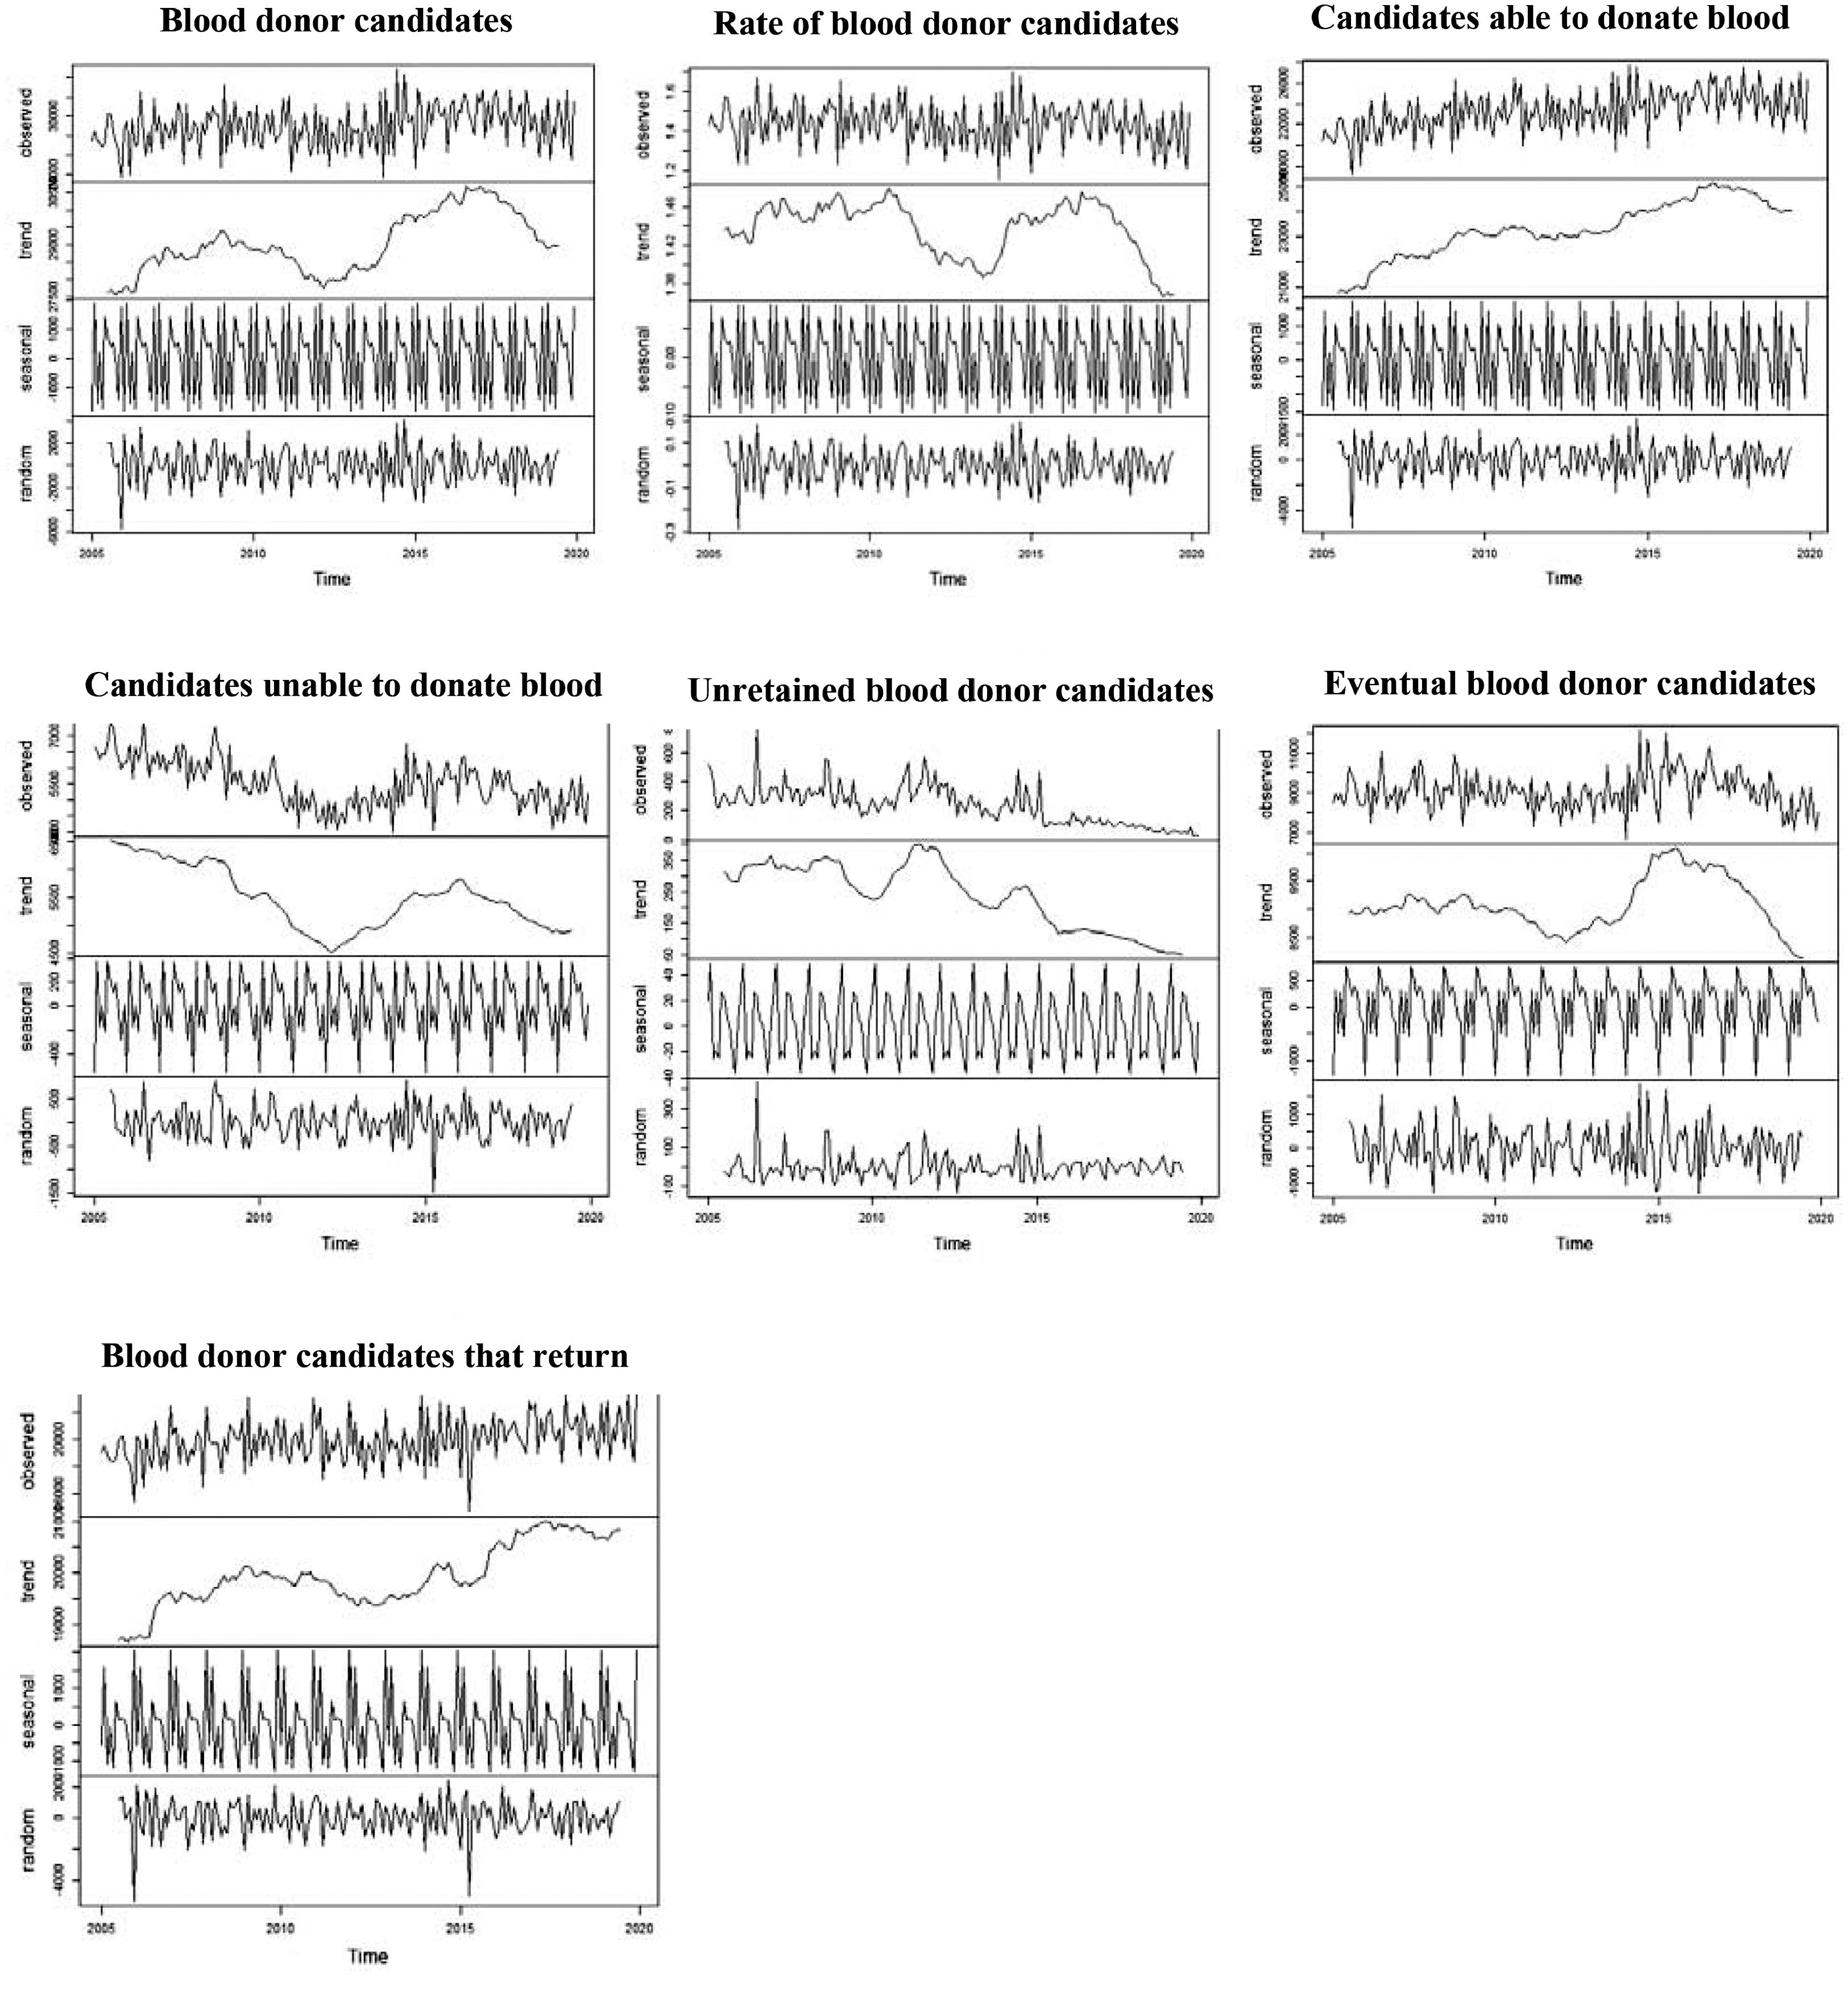
The seven series related to blood donor candidates, as well as the breakdown into their trend, seasonality and random components, are charted in Figure 2. The series of blood donor candidates, suitable candidates and retained candidates exhibited an upward trend. A downward trend was observed in the series of unsuitable candidates, unretained candidates and the rate of blood donor candidates. Furthermore, there was an abrupt downward trend, followed by a decrease in unretained candidates around the year 2012.

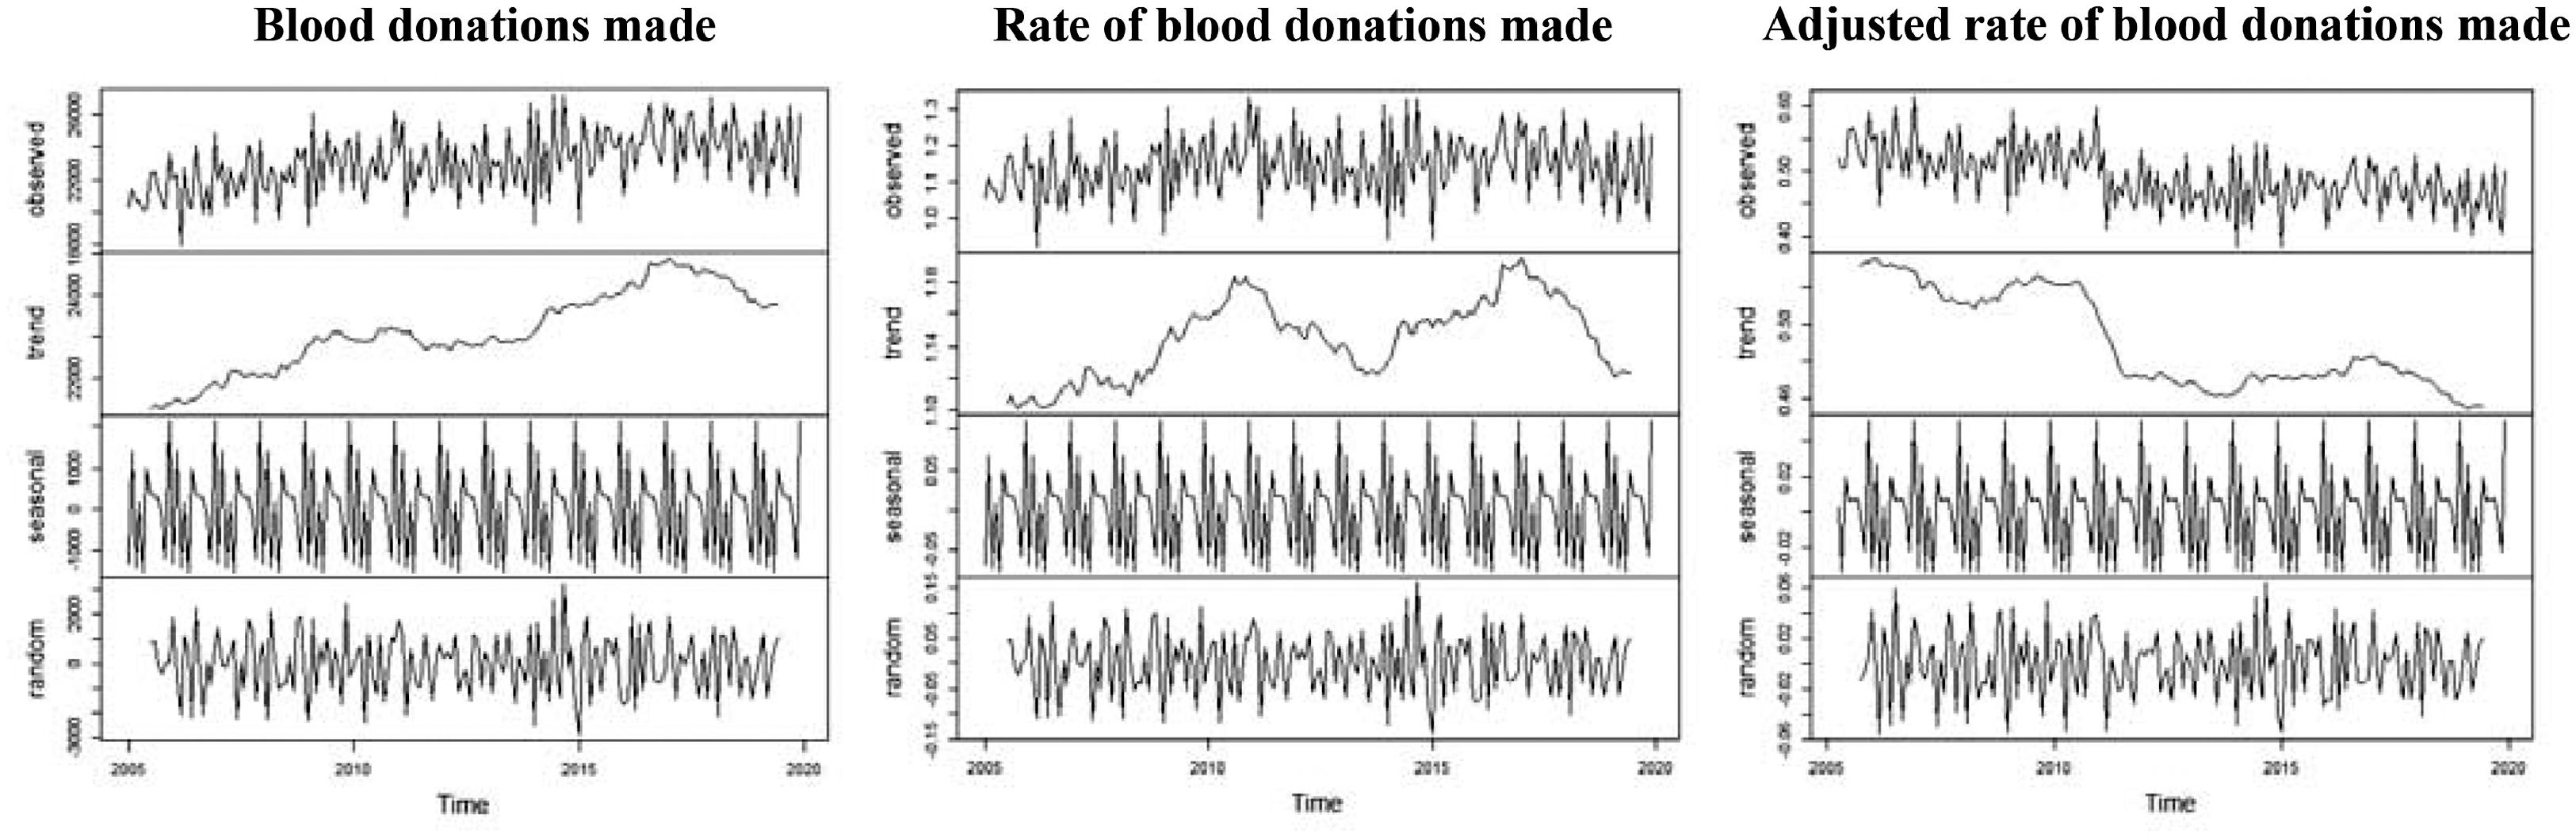
The three series related to the blood donations performed, as well as the decay in their trend, seasonality and random components, are presented in Figure 3. An upward trend was observed in the series of blood donations performed and rate of blood donations performed; however, both exhibited a drop in the final part of the series. There was also a constant downward trend in the adjusted blood donation rate series. Seasonality of 12 months was found, with a peak in December and low in January, March and May in the three series.

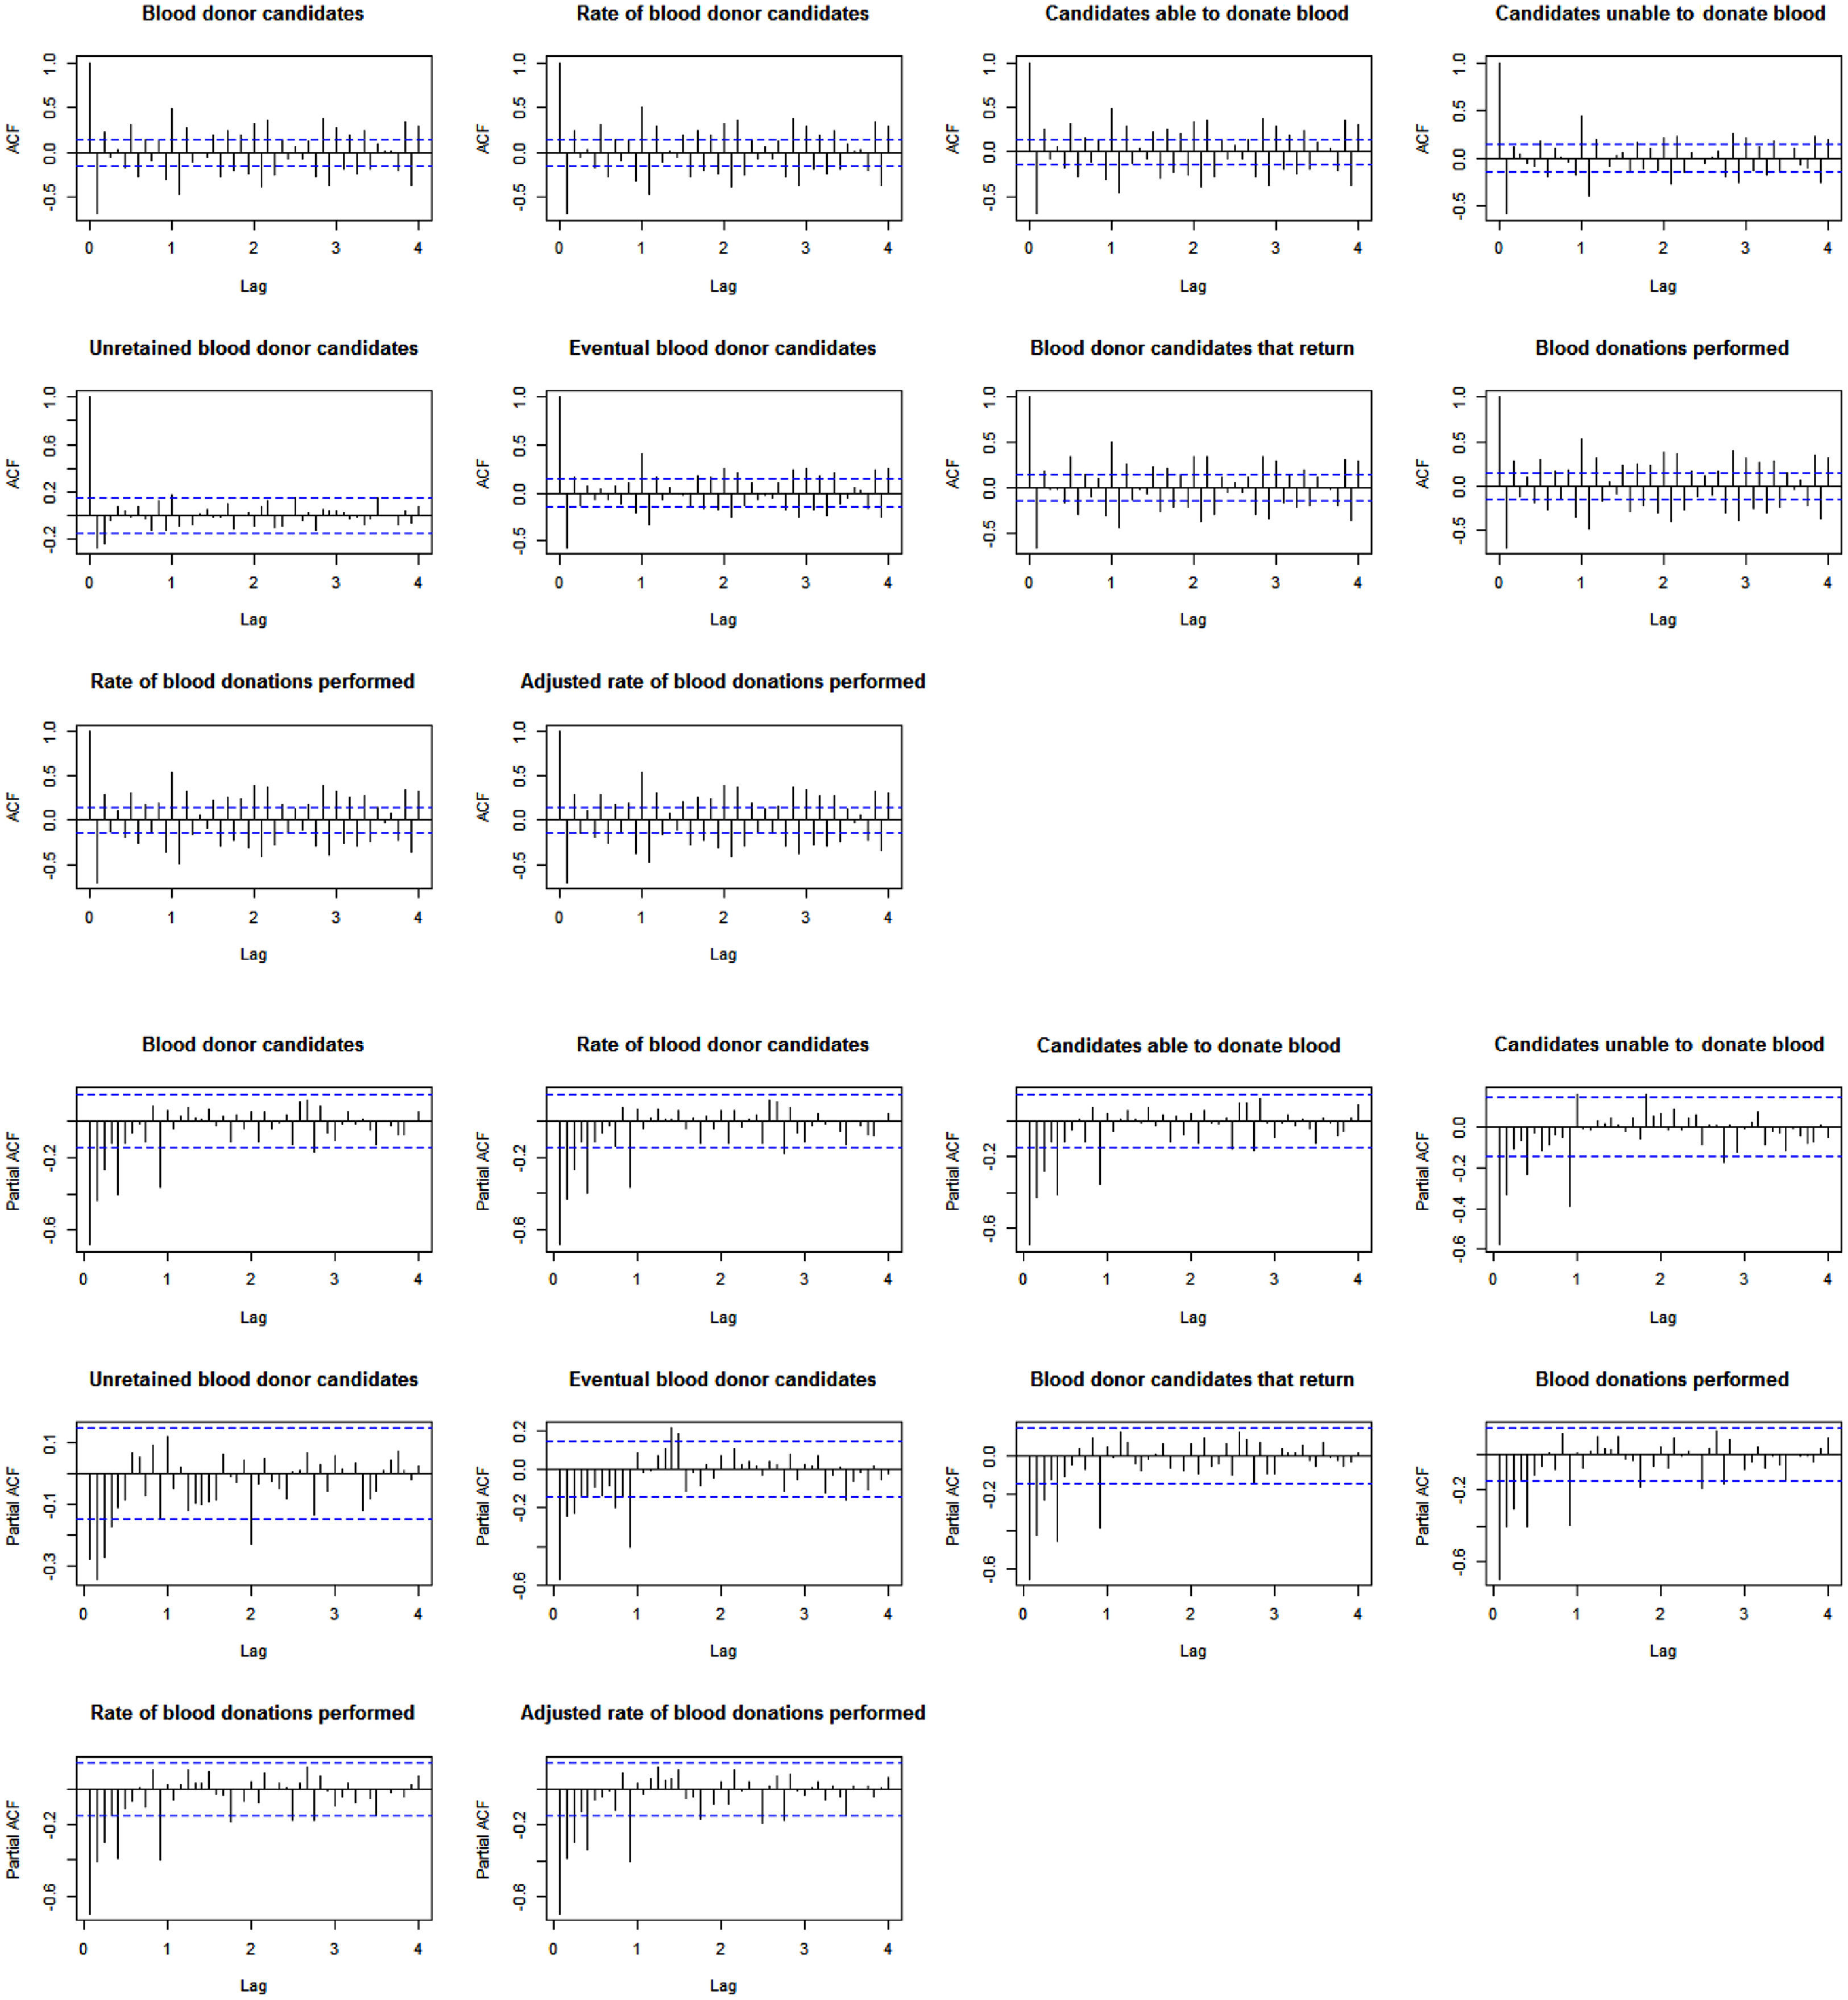
The autocorrelation and partial autocorrelation functions had a short memory for errors, with a low number of moving means and a low number of regressive orders, respectively, indicating seasonality. The graphs of autocorrelation and partial autocorrelation functions obtained by the time series are in Figure 4.
Discussion
The growth trend in the number of blood donor candidates and in the number of blood donations performed can be viewed as a positive reflection of the objectives and goals proposed by the Hemominas Foundation through its master plans.8
However, the rate of blood donations performed, adjusted by the population eligible to donate, tended to fall steadily; furthermore, the rate of candidates for blood donation and the rate of blood donations decreased in the last two years. The rates found in this study are similar to those found in Brazil, where the blood donation rate reduced from 1.8% in 2008 to 1.7% in 2016, considering the total population, and reduced from 0.9% in 2016 to 0.7%, considering the population eligible for donation, according to age criteria.2–4 The reduction in the rate of blood donations has also been observed in time series studied in countries more developed than Brazil, including Germany, Canada, USA, Finland, Holland and Switzerland.7
The existence of a statistically significant seasonal component found in this study contrasts with the study by Rocha (2006).13 In their analysis of four time series related to candidates for blood donation and blood donations, they did not observe a statistically significant seasonal component. On the other hand, the present study agrees with the findings by Oliveira et al. (2013),14 who found a seasonal component in the analyzed periods around holidays. That study used weekly and non-monthly series, similar to the present study.
The approximation between the rate curve for blood donor candidates and the rate curve for blood donations performed can be explained by the increased proportion of candidates eligible for blood donation during the analyzed period. Although this increase could be related to changes in the criteria for donation over the analyzed period, Silva et al. (2016)15 observed that only 0.06% of blood donations were performed by 16 and 17-year-olds.
Until 2010, only people 18 and 65 years old were allowed to donate. Between 2011 and 2012, the donation was allowed for people between 16 and 67 years old. Since 2013, people between 16 and 69 years old can donate. The proportion of the population eligible to donate was 75.1% in 2005, which increased to 83.3% in 2018. At the same time, the number of unsuitable and unretained candidates reduced from 23.7% and 1.2% in 2005 and to 16.4% and 0.3% in 2018, respectively.
Another plausible explanation for the increase in the proportion of eligible candidates for donation is the expansion of the capacity of the main facility and the introduction of other facilities, such as the one in Poços de Caldas in 2009.
Although June 14 and November 25 are world and Brazilian blood donor days, respectively, seasonal component analysis identified December as the month with the highest number of blood donations. The lowest numbers of blood samples occurred in January, March and May.
The abrupt drop observed in the series of blood donation rates, adjusted between 2010 and 2012, can be partly explained by the change in the minimum and maximum ages for donation, from 18 to 16 years and from 65 to 67 years, respectively. In 2013, another adjustment increased the maximum age for donation from 67 to 69.25 Furthermore, modifying the minimum donation age changed the rate of candidates for blood donation and the rate of blood donations performed more than the change in the maximum donation age. This is due to the greater number of young people than elderly in the population and that people 60 or over are only considered fit for donation if they have already had a history of donation before the age of 60.
No specific events have been identified that could explain the drop in the number of blood donor candidates around 2012. Outbreaks of diseases that prevent blood donation, such as dengue, Zika virus, H1N1 influenza and yellow fever, do not coincide with low donation periods. In Brazil, the dengue outbreak in 2012 was less than the outbreak in 2015. In parallel, the largest zika virus epidemic was observed in 2015/2016. Similarly, the H1N1 pandemic and the yellow fever epidemic in Brazil occurred in 2009 and 2016/2017, respectively. The greater magnitude of reduction in the number of blood donor candidates in 2012, in relation to the rest of the series, could be due to orientation and education campaigns on the conditions required for donation, since the number of unsuitable candidates also experienced the biggest reduction in 2012.
As for the characteristics of the candidates, the number of candidates who returned for blood donation at least twice in the period of one year (retained candidates) was higher in the whole series than the casual candidates, who donate blood only once within a year. In addition, the percentage of retained candidates increased between 2005 and 2018, from 67.6% to 70.5%.
The increase in retained blood donor candidates could also be a reflection of the aging population. In countries more developed than Brazil, older people donate more often in the same year than younger people.7,16
Although other factors can make blood donor candidates as unsuitable, the age and sex criteria are the only items that can be applied to filter all donor candidates. Adjusting the rate of blood donations by considering the population eligible for donation provided more accurate analysis of the behavior of blood donations over the period studied, as people ineligible due to age were removed from the denominator. In addition, the adjustment took into account the eligibility difference between sexes: men can donate up to four times a year, while women can donate up to three times. Considering the differences between the sexes in the analysis makes the results more reliable than using a simple ratio between the number of donations performed and the general population.
The aging population and the negative trend in blood donation rates performed, adjusted and unadjusted, reveal a public health problem. Cases of blood banks operating in critical condition are frequently reported in Brazil and Minas Gerais. Furthermore, the Brazilian Ministry of Health defines blood production and the use of blood components as expensive and onerous.17
The national policy on blood, its components and blood components, instituted in 2001 and redefined in 2016, includes in its principles assessment of the need for these items and establishment of mechanisms that guarantee the reserve of these items, in addition to stimulating scientific research and technology related to them.18,19 Based on these principles and blood donation rates in 2012 and 2013 (1.8%), in 2015 the Brazilian Ministry of Health set the goal for 2020 as 2.2% to 2.3%.20 The results found in this study for the years 2018 to 2019, with great representativeness in the state of Minas Gerais, pointed to the opposite trend to the established goal. This trend may be linked to health-related budget cuts since 2016, when health spending was frozen for 20 years through a Constitutional Amendment 95.21
Considering the results obtained in this study, in view of the current blood therapy context and the technological horizon, two possible solutions to this problem are identified in the literature: I) intensification of blood donation campaigns and II) minimization of the use of blood transfusions.
The intensification of blood donation campaigns may aim to increase the number of blood donations, as also proposed by Pereira et al. (2016) and Carlesso et al. (2017).22,23 The population over 29 years old should be targeted, as they make the most donations in the year and in slower blood donation periods, as found in this study, which are January, March and May.5,7,16
In parallel, the use of transfusions can be minimized by using therapeutic resources that reduce or avoid an allogeneic blood transfusion (blood from someone else) through strategies other than blood transfusions, in accordance with the National Blood and Blood Components Policy. These therapeutic resources include the use of anesthetic products and techniques (acute normovolemic hemodilution, plasma volume expanders and cell-free oxygen carriers), equipment and surgical products that restrict blood loss (electrocautery, cell saver and biological adhesives) and blood production stimulating agents (recombinant human erythropoietin, folic acid and vitamin B12).24
This study has several limitations. The data related to blood donor candidates and the number of donations performed are computed by the Hemominas Foundation according to the location of the procedures; however, people who do not reside in Minas Gerais could have contributed to the analyzed data. In addition, the calculation of the proportion of men and women in the population suitable for adjusted donation only used data from 2018 and 2019 for this study, as the Hemominas Foundation only reported data on donor sex in those years. The difference found between the sexes used here is different than that found for the entire country, where the difference is greater. The difference between the units of the Hemominas Foundation was not considered, while in some cases, the ratios between the sexes is similar and nearly even.15 The series of unretained candidates presented non-normal data. Therefore, we proceeded with the trend and seasonality tests, using the raw data, as the number observed in the series was greater than 20 observations, according to the central limit theorem.
ConclusionAdjusting the rate of blood donations supplied by the population eligible to donate identified the real temporal evolution of blood donations performed. The method developed in this study could contribute to future studies related to blood donation. Therefore, due to the problem of sufficient blood supply elucidated, in addition to encouraging blood donation, the reduction in the blood components demand is encouraged by expanding the use of strategies other than blood transfusions.
Sources of fundingFundação de Amparo à Pesquisa do Estado de Minas Gerais (FAPEMIG).


