
Regulatory T cells (Treg cells) in a tumor environment and the expression of forkhead box P3 (FOXP3) in tumor cells have been associated with a poor prognosis. There are few studies evaluating Treg cells and FOXP3 in B-cell acute lymphoblastic leukemia (B-cell ALL). This study aimed to evaluate the frequencies of Treg cells in bone marrow (BM) and peripheral blood (PB) of patients with B-cell ALL and to determine their associations with the circulating cytokine profile and the expression of CXCR1 (IL-8 receptor) in Treg cells, as well as to compare FOXP3 expression in blasts of patients with B-cell ALL and normal lymphoid precursors.
MethodsSamples of BM and PB from patients with B-cell ALL and healthy controls were studied. Treg cells, cytokines, FOXP3 and CXCR1 were evaluated using flow cytometry and analyzed.
ResultsA total of 20 patients with B-cell ALL and 10 healthy controls were included. In B-cell ALL patients, Treg cell frequencies increased significantly, with higher percentages in the PB. Absolute Treg cell counts were associated with absolute blast counts in the BM and PB and with an IL-8 concentration. The IL-8 and IL-6 levels were associated with the CXCR1 expression in PB Treg cells. In addition, a greater expression of FOXP3 was observed in leukemic blasts than in normal lymphoid precursors.
ConclusionsThese results suggest that the presence of Treg cells and cytokines in the tumor environment may correspond to mechanisms to evade the immune response. For that reason, it would be important to monitor these parameters in B-cell ALL to establish their effect on the disease prognosis.
The B-cell acute lymphoblastic leukemia (B-cell ALL) is a malignant disorder with heterogeneous clinical, biological and evolutionary characteristics. From a biological point of view, there has been a remarkable advance in the molecular identification and characterization of parameters associated with the prognosis of the disease. These include alterations of genes involved in cell cycle control, differentiation and apoptosis.1 In addition, the age at diagnosis, white blood cell count, LDH levels, initial response to chemotherapy, level of minimal residual disease and immunological condition are additional prognostic parameters in these patients.1,2
Regarding the antitumor immune response, it should be noted that in different solid and hematological tumor models, tumor infiltrating lymphocytes (TIL) contain a fraction enriched with Treg cells greater than that observed in peripheral blood mononuclear cells (PBMC) and lymphocytes of lymphoid nodes of the same patient and in the PB of healthy controls.3–5 The ability of Treg cells to migrate to the tumor environment has been associated with the release of pro-inflammatory cytokines, such as IL-6, IL-8, IL-10 and transforming growth factor beta (TGF-β) by tumor cells and increased IL-8 receptor (CXCR1) in Treg cells.6–8 The increased frequency of Treg cells in patients with these malignancies has been directly associated with the inhibition of the antitumor immune response, tumor progression and advanced clinical stages of the disease, as well as inversely correlated with the response to treatment.
Recent studies have shown that the expression of the transcription factor forkhead box P3 (FOXP3) involved in the regulation, development and function of Treg cells in tumor cells of hematopoietic and non-hematopoietic origin is a mechanism of additional evasion of the antitumor immune response.9,10 In tumor cells, the FOXP3 can induce the expression of suppressor molecules, such as TGF-β and B7-H1 (PD-L1), which, in turn, can block the proliferation of tumor antigen-specific T cells.11 From a clinical perspective, more research is needed to evaluate the relationship between different clinical and biological parameters and the expression of the FOXP3 in tumor cells of malignancies, such as acute leukemia.
Based on this background, the objectives of this study were to evaluate the frequencies of Treg cells in bone marrow (BM) and peripheral blood (PB) of patients with B-cell ALL and their associations with the circulating cytokine profile and the expression of CXCR1 (IL-8/IL-8R receptor) in Treg cells, as well as to compare the FOXP3 expression between blasts of patients with B-cell ALL and lymphoid precursor cells from healthy controls.
MethodsPopulation and study samplesThe clinical study was conducted aligned with the Helsinki Declaration, Good Clinical Practice (GCP) and local regulations. The Ethics Committee of the Faculty of Sciences of the Pontificia Universidad Javeriana approved the study. Patients and healthy donors were included after signing the informed consent form. A total of 20 patients with B-cell at the ALL and 10 healthy donors were enrolled. The diagnosis of B-cell ALL was confirmed by bone marrow aspiration and biopsy and immunophenotyping by flow cytometry.12 The BM and PB samples were extracted in EDTA. An aliquot of each sample was used for immunophenotyping and another was centrifuged to obtain plasma that was frozen at -70°C until analysis.
Immunophenotyping by flow cytometryThe frequency and phenotype of Treg, CD4+, CD8+ T and NK cells and the FOXP3 expression in leukemic blasts were evaluated by flow cytometry with different cocktails composed of 4 to 6 fluorescent conjugates. The T-cell staining cocktail contained anti-CXCR1/cyFOXP3/CD4/CD25/CD127/CD3 monoclonal antibodies (mAbs): FITC/PE/PERCPCY5.5/PECy7/APC/APCCy7). The mixture for tumor cells phenotyping included anti-CD45/cyFOXP3/CD19/CD34 mAbs: FITC/PE/PERCPCY5.5/APC. Both stains were performed according to a standard protocol for the detection of membrane and/or intracellular antigens.12 Briefly, for membrane antigens, BM or PB cells were adjusted to 1×10⁶/0.5 ml and incubated with appropriate concentrations of fluorescent mAbs for 15 min at room temperature and darkness. For the detection of the intracellular FOXP3 in Treg cells and blast cells, a commercial kit (eBioscience) was used. According to the manufacturer's instructions, permeation was performed for 15 min at 4°C, followed by incubation with anti-FOXP3/phycoerythrin (PE) mAb for 40 min at 4°C. At the end of the stain, 20µL Cytocount (Dako) fluorescent beads were added to the BM samples to calculate the absolute counts of each cell subset. In the case of the PB, absolute counts were obtained from the data on the complete blood count (CBC). Two additional aliquots were treated as described above, but without adding conjugated mAbs, to establish the autofluorescence of the sample (negative controls). The samples were acquired twice in a FACSAria II flow cytometer (BD Biosciences) using the FACSDiva software (BD Biosciences). Data from 50×103 total events and 0.5 to 1×10⁶ CD3+ T cells were archived in the first and second step, respectively. For the evaluation of the FOXP3 expression in blast cells, 1×10⁶ of the total events were saved. Data analyses were performed using the Paint-A-Gate PRO (BD Biosciences). For each antigen (Ag), the mean fluorescent channel (MFC) and the percentage of positive cells were evaluated. A cell population was classified as positive for a given Ag if its expression (measured as a percentage of positive cells and MFC) was greater than that observed in negative controls (cells without mAbs; autofluorescence). To standardize the MFC FOXP3 in BM samples, the rate between the MFC FOXP3 in a cell subset and the MFC FOXP3 in Treg cells in the same sample (positive control of the FOXP3 expression) was calculated. The FOXP3 expression in BM and PB blasts of patients with B-cell ALL was defined by comparison with the FOXP3 expression in CD34+ B-cell precursors in BM samples from control individuals.
Absolute cell counts in BM samples were calculated according to the following equation:

Where
a = volume of microbeads (20 µL) x concentration of microbeads (microbeads/µL; manufacturer's data)
b = total sample volume (µL) extracted from the individual
c = sample volume after performing washes and concentration (i.e., 5,000 µL) / volume of the concentrated sample used for staining (i.e., 100 µL).
In the protocol described above, the conversion factor is 5,000 µL / 500 µL = 50. In PB samples, absolute counts were obtained from the CBC data.13
The CompBeads™ (BD Bioscences) were used to establish fluorescent signals and voltages for each detector (FL1-FL6) to ensure adequate discrimination between negative and positive events. The cytometer configuration and tracking beads™ (BD Bioscences) were used daily to verify the performance of the flow cytometer according to the manufacturer's instructions.
Detection of plasma-soluble cytokines from BM and PB samplesSoluble cytokines in plasma samples were measured using the Cytokine Bead Array (CBA) Th1/Th2 II (BD Biosciences) cytokine kit, according to the manufacturer's instructions. This kit uses beads of different fluorescence intensity that are linked to the capture of mAbs against IL-2, IL-4, IL-6, IL-10, TNF-α, IL-8, IL-12p70, IL-1 and IFN-γ and a cocktail of mAbs conjugated with PE against each cytokine to reveal the molecules captured in the beads. The detection limits of the assay are: 2.6 pg/ml for IL-2 and IL-4; 3.0 pg/ml for IL-6; 2.8 pg/ml for IL-10 and TNF-α; 1.9 pg/ml for IL-12p70; 7.2 pg/ml for IL-1; 3.6 pg/ml for IL-8, and; 7.1 pg/ml for IFN-γ. The samples were acquired in the FACSAria II flow cytometer with the FACSDiva software and analyzed with the FCAP matrix software (BD Bioscience). Results were obtained from calibration curves for each cytokine covering a range of 0 to 1,000 pg/ml.
Statistical analysisQuantitative variables with mean, median and standard deviation and qualitative parameters with relative frequencies were described. Differences between controls and patients were determined through the Mann-Whitney and Wilcoxon tests. The correlation between the variables was performed with the Spearman test. The differences were considered significant when p < 0.05. The software SPSS version 26 (IBM Corp. Released 2019. IBM SPSS Statistics for Macintosh, Version 26.0. Armonk, NY: IBM Corp), with the GraphPad Prism (La Jolla, CA, USA), was used for the data analysis.
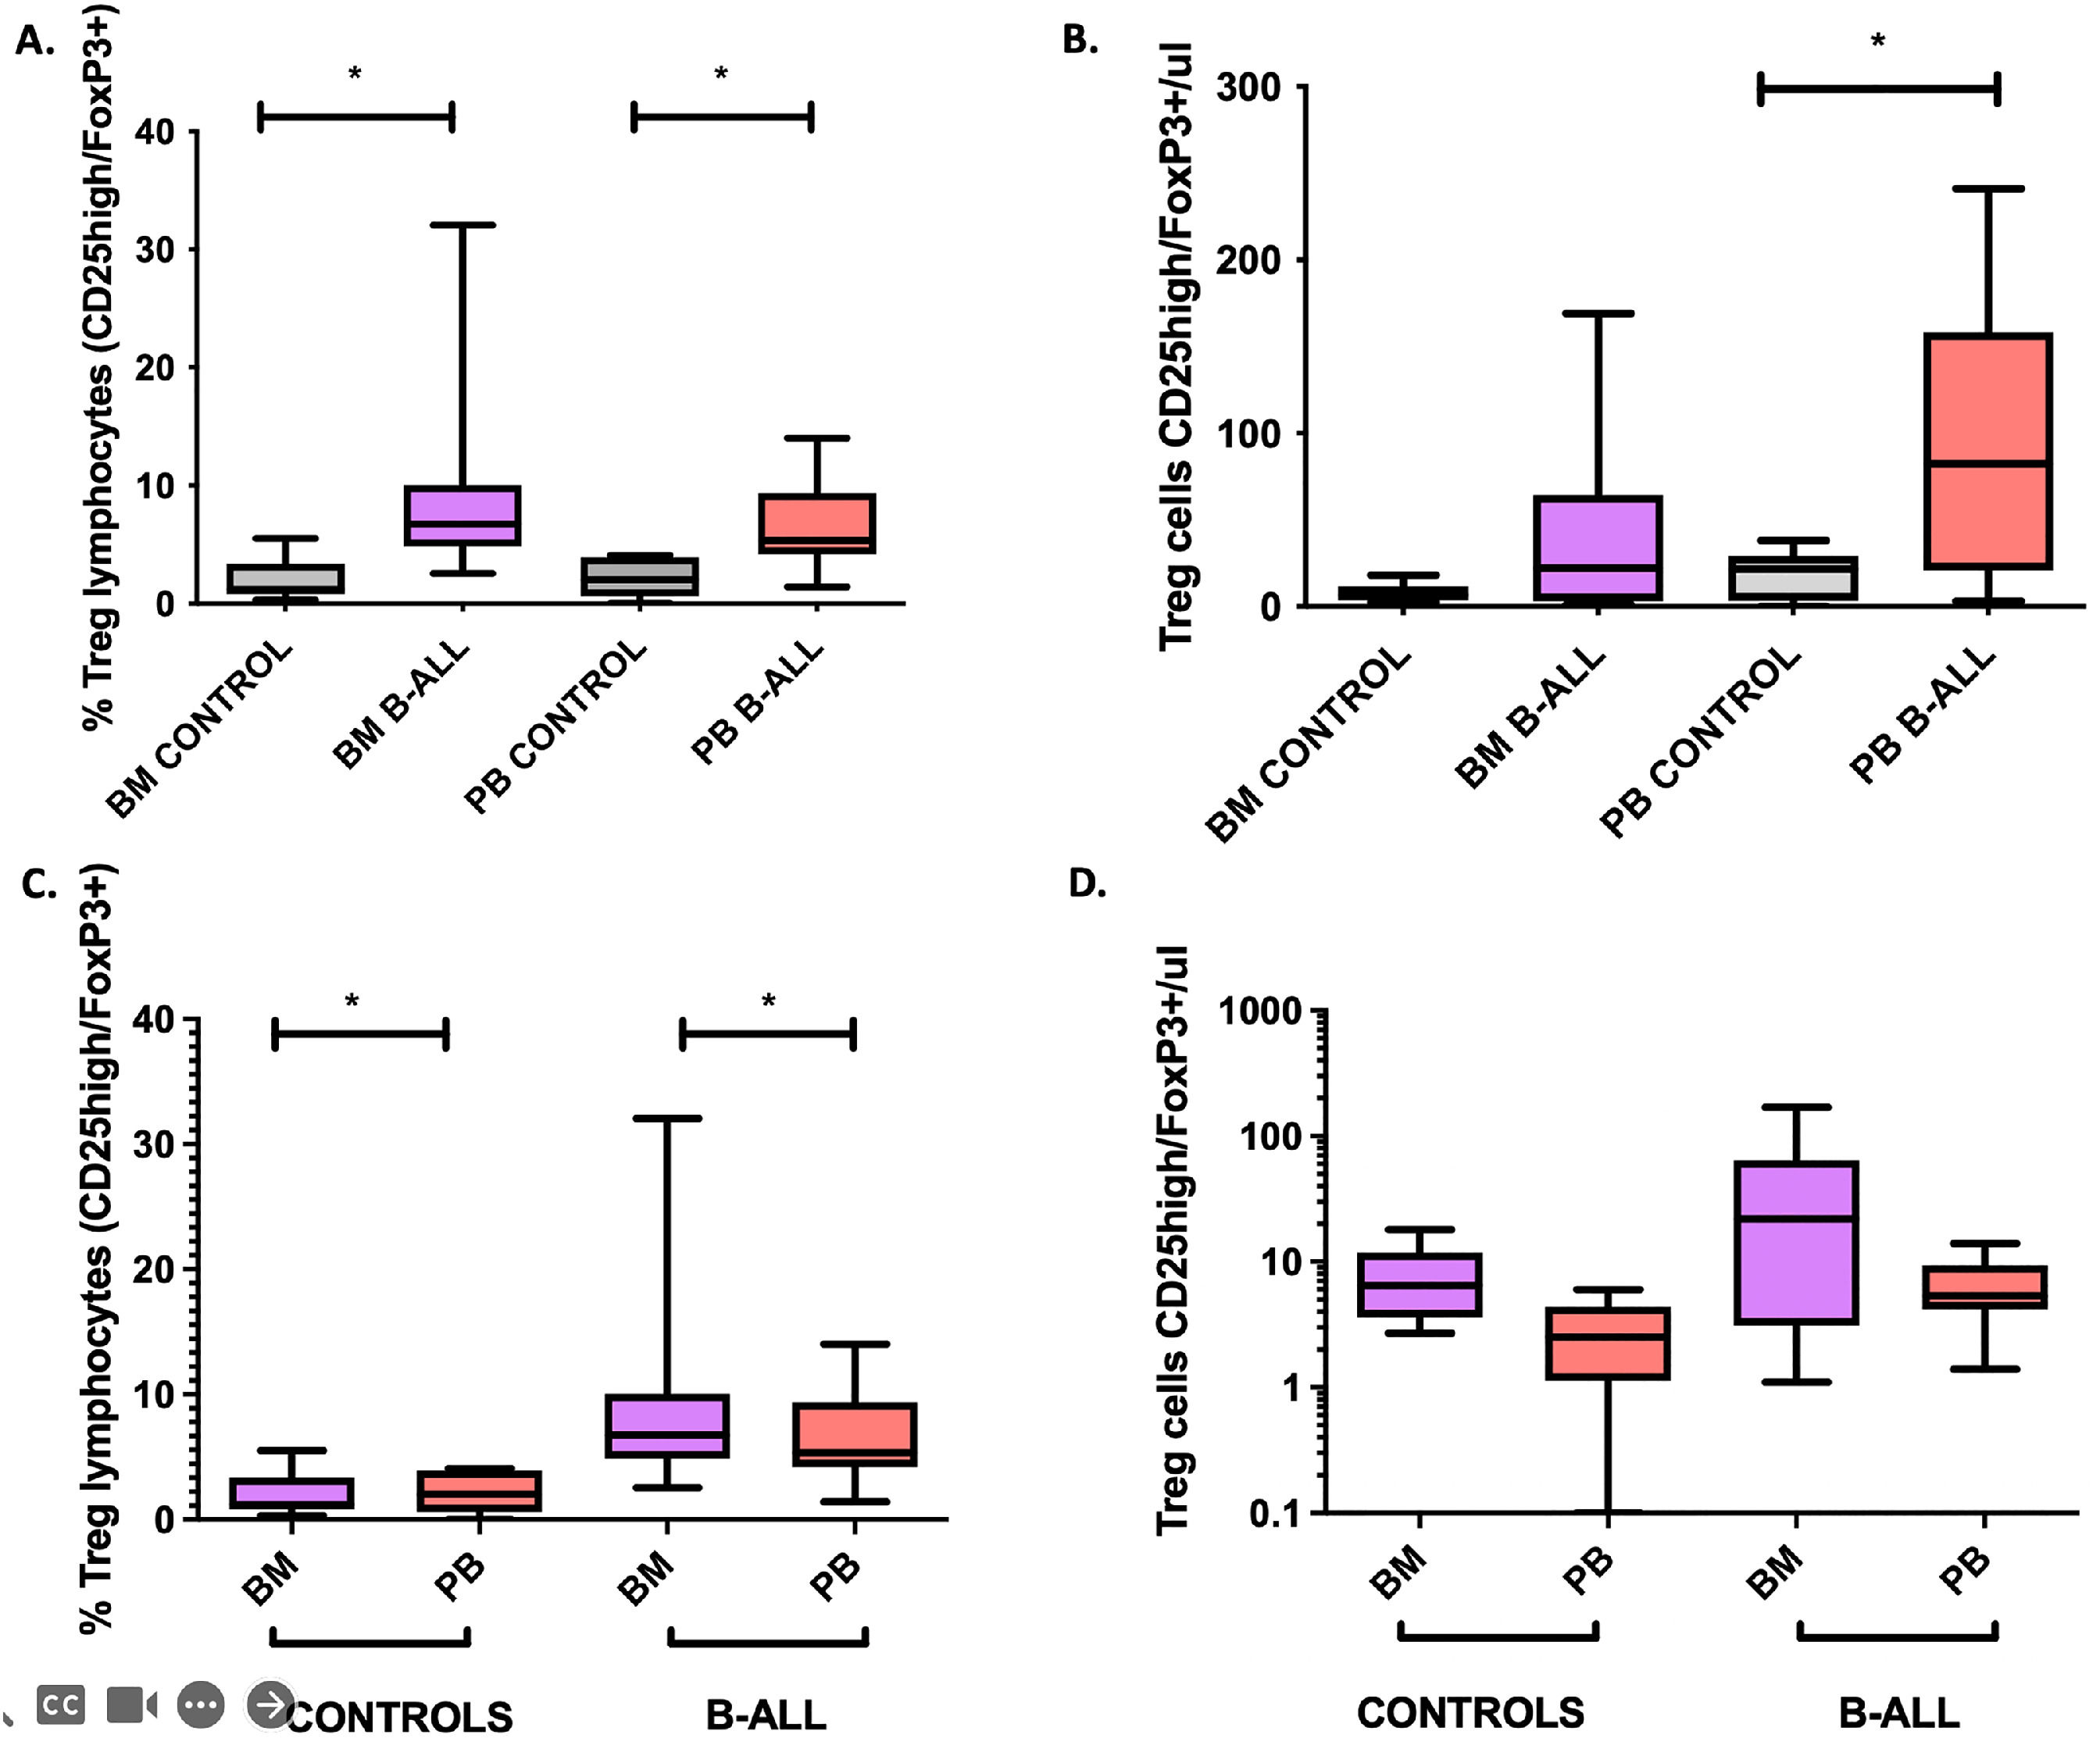
ResultsSignificant increase in Treg cells in BM and PB in patients with B-cell ALLThe phenotypic identification of Treg cells was based on the selection of CD3+CD4+FOXP3+CD25+CD127low. Patients with B-cell ALL had a significant increase (p < 0.05) in relative frequencies and the absolute number of Treg cells in the BM and PB, compared to controls without hematological disease (Figures 1A-B). This finding is similar to the one previously reported.14 However, in the same individual, the relative percentages of Treg cells were higher in the BM and the absolute numbers were higher in the PB (Figure 1A-B). A significant association was found between the absolute numbers of leukemic blasts in the BM and PB with the absolute numbers of Treg cells in the BM and PB (r2 = 0.519, p = 0.04 and r2 = 0.824, p < 0.001, respectively). These findings show the accumulation of Treg cells in microenvironments enriched with tumor cells of the BM and PB.15
 and absolute numbers (panel B) of Treg cells (CD25high/FoxP3+) in BM and PB of patients with B-cell ALL and controls; and comparative analysis of Treg cells in BM and PB (panels C and D). Box and whisker charts extend to the 5th and 95th percentiles. Differences were determined by non-parametric tests. *p<0.05 compared to controls.")
Comparative analysis of relative frequencies (panel A) and absolute numbers (panel B) of Treg cells (CD25high/FoxP3+) in BM and PB of patients with B-cell ALL and controls; and comparative analysis of Treg cells in BM and PB (panels C and D). Box and whisker charts extend to the 5th and 95th percentiles. Differences were determined by non-parametric tests. *p<0.05 compared to controls.
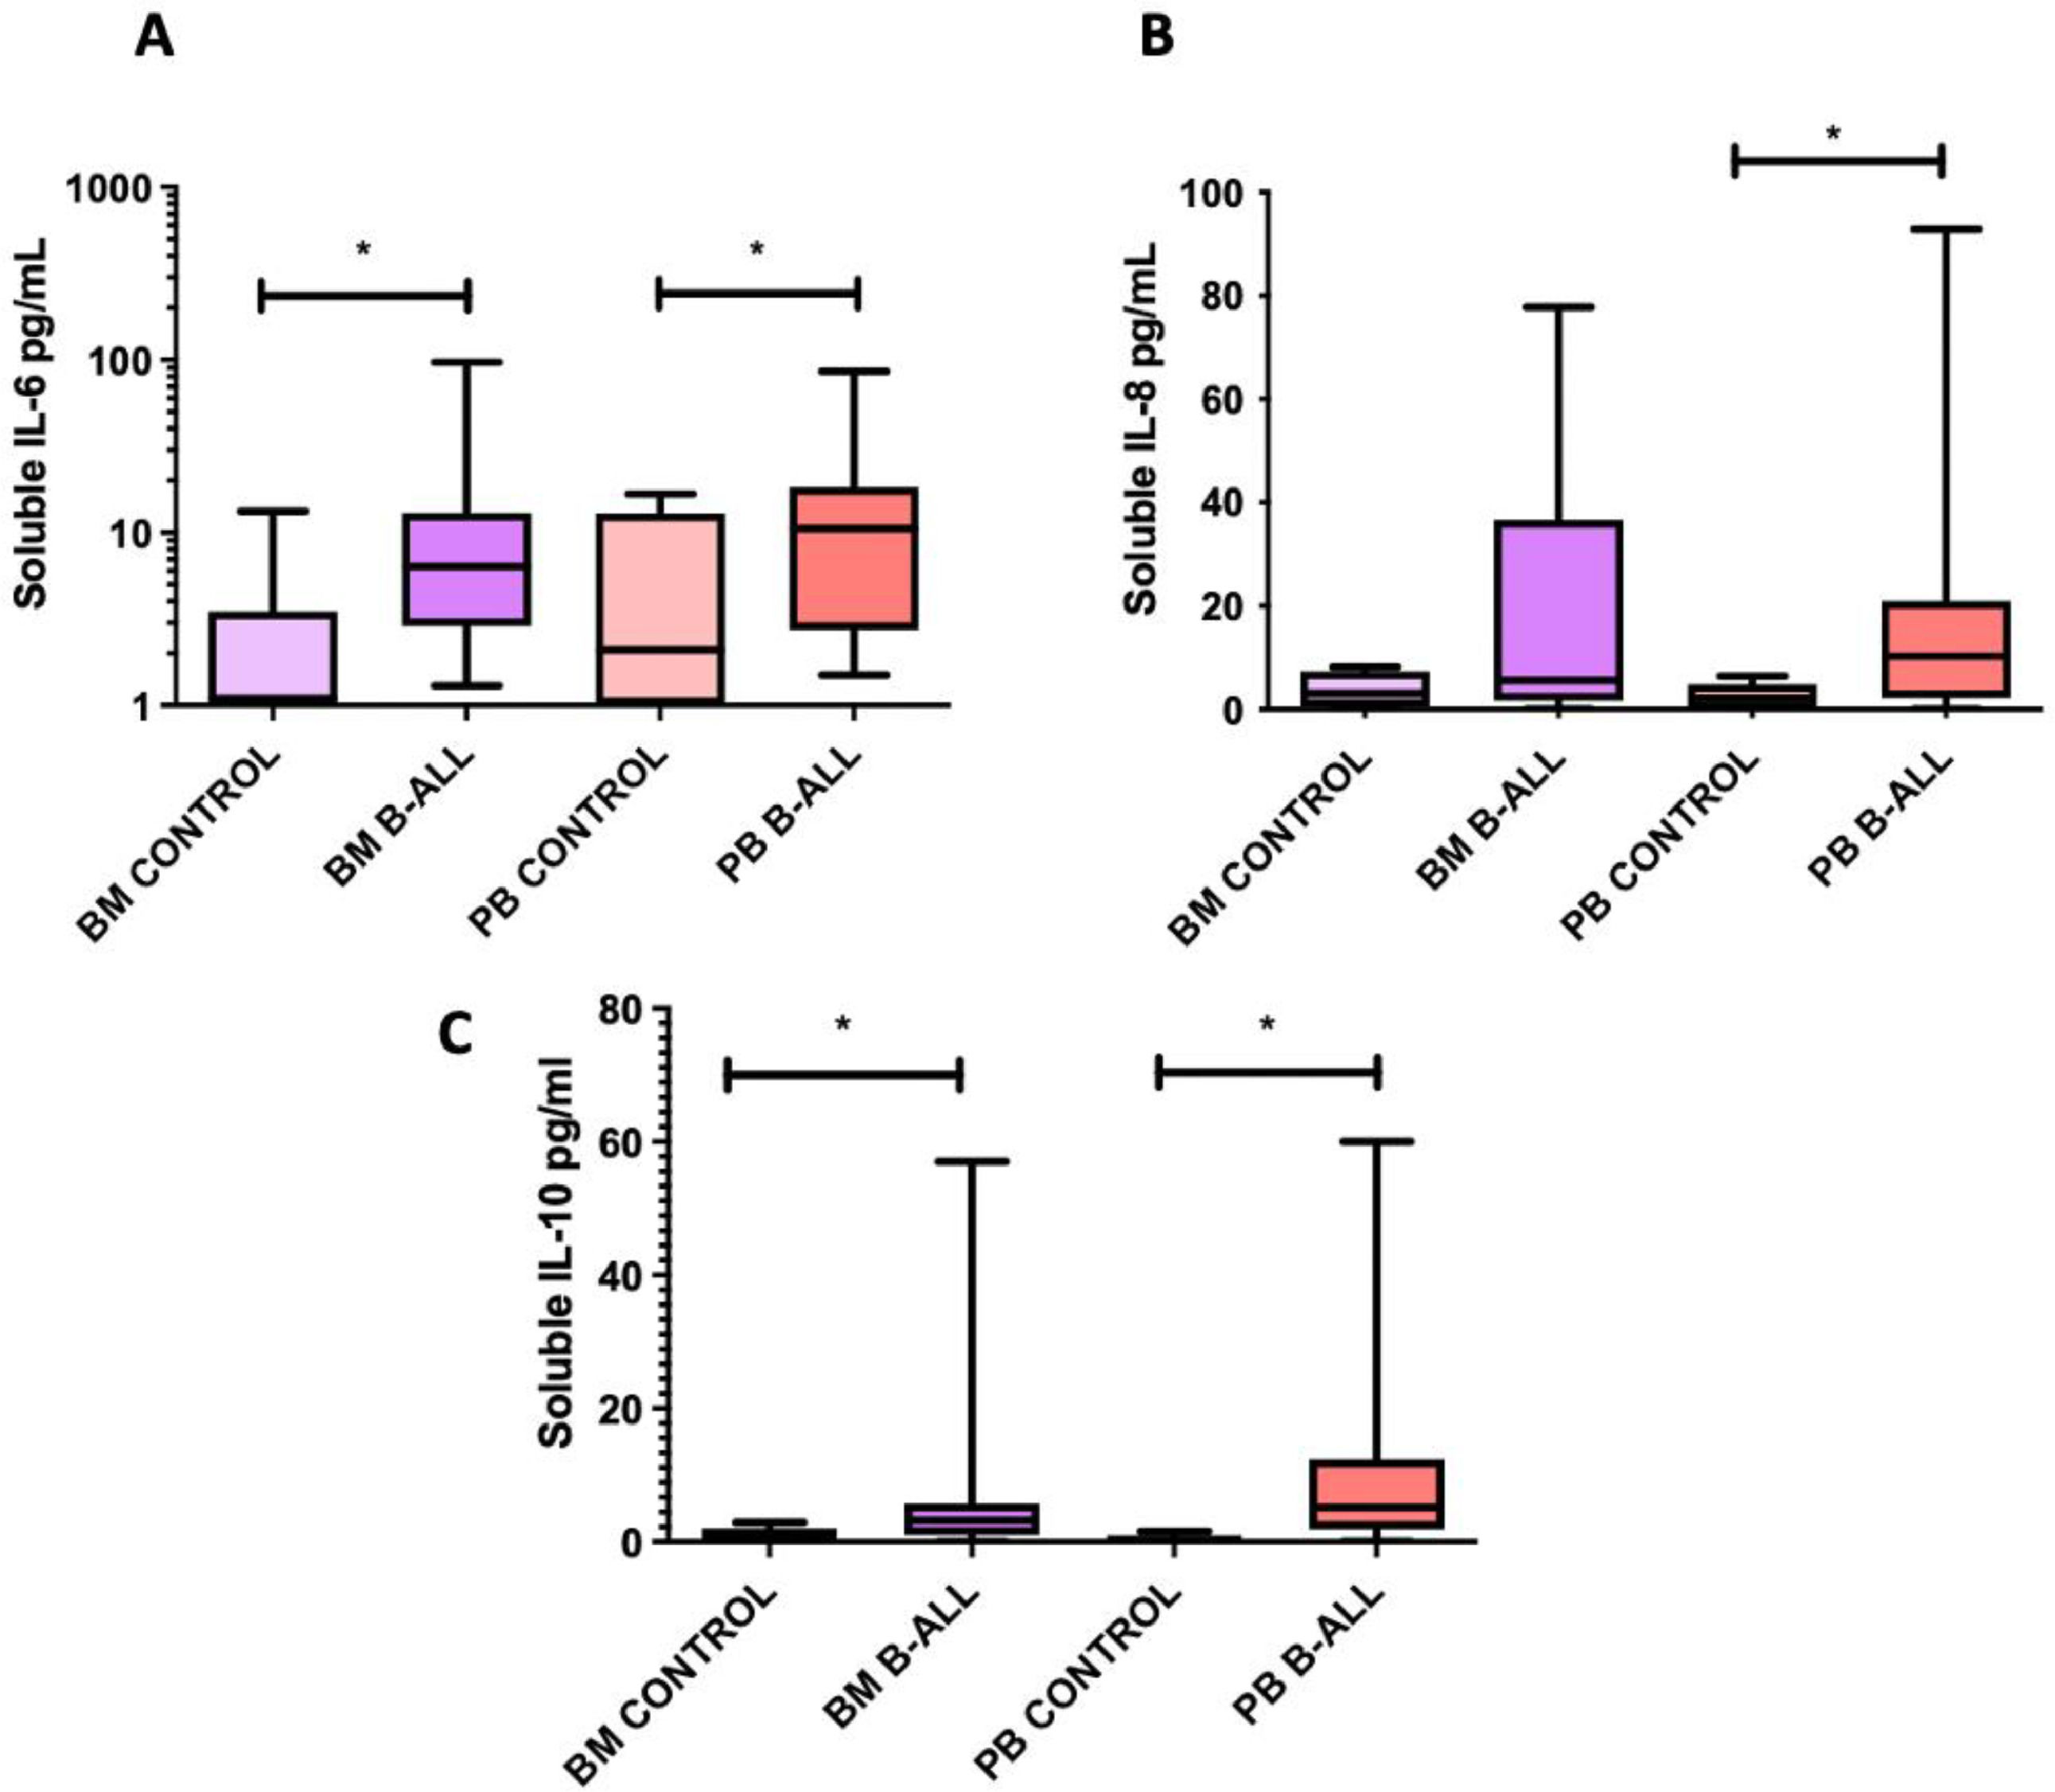
The levels of IL-2, IL-4, IL-6, IL-10, TNF-α, IL-8, IL-12p70, IL-1 and IFN-γ soluble were quantified in plasma obtained from BM and PB samples to assess differences in the cytokine profile between patients with B-cell ALL and controls. The levels of IL-6, IL-8 and IL-10 in the PB, as well as those of IL-6 and IL-10 in the BM of patients with B-cell ALL were higher than those in the controls (Figure 2). The level of IL-8 in the BM was associated with the relative frequencies and absolute numbers of Treg cells in the BM of patients with B-cell ALL (r2 = 0.856, p = 0.01 and r2 = 0.914, p = 0.004, respectively). In these patients, correlations were also found between IL-6 and IL-10 levels in the BM (r2 = 0.737, p = 0.003) and between their blood concentrations of IL-6 and IL-10 (r2 = 0.655, p = 0.006) and IL-6 and IL-8 (r2 = 0.705, p = 0.02).
FOXP3 expression in BM and PB leukemic blasts of patients with B-cell ALL is higher than in normal CD34+ lymphoid cells, IL-8 (B) and IL-10 (C) from BM and PB samples from patients with B-cell ALL and controls. Box and whisker charts extend to the 5th and 95th percentiles. The differences between them were determined by non-parametric tests. *p<0.05 compared to controls.")
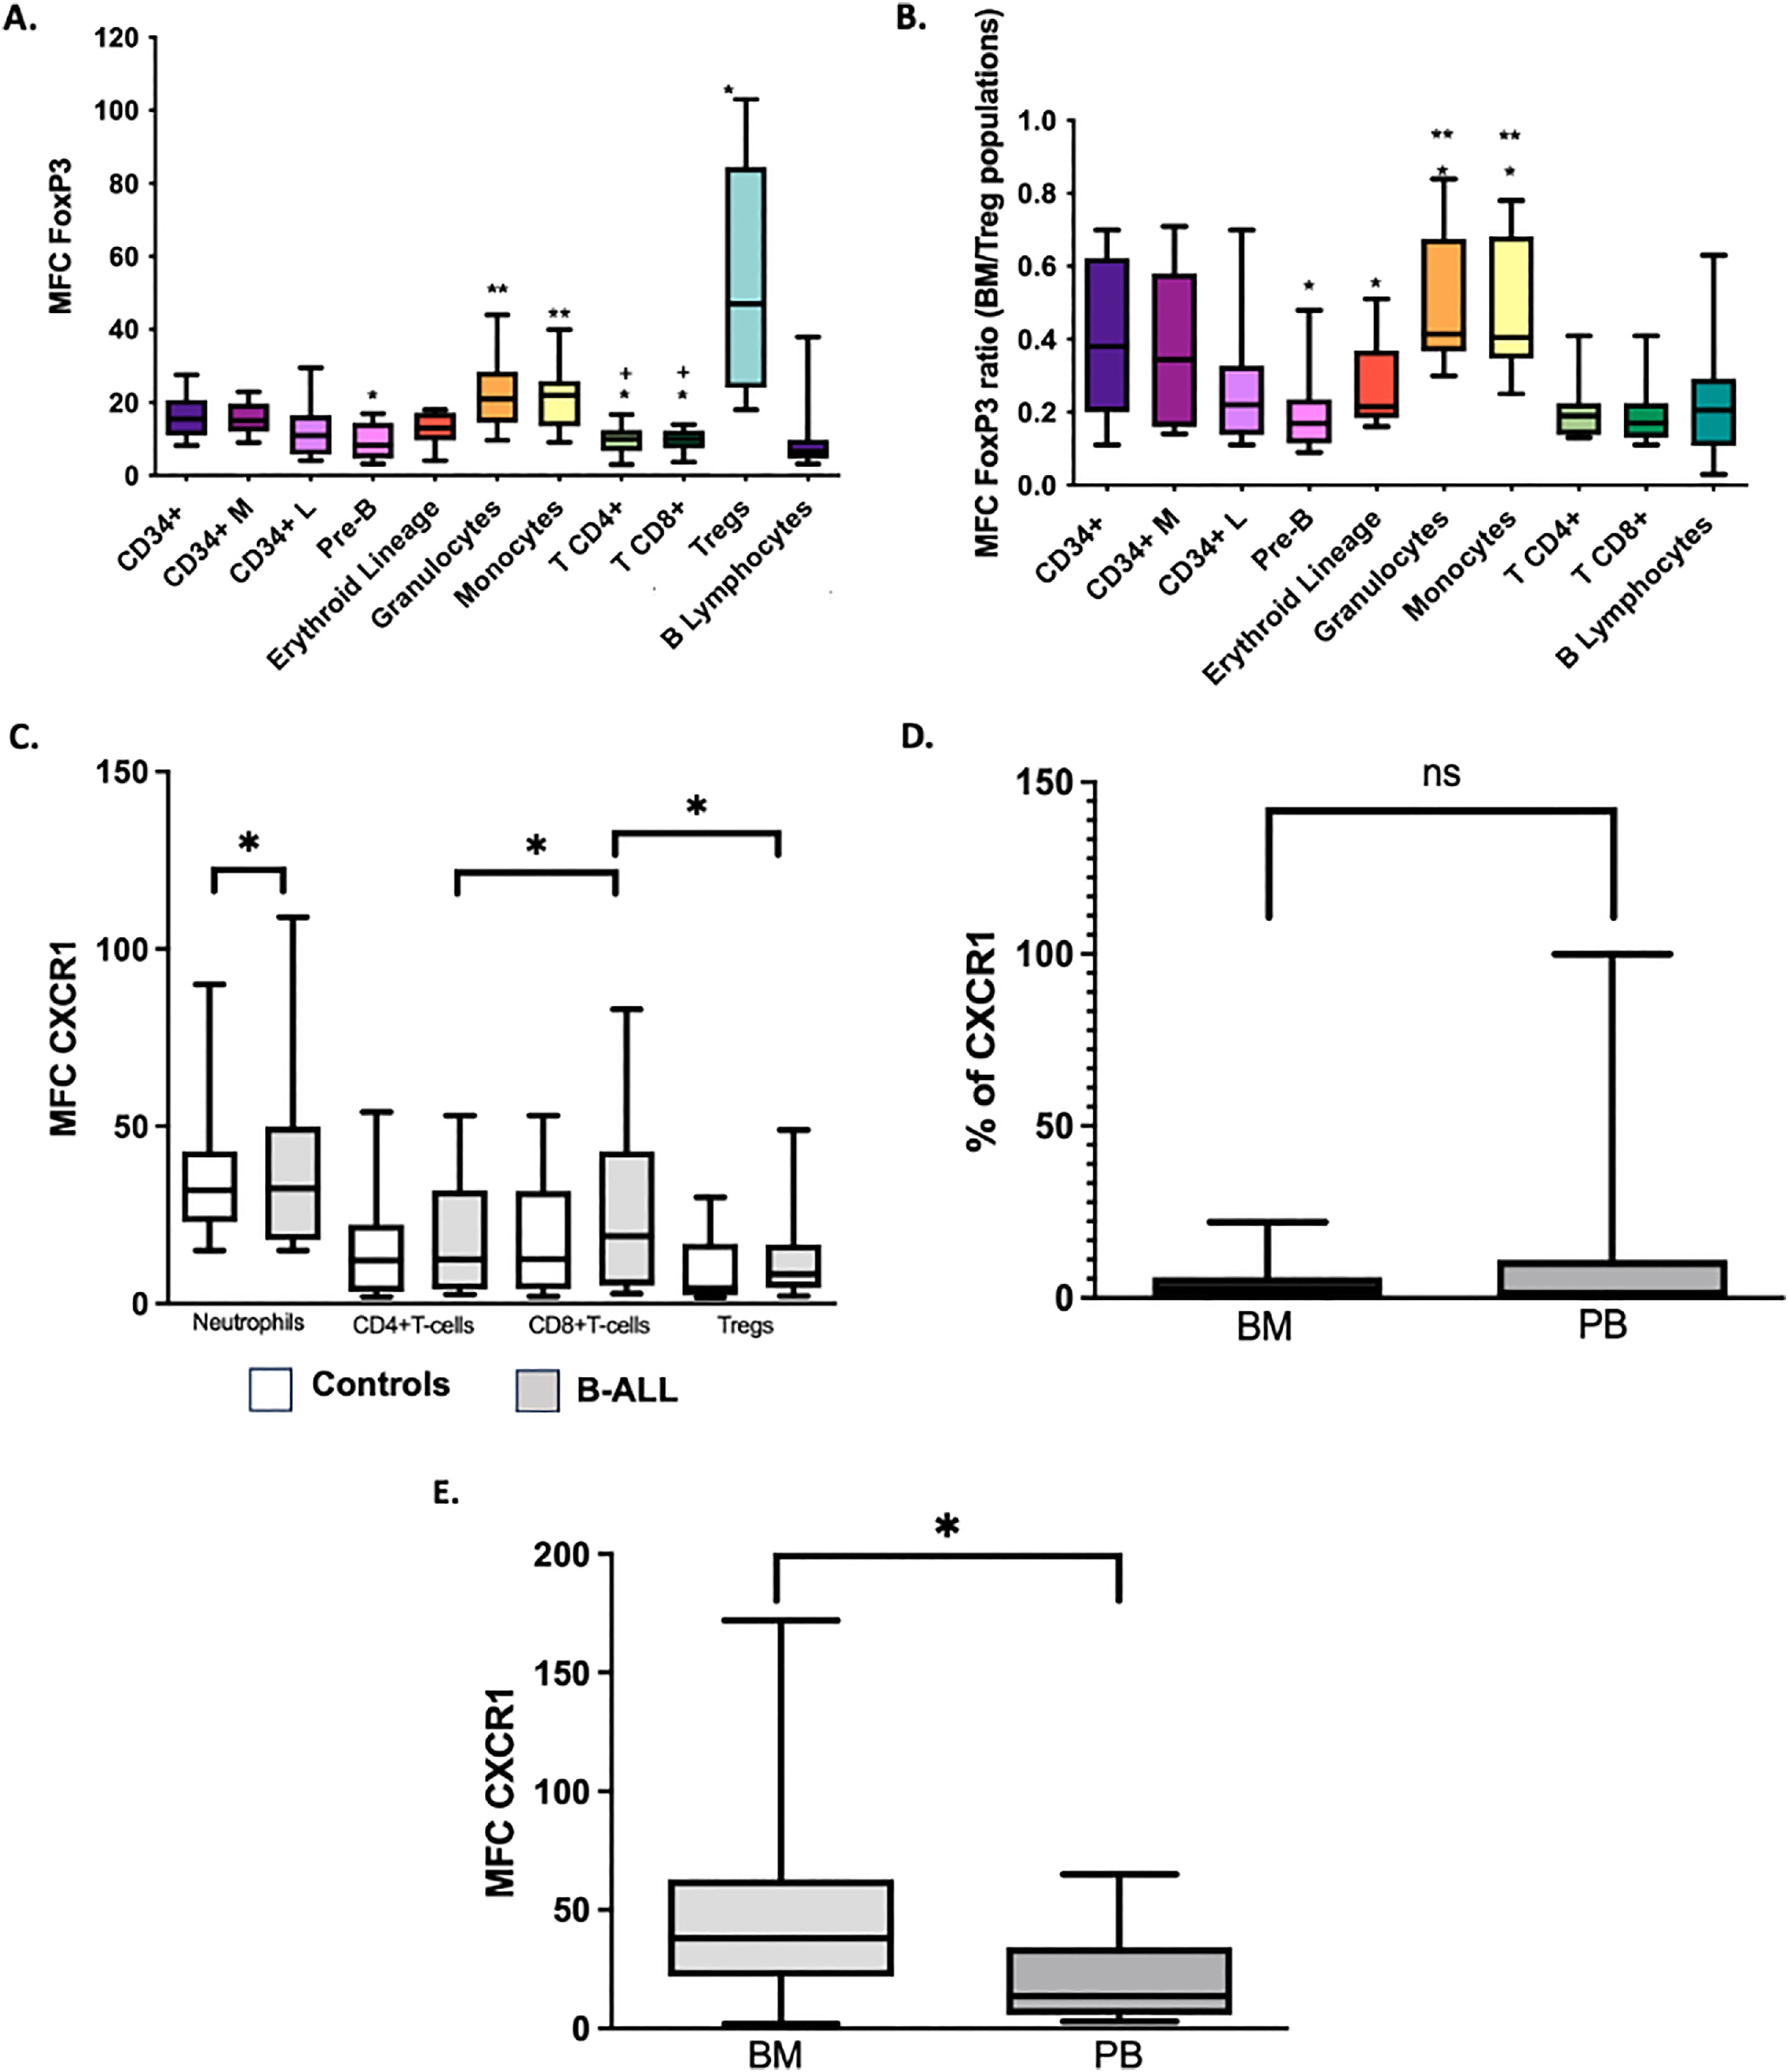
Different studies have shown that the expression of the FOXP3 in tumor cells may be an additional mechanism to evade the antitumor immune response through the induction of the TGF-β and B7-H1 (PD-L1), which have suppressive effect on the proliferation of effector T cells.7,16,17 In this study, the intracellular expression of the FOXP3 was evaluated in all cell subsets in the BM of controls with the aim of establishing the reference values and the distribution of the transcription factor in cells other than Treg cells (Figure 3A-B). As expected, Treg cells were characterized by a significantly higher expression of the FOXP3, compared to the CD4+ and CD8+ T cells (p = 0.005 and p = 0.008, respectively). There were no differences in the FOXP3 expression between the CD34+ and CD34+ lymphoid cells (p > 0.05). However, the total CD34+ cells had a higher MFC FOXP3 than pre-B cells (p < 0.05) and CD4+ and CD8+ T cells (p < 0.05) (Figure 3). Additionally, the most differentiated cells of myeloid lineages, granulocytes and monocytes, showed a greater expression of the FOXP3 than the erythroid cells (p < 0.05 in both cases). In the analysis of leukemic blasts, a tendency (p = 0.08) to a higher expression of the FOXP3 in blasts (MFC Media = 16; range = 6 - 41) was observed, compared to that of CD34+ lymphoid cells in the control BM (MFC Media = 11; range = 4 - 29).
 and the ratio of FoxP3 MFC from a cell subset to FoxP3 MFC of Treg cells in BM of the same sample (BM/MFC) (B). *p<0.05 compared to CD34+ cells. ** p<0.05 compared to erythroblasts (red lineage). +p<0.05 compared to Treg cells. The percentage of CXCR1 MFC (C) cells in BM blasts of patients with B-cell ALL was compared with the values of neutrophils and lymphoid populations in PB of controls; *p<0.05. We compared the percentage of CXCR1+ (D) and CXCR1 MFC (E) cells in BM and PB blasts of patients with B-cell ALL. *p<0.05. Box and whisker charts extend to the 5th and 95th percentiles. ns: p value not significant")
Expression of FoxP3 and CXCR1 in BM and PB cells. FoxP3 MFC in different cell populations of BM (A) and the ratio of FoxP3 MFC from a cell subset to FoxP3 MFC of Treg cells in BM of the same sample (BM/MFC) (B). *p<0.05 compared to CD34+ cells. ** p<0.05 compared to erythroblasts (red lineage). +p<0.05 compared to Treg cells. The percentage of CXCR1 MFC (C) cells in BM blasts of patients with B-cell ALL was compared with the values of neutrophils and lymphoid populations in PB of controls; *p<0.05. We compared the percentage of CXCR1+ (D) and CXCR1 MFC (E) cells in BM and PB blasts of patients with B-cell ALL. *p<0.05. Box and whisker charts extend to the 5th and 95th percentiles. ns: p value not significant
It has been described that IL-6 and IL-8 synthesizing tumor cells induce the IL-8R (CXCR1) expression in FOXP3+ Treg cells. This event is associated with increased migration of suppressor Treg cells to the tumor microenvironment.8 In the present study, we evaluated the expression of the CXCR1 in Treg cells, CD4+ and CD8+ T lymphocytes and in blasts of patients with B-cell ALL. Contrary to the published results, in the BM of patients with B-cell ALL, the expression (MFC) of the CXCR1 in CD8+ T lymphocytes and the percentages of CXCR1+CD8+ T lymphocytes were higher than the values observed in Treg and CD4+ T lymphocytes (p < 0.05) (Figure 3C). In addition, a correlation was found between the level of IL-8 and the percentage of T cells CXCR1+CD8+ (r2 = 0.873, p = 0.01).
In patients with B-cell ALL, the percentage of CXCR1+ blasts in the PB (median = 14%; range: 0 - 100%) was higher, but not significantly different from that of the BM (median: 4.2%; range: 0 - 22%) (Figure 3D). However, the CXCR1 MFC was significantly increased in BM blasts (Figure 3E). Correlations were found between the CXCR1 MFC in PB blasts and blood levels of the IL-6 (r2 = 0.606, p = 0.048) and the IL-8 (r2 = 0.672, p = 0.047).
DiscussionWithin the cell populations that enrich the tumor microenvironment, regulatory T cells play a vital role in tumor progression due to their ability to alter immune homeostasis by promoting an immunosuppressive environment. These cells interact with tumor cells and other cancer-promoting cell populations, such as type 2 macrophages, myeloid suppressor cells and cancer-associated fibroblasts.18 There are several reports on the presence of a fraction enriched with Treg FOXP3+CTLA4+ cells in tumor-infiltrating lymphocytes (TILs) in different solid tumors,19 as well as in acute leukemia,20 and hematopoietic clonal diseases.5 In addition, the frequency of Treg cells in the TIL populations of cancer patients is higher than in their PB and lymphoid nodes and higher than the Treg cell frequencies in the PB of healthy individuals. Similar to these reports, in the present study, we found significantly higher values of Treg cells in the BM and PB in patients with B-cell ALL, which were associated with higher numbers of tumor cells and higher concentrations of IL-8 in the tumor microenvironment.
These findings are of great relevance because an increase in the Treg cell population is directly associated with tumor progression4,21 and advanced clinical stages of the disease and inversely correlated with treatment efficiency.22 It is important to mention that the presence of Treg cells in the BM has important implications for the inhibition of the antitumor immune response and is associated with a more aggressive disease that includes higher relapse rates after treatment.23
The evaluation of soluble cytokines in plasma showed that, in addition to the increased concentration of IL-8 in patients, compared to healthy controls, significantly higher amounts of IL-6 and IL-10 were also found in the BM and PB samples. In different cancer models, elevated levels of IL-10 have been positively associated with a poor prognosis due to its immunosuppressive potential.24 On the other hand, high concentrations of IL-6, IL-8 and IL-10 have been linked to increased migration of Treg cells into the tumor environment, thus giving rise to an additional mechanism to evade the immune response.7,8 Furthermore, in pediatric patients with B-cell ALL, high levels of IL-8 are significantly associated with an increase in the survival and proliferation of mesenchymal cells in the BM. This has a direct effect on the adhesion of mesenchymal cells to leukemic blasts.25
Different studies have shown that chemokine receptors play a very important role in the migration of subsets of T cells during inflammatory, tumor and infectious immune responses. The CXCR1+CD8+ T cells are defined as effector T cells with chemotactic activity towards microenvironments enriched with IL-8.26,27 Comparative analyses on the functional profiles of CXCR1+ versus CXCR1− CD8+ T cells have shown that the CXCR1+ have a decreasing potential to proliferate, produce less IL-2 and are more prone to apoptosis, pointing to their profile of terminally differentiated effector T cells.28 The HL-60 transfected CXCR1 cells (acute promyelocytic leukemia) show an increased chemotactic response and migration in the presence of the IL-8, along with an increased production of reactive oxygen species (ROS), after treatment with phorbol myristate acetate (PMA).29
ConclusionsThe results suggest that in B-cell ALL, Treg cells and the cytokine medium in the tumor environment could act as immune response evasion mechanisms; for this reason, it is important to follow these parameters to establish their impact on the prognosis of the disease.
This research was funded by the Vicerrectoria de Investigaciones, Pontificia Universidad Javeriana (ID 3672). RB and NM were funded in the last months for the writing of the article by the Ministerio de Ciencia, Tecnología e Innovación (Colciencias), Ministerio de Educación Nacional, Ministerio de Industria, Comercio y Turismo and ICETEX (792–2017 2aConvocatoria Ecosistema Científico–Colombia Científica para la Financiación de Proyectos de I+D+i) (contract no. FP44842-221-2018).
The authors thank the patients who generously participated in the study and the funding entities. We also thank Dr. Marta Mesa for English language wording review, editing and correction.


