


This study aimed to evaluate the influence of fetal hemoglobin (Hb F) on hemolysis biomarkers in sickle cell anemia patients.
MethodsFifty adult sickle cell anemia patients were included in the study. All patients were taking hydroxyurea for at least six months and were followed at the outpatient clinic of a hospital in Fortaleza, Ceará, Brazil. The control group consisted of 20 hemoglobin AA individuals. The reticulocyte count was performed by an automated methodology, lactate dehydrogenase and uric acid were measured by spectrophotometry and arginase I by enzyme-linked immunosorbent assay (ELISA). The presence of Hb S was detected by high-performance liquid chromatography. The level of significance was set for a p-value <0.05.
ResultsA significant increase was observed in the reticulocyte count and lactate dehydrogenase, uric acid and arginase I levels in sickle cell anemia patients compared to the control group (p-value <0.05). Patients having Hb F levels greater than 10% showed a significant decrease in the reticulocyte count, arginase I and lactate dehydrogenase. A significant decrease was observed in arginase I levels in patients taking hydroxyurea at a dose greater than 20mg/kg/day.
ConclusionThe results of this study show that sickle cell anemia patients have increases in the hemolysis biomarkers, lactate dehydrogenase, reticulocyte count, arginase I, uric acid and increases in Hb F can reduce the reticulocyte count and arginase I and lactate dehydrogenase levels.
Sickle cell anemia (SCA) is an hemolytic anemia characterized by structural changes in the β-globin chain, leading to the synthesis of an abnormal hemoglobin (Hb) in homozygous (Hb SS).1
The primary event liable for any complications in SCA is the polymerization of Hb S, which culminates in hemolysis and vaso-occlusive events. These in turn trigger other events such as an inflammatory process, increased oxidative stress, endothelial dysfunction and decreased availability of nitric oxide (NO).2
Lactate dehydrogenase (LDH) is a marker of intravascular hemolysis and elevations in its plasma concentration are associated with the clinical phenotype of pulmonary hypertension, priapism and leg ulcers in SCA.3 Studies have demonstrated that LDH may be a useful marker of disease complications related to hemolysis.2,4
Hyperuricemia occurs only in SCA patients who develop abnormal renal tubular function, with decreased uric acid clearance secondary to decreased urate excretion.5
Arginase is the enzyme that converts L-arginine to ornithine and urea. During the hemolysis process, this enzyme is released from red blood cells, contributing to the consumption of L-arginine and decreasing NO concentrations.6,7
There are two distinct isoforms of arginase (I and II), which are encoded by different genes and differ in molecular and immunological properties, tissue distribution, subcellular localization and regulation of expression.8 Arginase I is primarily expressed in the liver and red blood cells, whereas the expression of arginase II (mitochondrial enzyme) is diffused in various tissues such as the brain, bone marrow, kidney, small intestine and mammary glands.9 During the process of hemolysis, NO reacts with Hb to form methemoglobin and nitrate.
Arginase is an enzyme abundant in reticulocytes which predominate in patients with chronic hemolytic anemia, in particular SCA as there is a rapid turnover of red blood cells. Patients who have low arginine levels are more likely to develop pulmonary hypertension, stroke, priapism and leg ulcers, and consequently increased mortality.2,7 Studies have shown a positive association of arginase I with hemolysis markers such as total bilirubin, indirect bilirubin and aspartate aminotransferase.10,11
Fetal hemoglobin (Hb F) is the most powerful modulator of the clinical and hematologic features of SCA influencing both clinical and laboratory features. The pathophysiology of this disease is dependent on the polymerization of deoxy-sickle Hb; the Hb F concentration reduces this process, thereby reducing hemolysis and vaso-occlusive events. The use of hydroxyurea may contribute to increased Hb F production, however, not all patients respond well to this drug.12–15
Thus, the present study aims to evaluate the impact of the Hb F on hemolysis biomarkers in adult patients with SCA.
MethodsSubjects and samplesThis was a cross-sectional and analytical study of fifty adult SCA patients under outpatient treatment at the University Hospital of the Universidade Federal do Ceará (UFC) in Fortaleza, Ceará, Brazil from March 2012 to March 2013. All patients signed informed consent forms according to the research protocol approved by the Ethics Committee of the UFC. Eligibility criteria included adult patients with molecular diagnostics of SCA taking hydroxyurea at a dose of between 0.5 and 1.5g/day for at least six months without recent blood transfusions. Transfusions were documented by the absence of Hb A measured by high-performance liquid chromatography (HPLC) (Ultra Resolution System, Trinity Biotech), according to the criteria described by Ballas et al.16 A control group was composed by twenty blood donors (Hb AA).
Analysis of biomarkersA venous blood sample (10mL) was collected in a tube containing the ethylenediaminetetraacetic acid (EDTA) anticoagulant to manually perform a reticulocyte count and to measure the percentage of Hb F by HPLC analysis. Moreover a 6-mL venous blood sample was collected in a tube with separator gel but without anticoagulant to measure serum LDH, uric acid and arginase I. LDH and uric acid were measured by kinetic analysis using the Labtest® kit. The serum concentration of arginase I was determined according to the enzyme-linked immunosorbent assay (ELISA) kit for human arginase protocol (USCNK Life Science Inc.). The kit is a sandwich enzyme immunoassay for in vitro quantitative measurement of serum arginase I.
Statistical analysisStatistical analysis was performed using GraphPad Prism 5.0 (USA). Initially, data normality was analyzed using the Kolmogorov–Smirnov test. The unpaired t-test and Mann–Whitney test were used to compare two numerical variables. A multiple comparison of means was performed using the analysis of variance (ANOVA) test (Bartlett's test for equal variances) followed by Newman–Keuls post-test to identify which groups were different. The Spearman test was used to correlate the arginase I with Hb F concentration, reticulocyte count, LDH and uric acid levels. All results were expressed as means±standard error of the mean (SEM). The level of significance for all analyses was set for a p-value <0.05.
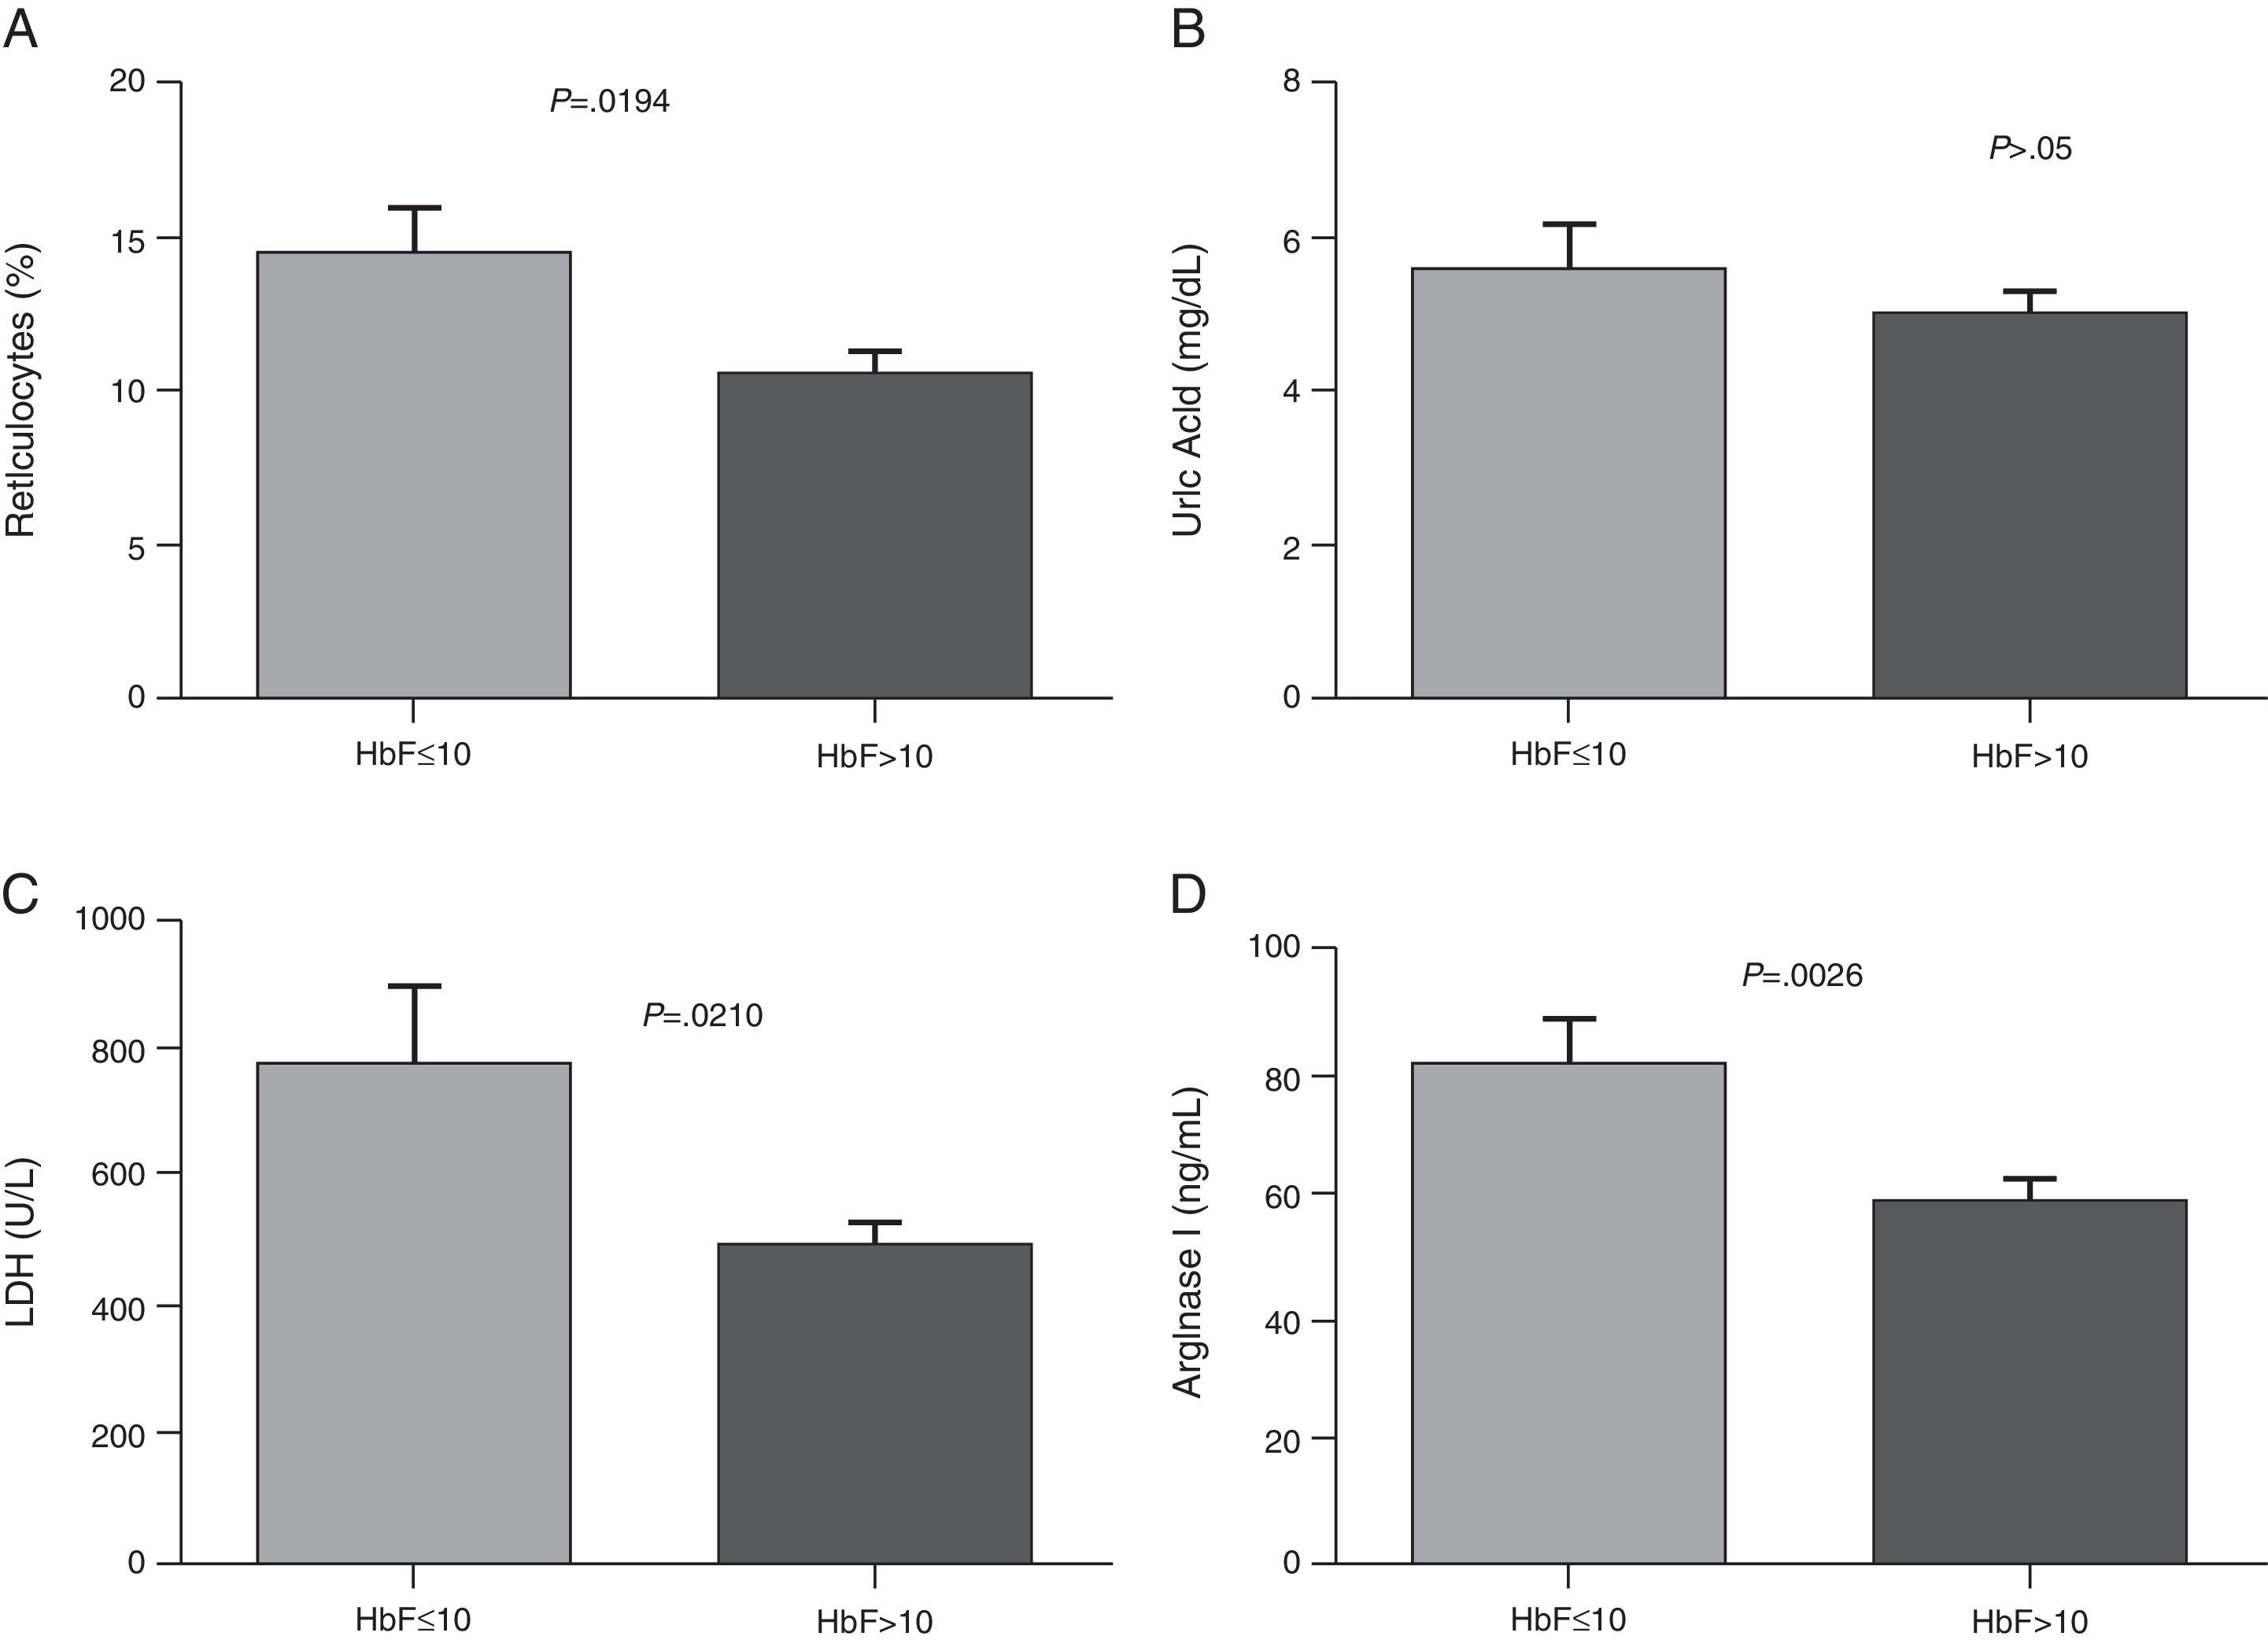
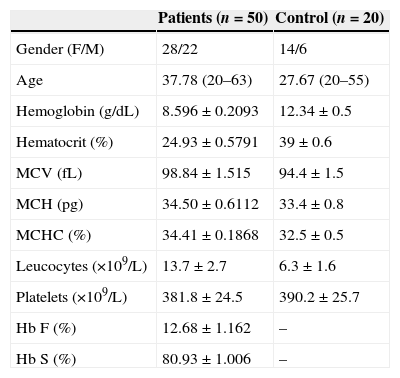
ResultsThe demographic and hematological characteristics of the patients are shown in Table 1. Significant increases in the reticulocyte count, LDH, uric acid and arginase I were observed in patients with SCA compared to the control group (p-value <0.05) (Table 2). Patients with Hb F concentration lower than or equal to 10% showed a significant increase in the reticulocyte count, and arginase I and LDH levels (Figure 1). There was no correlation between the Hb F and uric acid. Patients on low doses of hydroxyurea (<20mg/kg/day) had a significant increase in the arginase I levels (Figure 2). Moreover, there was no significant relationship between hydroxyurea doses and Hb F, LDH, and uric acid levels or the reticulocyte count.
Demographic and hematologic parameters of sickle cell anemia patients (n=50) and control group (n=20).
| Patients (n=50) | Control (n=20) | |
|---|---|---|
| Gender (F/M) | 28/22 | 14/6 |
| Age | 37.78 (20–63) | 27.67 (20–55) |
| Hemoglobin (g/dL) | 8.596±0.2093 | 12.34±0.5 |
| Hematocrit (%) | 24.93±0.5791 | 39±0.6 |
| MCV (fL) | 98.84±1.515 | 94.4±1.5 |
| MCH (pg) | 34.50±0.6112 | 33.4±0.8 |
| MCHC (%) | 34.41±0.1868 | 32.5±0.5 |
| Leucocytes (×109/L) | 13.7±2.7 | 6.3±1.6 |
| Platelets (×109/L) | 381.8±24.5 | 390.2±25.7 |
| Hb F (%) | 12.68±1.162 | – |
| Hb S (%) | 80.93±1.006 | – |
MCV: Mean corpuscular volume; MCH: Mean corpuscular hemoglobin; Hb F: Fetal hemoglobin; Hb S: Sickle hemoglobin.
Data are expressed in mean±standard error of the mean (SEM).
Comparative analysis of the hemolysis parameters in sickle cell anemia patients (n=50) and the control group (n=20).
| Parameters | n | PatientsMean±SEM | n | ControlMean±SEM | p-value |
|---|---|---|---|---|---|
| Reticulocytes (%) | 50 | 13.85±0.89 | 20 | 0.94±0.09 | <0.0001 |
| LDH (U/L) | 50 | 636.20±62.64 | 20 | 310.60±8.39 | 0.0064 |
| Uric acid (mg/dL) | 50 | 5.46±0.28 | 20 | 3.61±0.17 | <0.0001 |
| Arginase I (ng/mL) | 50 | 71.87±4.44 | 20 | 8.61±0.36 | <0.0001 |
LDH: Lactate dehydrogenase.
Data are expressed as means±standard error of the mean (SEM) and analyzed by the Mann–Whitney test and Unpaired t test; significant differences are defined as a p-value <0.05.
 Reticulocytes; (B) Uric Acid; (C) Lactate dehydrogenase (LDH); (D) Arginase I. Results are expressed as means±standard error of the mean (SEM) and analyzed using the unpaired t-test and Mann–Whitney test.")
Comparison of hemolysis biomarkers levels according to HbF concentration. (A) Reticulocytes; (B) Uric Acid; (C) Lactate dehydrogenase (LDH); (D) Arginase I. Results are expressed as means±standard error of the mean (SEM) and analyzed using the unpaired t-test and Mann–Whitney test.
 and analyzed by Unpaired t test.")
SCA is characterized by the presence of Hb S in homozygous and is associated with a heterogeneous clinical presentation, including severe hemolytic anemia, painful crises, and vaso-occlusive events. It is associated with high morbidity and mortality, mainly due to infections, and so studies that might establish prognostic markers for the most severe clinical manifestations of the disease are necessary.17
A significant increase in the reticulocyte count was observed in SCA patients compared to control individuals. Reticulocytosis is a response to the hemolytic process. Cortellazzi et al.18 demonstrated a significant difference in the reticulocyte count in adult patients with SCA compared to a control group (Hb AA). Some authors have attributed the increased reticulocyte count to increased expansion of the erythroid lineage.2,19
In the present study there was a significant increase of serum LDH in patients with SCA compared to the control group. These results are in agreement with the study of Elias et al.20 who found a significant increase of LDH compared to a control group in the same study population at steady state. Stojanovic et al.21 found an elevation in serum LDH levels in patients with SCA in both steady state and in crises. Taylor et al.22 suggest using the determination of LDH in patients with SCA at baseline as a predictive marker of increased risk of mortality due to the infrequency of vaso-occlusive events. In a prospective study, Najim and Hassan23 evaluated LDH as a marker of vaso-occlusion in SCA children and adolescents during episodes. LDH is an enzyme associated with hyper-hemolysis; the authors concluded that LDH is an efficient biochemical marker of the severity of pain during vaso-occlusive episodes.2,19,22 The SCA patients in this study with high Hb F concentrations (>10%) had lower LDH levels, which shows the important role of Hb F in the hemolysis process.
A significant increase in uric acid has been reported in SCA patients compared to control groups. Cerqueira et al.11 showed a positive correlation between uric acid and biomarkers of hemolysis by measuring indirect and total bilirubin levels in SCA patients. However, in the present study no relationship was observed between uric acid levels and other hemolysis markers or Hb F levels. The study of Al-Naama et al.24 showed that uric acid levels were higher in SCA patients than in a control group. These authors attributed the elevation of uric acid to increased bone marrow activity and renewal of nucleic acids that can occur during the hemolysis process.
The results of this study demonstrate an increase in the arginase I levels in SCA patients compared to a control group. These results corroborate a study by Vilas-Boas et al.25 who reported a significant difference in serum arginase in patients with SCA compared to control individuals. The data of the study demonstrate that arginase I is a marker of hemolysis which increases in SCA at steady state and can be used in practice as a modulator of hemolysis.
No correlation was confirmed between the Hb F level and the hemolysis parameters studied, although significant differences in the levels of arginase I, LDH and reticulocytes were observed between patients with low and high Hb F concentrations. This Hb is the main inhibitor of Hb S polymerization, contributing to an improvement in hemolysis and vaso-occlusive events. By inhibiting the tendency that Hb S is polymerized, Hb F prevents the cell damage caused thereby reducing clinical complications in SCA patients.12
Concerning to the use of hydroxyurea, a significant difference was observed in the levels of arginase I in patients who used lower doses (<20mg/kg/day) compared to those on higher doses of hydroxyurea (≥20mg/kg/day) however, there were no significant differences in LDH, uric acid and reticulocytes. Although hydroxyurea can be used in SCA as it can increase the concentration of Hb F, some patients may not respond well to medication, with many factors involved, ranging from genetic polymorphisms to changes in the absorption and metabolism of the drug.13,26,27
The current study did not include patients not taking hydroxyurea, as more than 70% of the patients of the institutions of this study have clinical indications and are thus treated using hydroxyurea. Further studies should be performed to consolidate the results on hemolytic biomarkers as a prognostic parameter in SCA. Our findings suggest that the Hb F concentration can interfere in hemolysis. However, other mechanisms such as genetic factors and the use of hydroxyurea may also affect these parameters.
Conflicts of interestThe authors declare no conflicts of interest.


