
There is a demand to update national mortality trends data related to sickle cell disease (SCD) in Brazil. This study describes causes of death and mortality issues related to SCD using the multiple-cause-of-death methodology.
MethodsThe annual SCD mortality data was extracted from the public databases of the Mortality Information System by researching deaths in rubric D57 “sickle-cell disorders” of the International Classification of Diseases, Tenth Revision and processed by the Multiple Cause Tabulator.
ResultsFrom 2000 to 2018 in Brazil, a total of 9817 deaths related to SCD occurred during the 19-year period, as the underlying cause in 6924 (70.5%) and as the associated cause of death in 2893 (29.5%). The mean and median ages at death during the entire period were significantly lower for males, 29.4 (±19.6) and 27.5 (15.5–41.5), respectively, than for females, 33.3 (±20.3) and 31.0 (19.5–46.5), respectively. The leading SCD overall associated causes of death were septicemias (32.1%), followed by pneumonias (19.4%) and respiratory failure (18.2%). On certificates with SCD as an associated cause, the underlying causes of death were circulatory system diseases (8.7%), followed, in males, by digestive system and infectious diseases and respiratory system failures, while in females, maternal deaths, included in the chapter on pregnancy, childbirth and the puerperium, accounting for 4.6% of female deaths, were succeeded by digestive system and infectious diseases.
ConclusionThis study revised mortality data on death rate trends, underlying and associated causes of death, age at death and regional distribution of death in Brazil.
Sickle cell disease (SCD) is a generic umbrella term that identifies a group of inherited blood disorders, characterized by mutations in the gene encoding the hemoglobin subunit β (HBB), that features the propensity for erythrocytes to shift into crescent or sickle forms. The most common and severe form is homozygous HbSS (sickle cell anemia), a lifelong disease characterized by chronic hemolytic anemia, pain episodes and widespread organ damage. Other forms of sickle cell disease include compound heterozygous conditions that carry the trait, but do not characterize SCD.1 In Brazil there are about two million carriers, 25,000–50,000 persons with the homozygotic form (HbSS) of the disease, 3500 new births every year and an incidence rate ranging from 1:650 live births in the state of Bahia to 1:13,500 live births in the state of Rio Grande do Sul.2
The study on mortality from sickle cell anemia in Brazil, 1979 through 1995, concluded that 80% of patients died before 30 years of age, reflecting the severity of the disease, and that 88% of deaths were not included in mortality statistics, a much more worrisome fact, denoting the incapacity of the health system to identify the disease.3 A review article aiming to describe the mortality by sickle cell disease in Brazil studied eight papers considering the deaths that occurred in the states of Maranhão, Bahia, Minas Gerais, Rio de Janeiro and Mato Grosso do Sul, but not for the entire country. The authors concluded that there are few published articles on mortality in Brazil and emphasized the importance of developing more studies on deaths related to SCD.4 The high SCD fatality rate was emphasized in a mortality study on children under one year old in Bahia from 2008 to 2013.5 A study aiming to describe the mortality of women of childbearing age with sickle cell disease, using national data from 2010 to 2015 in Brazil, determined the need to improve the contraceptive care to reduce the female mortality in the population.6 The first Brazilian study at a single institution in Rio de Janeiro found the overall fatality rate of 16.77% among patients with sickle cell anemia and concluded that mortality rates for children and adults were higher than those reported in developed countries of the northern hemisphere.7 Despite the value of these studies, it is acknowledged that consistent data on mortality, fatality8 and death rates2 related to SCD are not yet available for Brazil as a whole.
This paper seeks to update national trends in mortality related to SCD from 2000 through 2018 using the methodology of multiple causes of death, so as to increase the information on mortality issues data, causes and age at the time of death during this period in Brazil.
MethodsThe annual mortality data was obtained from the public multiple-cause of death databases of the Mortality Information System (Sistema de Informações sobre Mortalidade – SIM), located in the Brazilian Unified Health System Information Technology Department (Departamento de Informática do Sistema Único de Saúde – DATASUS) at the Ministry of Health.9 All deaths were selected from the calendar-years 2000–2018 for SCD, category D57 of the International Classification of Diseases and Related Health Problems, Tenth Revision (ICD-10),10 listed as a cause of death on any line or in either part of the International Form of Medical Certificate of Cause of Death (the medical certification section of the death certificate). Complications of the underlying cause (Part I of the medical certification section) and contributing causes (Part II of the medical certification section), were labeled together as associated (non-underlying) causes of death.11
The causes of death were automatically processed with the software Underlying Cause Selector (Seletor de Causa Básica – SCB). The automatic processing program includes the use of algorithms and decision tables that incorporate the World Health Organization (WHO) mortality standards and the etiological relationships among the causes of death.12 The causes of death evaluated in the present study were those mentioned in the medical certification section, which are known internationally as “entity axis codes”, defined and presented under the structure and headings of the ICD. To reconstruct the morbid process leading to death, all causes of death listed in the medical certification section of the death certificate were considered, including those classified as ill-defined, equated as such, or considered by the WHO as modes of death.10
Using mortality rates, proportions and historical trends, we studied the distributions of the following variables: sex, age at death (in five-year age brackets), year of death, underlying cause of death, associated (non-underlying) cause(s) of death, total mentions of each cause of death, mean number of causes listed per death certificate and geographical distribution of deaths. Medical and demographic variables were processed with the following software: dBASE III Plus, version 1.1 and dBASE IV (Ashton-Tate Corporation, Torrance, CA), Epi Info, version 6.04d (Centers for Disease Control and Prevention, Atlanta, GA), in emulated dbDOS™ PRO 6 environment and Excel 2016 (Microsoft Corporation, Redmond, WA). We used the Multiple Causes Tabulator for Windows (Tabulador de Causas Múltiplas – TCMWIN) program, version 1.6, (DATASUS, Ministério da Saúde, Faculdade de Saúde Pública, Universidade de São Paulo, Brazil), processing codes for ICD-10, in our presentation of the associated causes and of the mean number of causes per death certificate.13
Mortality rates (per 1,000,000 people) related to SCD were calculated by year and for the entire period of 2000–2018, based on the number of deaths reporting SCD as the underlying or associated cause. To calculate the average mortality rate, the overall number of deaths was divided by the sum of the respective annual population counts for the 19-year study period. We employed the 2000–2018 mid-year estimates of the population for Brazil, discriminated by year, sex and age groups. The Epidemiological Analysis of Data Program – Epidat (Programa para Análisis Epidemiológico de Dados), version 4.2 (Dirección Xeral de Innovación e Xestión da Saúde Pública, Xunta de Galicia, http://dxsp.sergas.es, and the Pan American Health Organization) was used to standardize, by the direct method, the sex and age crude and average mortality rates for the study period as a whole, as per the new WHO Standard Population.14 Crude and standardized rates were calculated by 5-year age brackets.
For the presentation of the associated causes listed on the death certificates on which SCD was mentioned as a cause of death, we prepared special lists showing the causes usually associated with the SCD natural history, as well as those mentioned with the greatest frequency. The duplication or multiplication of causes of death was avoided when these were presented in abbreviated lists. The number of causes depends on the breadth of the class of the ICD-10 (subcategory, category, grouping or chapter); therefore, if two or more causes mentioned in the medical certification section were included in the same class, only one cause was computed.
We used the analysis of variance to compare the mean numbers of causes mentioned on the death certificate and the Kruskal–Wallis H test to compare the median age at death between groups. The Joinpoint Regression Program, version 4.7.0.0, was used to evaluate the changes in age-standardized rates trends.15 Assuming a Poisson distribution, joinpoint analysis chooses the best fitting point (or points) at which the rate increases or decreases significantly. To provide uniformity and synthesis, we allowed one joinpoint. Values of p<0.05 were considered significant.
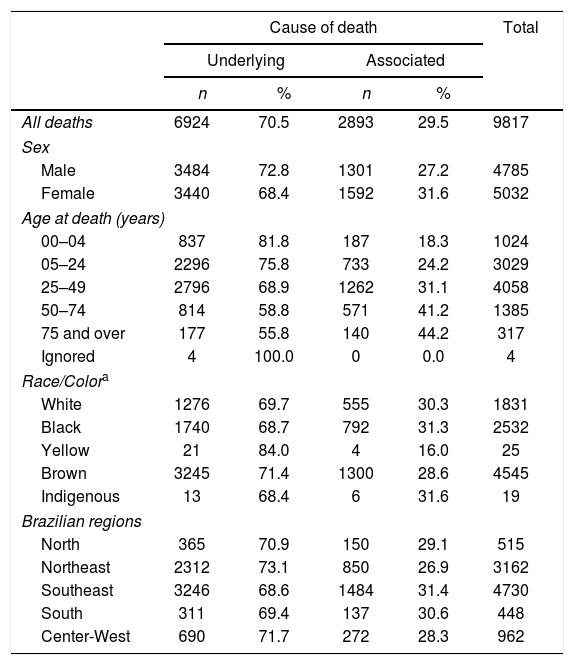
ResultsIn Brazil, from 2000 to 2018, a total of 9817 overall deaths related to SCD occurred, 4785 (48.7%) males and 5032 (51.3%) females (Table 1). An average of 517 deaths occurred per year, varying from 321 in 2000 to 702 in 2016. The SCD was reported as the underlying cause on 6924 (70.5%) certificates, ranging from 81.7% in the state of Piaui to 59.7% in the state of Santa Catarina, whereas SCD as an associated (non-underlying) cause of death was reported on 2893 (29.5%) certificates. Approximately 48.2% of the deaths occurred in the southeastern region (prevailing in the states of São Paulo, Rio de Janeiro and Minas Gerais) and 32.2%, in the northeastern region (mostly in the state of Bahia).
Deaths related to sickle cell disease according to the qualification of the cause of death and gender, age at death and race/color in Brazilian regions from 2000 to 2018.
| Cause of death | Total | ||||
|---|---|---|---|---|---|
| Underlying | Associated | ||||
| n | % | n | % | ||
| All deaths | 6924 | 70.5 | 2893 | 29.5 | 9817 |
| Sex | |||||
| Male | 3484 | 72.8 | 1301 | 27.2 | 4785 |
| Female | 3440 | 68.4 | 1592 | 31.6 | 5032 |
| Age at death (years) | |||||
| 00–04 | 837 | 81.8 | 187 | 18.3 | 1024 |
| 05–24 | 2296 | 75.8 | 733 | 24.2 | 3029 |
| 25–49 | 2796 | 68.9 | 1262 | 31.1 | 4058 |
| 50–74 | 814 | 58.8 | 571 | 41.2 | 1385 |
| 75 and over | 177 | 55.8 | 140 | 44.2 | 317 |
| Ignored | 4 | 100.0 | 0 | 0.0 | 4 |
| Race/Colora | |||||
| White | 1276 | 69.7 | 555 | 30.3 | 1831 |
| Black | 1740 | 68.7 | 792 | 31.3 | 2532 |
| Yellow | 21 | 84.0 | 4 | 16.0 | 25 |
| Brown | 3245 | 71.4 | 1300 | 28.6 | 4545 |
| Indigenous | 13 | 68.4 | 6 | 31.6 | 19 |
| Brazilian regions | |||||
| North | 365 | 70.9 | 150 | 29.1 | 515 |
| Northeast | 2312 | 73.1 | 850 | 26.9 | 3162 |
| Southeast | 3246 | 68.6 | 1484 | 31.4 | 4730 |
| South | 311 | 69.4 | 137 | 30.6 | 448 |
| Center-West | 690 | 71.7 | 272 | 28.3 | 962 |
Source: Ministry of Health, Unified Health System Information Technology Department.
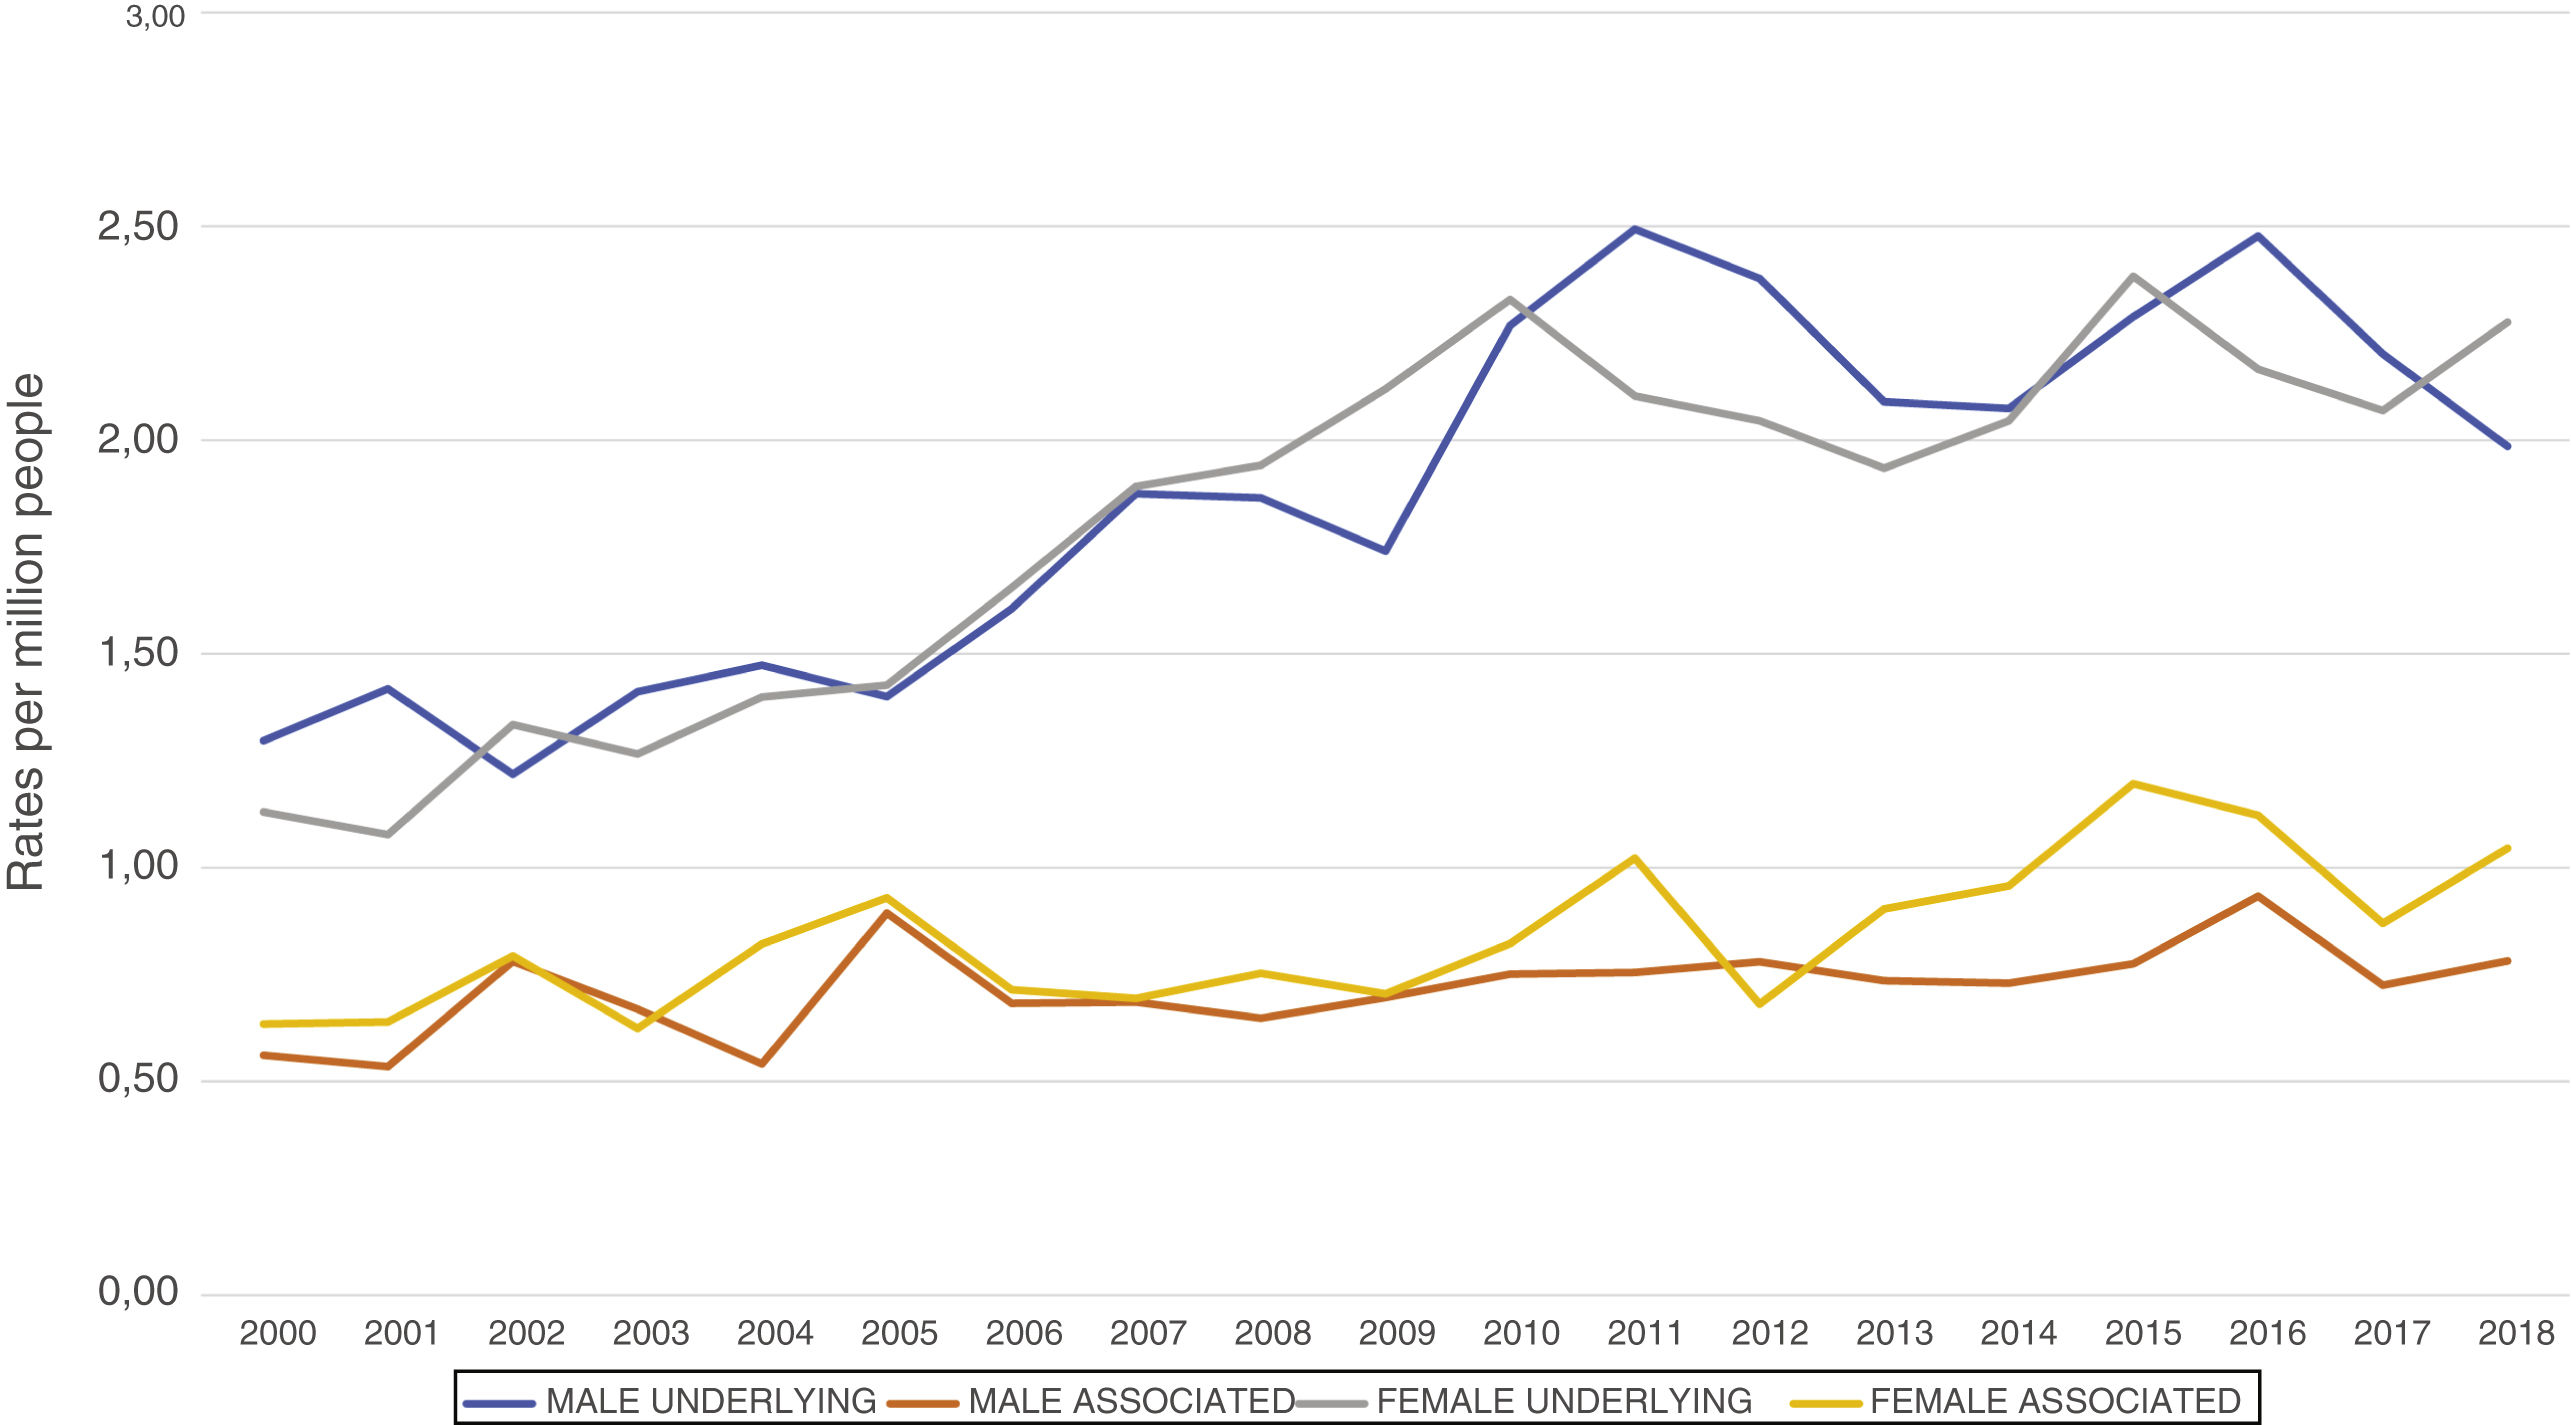
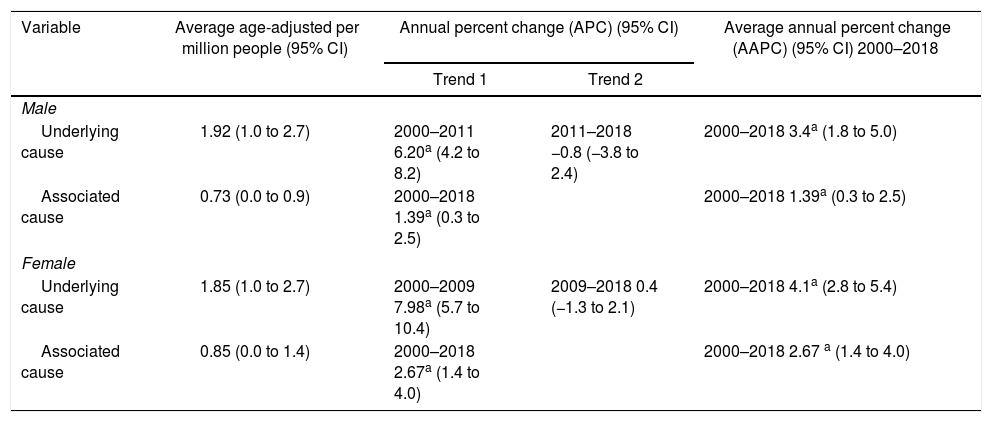
Mortality rates for the years 2000–2018 are presented in Table 2 and Figure 1. Male and female average standardized mortality rates were, for underlying causes of death, 1.92 and 1.85 per million, respectively, and for associated (non-underlying) causes of death, 0.73 and 0.85 per million, respectively. Males and females exhibited similar trends for underlying and associated causes of deaths. Male underlying cause of death increased from 2000 to 2011 (annual percent change (APC) of 6.20%), followed by a decrease through to 2018 (APC of −0.8%), and female underlying causes increased from 2000 to 2009 (APC of 7.98%), that was followed by a leveling (APC of 0.4%) to 2018. For associated causes of death, both males and females displayed continuous increased mortality trends, APCs of 1.39% and 2.67%, respectively, for the whole period.
Age-adjusted and annual percent change trends in mortality rates related to sickle cell disease by gender and cause of death in Brazil from 2000 to 2018.
| Variable | Average age-adjusted per million people (95% CI) | Annual percent change (APC) (95% CI) | Average annual percent change (AAPC) (95% CI) 2000–2018 | |
|---|---|---|---|---|
| Trend 1 | Trend 2 | |||
| Male | ||||
| Underlying cause | 1.92 (1.0 to 2.7) | 2000–2011 6.20a (4.2 to 8.2) | 2011–2018 −0.8 (−3.8 to 2.4) | 2000–2018 3.4a (1.8 to 5.0) |
| Associated cause | 0.73 (0.0 to 0.9) | 2000–2018 1.39a (0.3 to 2.5) | 2000–2018 1.39a (0.3 to 2.5) | |
| Female | ||||
| Underlying cause | 1.85 (1.0 to 2.7) | 2000–2009 7.98a (5.7 to 10.4) | 2009–2018 0.4 (−1.3 to 2.1) | 2000–2018 4.1a (2.8 to 5.4) |
| Associated cause | 0.85 (0.0 to 1.4) | 2000–2018 2.67a (1.4 to 4.0) | 2000–2018 2.67 a (1.4 to 4.0) | |
Source: Ministry of Health, Unified Health System Information Technology Department.

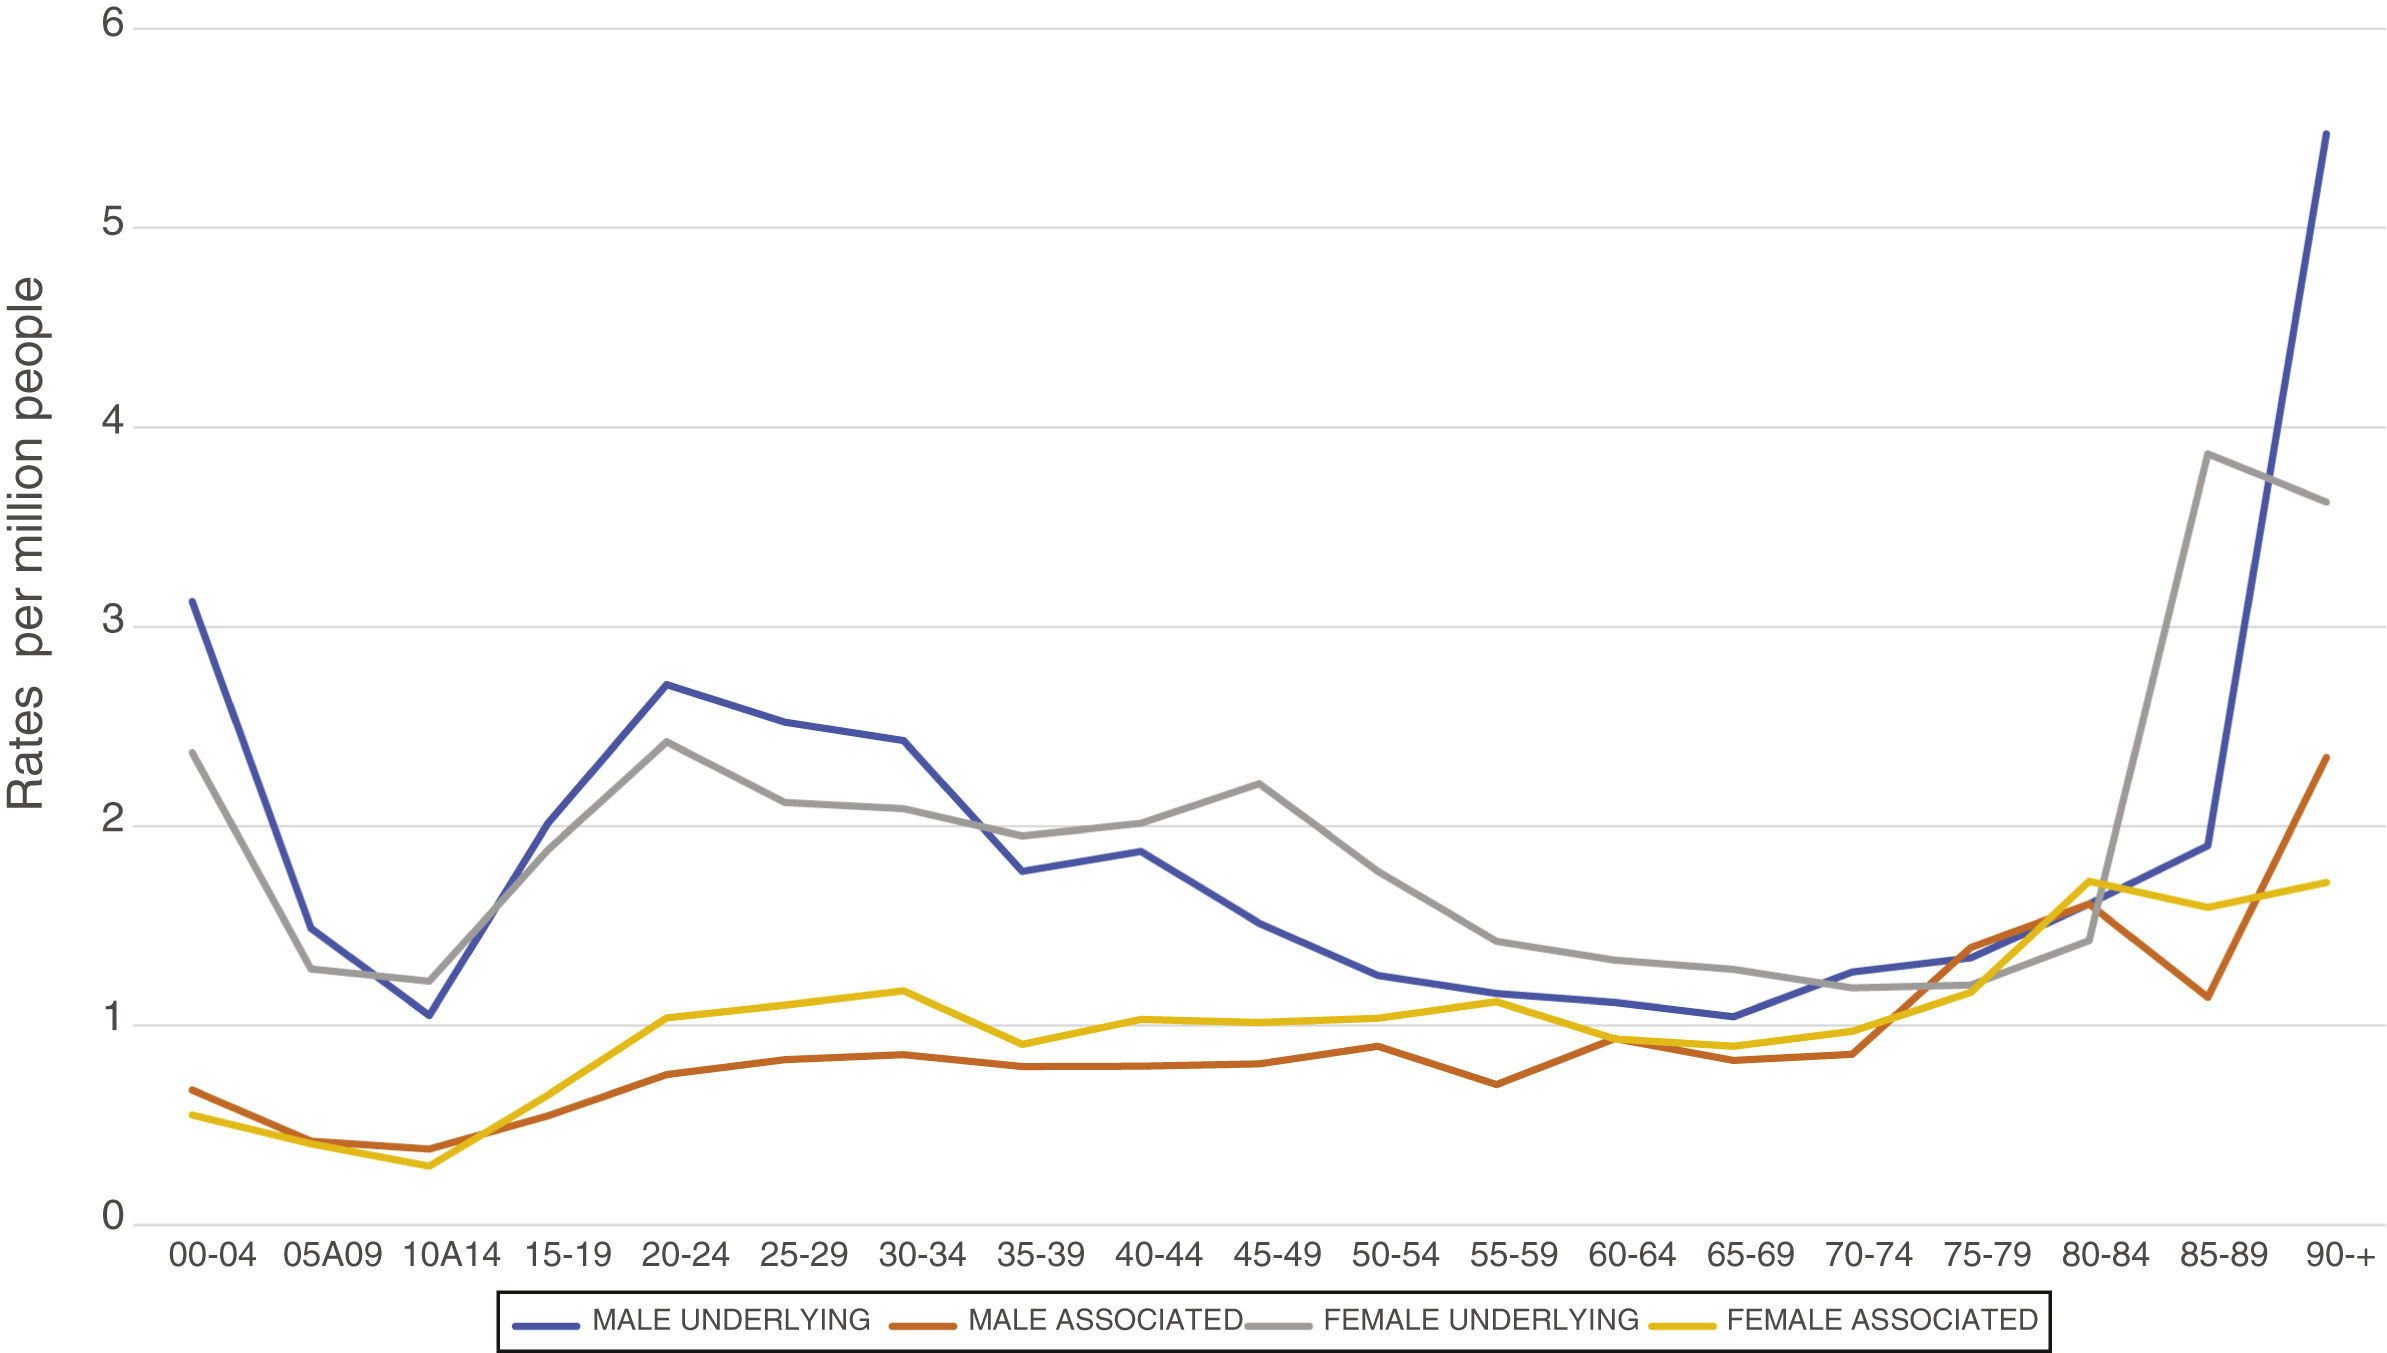
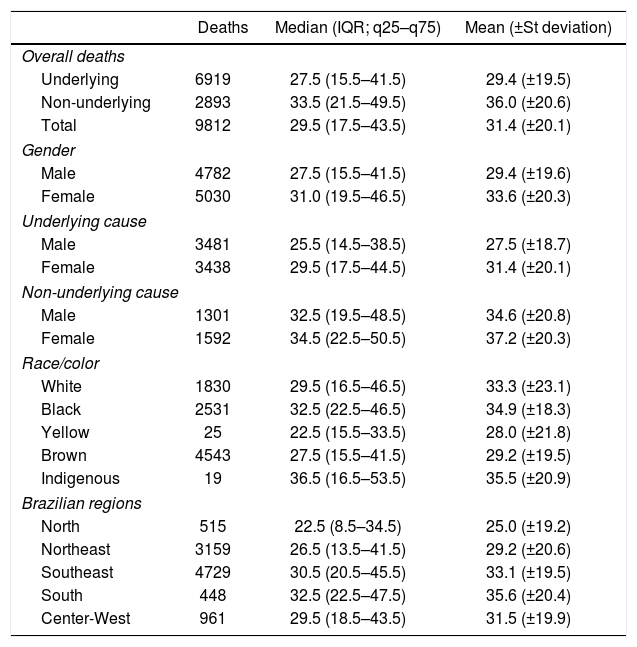
Overall, 10.4% of deaths occurred before five years of age, 27.5% before 18 years, 52.0% before 30 years and 82.6% before 50 years. The highest specific mortality rates, over 2.0 per million people, were observed for underlying causes of death in males under five years, from 15 to 34 years and over 90 years and in females under five years, from 20 to 49 years and over 85 years (Figure 2). The identification of deaths due to an underlying cause ranged from 81.8% for those under five years of age (Table 1) to 47.2% in those 80–84 at death. The mean and median ages at death during the entire period were significantly lower for males, 29.4 (±19.6) and 27.5 (15.5–41.5), respectively, than for females, 33.3 (±20.3) and 31.0 (19.5–46.5), respectively (p=0.0000 for both), and significantly lower as the underlying cause, 29.4 (±19.5) and 27.5 (15.5–41.5), respectively, than as an associated cause, 36.0 (±20.6) and 33.5 (21.5–49.5), respectively (p=0.0000 for both) (Table 3).

Deaths, average, median and interquartile range, mean and standard deviation of ages related to sickle cell disease according to the qualification of cause of death, gender, race/color and Brazilian regions from 2000 to 2018.
| Deaths | Median (IQR; q25–q75) | Mean (±St deviation) | |
|---|---|---|---|
| Overall deaths | |||
| Underlying | 6919 | 27.5 (15.5–41.5) | 29.4 (±19.5) |
| Non-underlying | 2893 | 33.5 (21.5–49.5) | 36.0 (±20.6) |
| Total | 9812 | 29.5 (17.5–43.5) | 31.4 (±20.1) |
| Gender | |||
| Male | 4782 | 27.5 (15.5–41.5) | 29.4 (±19.6) |
| Female | 5030 | 31.0 (19.5–46.5) | 33.6 (±20.3) |
| Underlying cause | |||
| Male | 3481 | 25.5 (14.5–38.5) | 27.5 (±18.7) |
| Female | 3438 | 29.5 (17.5–44.5) | 31.4 (±20.1) |
| Non-underlying cause | |||
| Male | 1301 | 32.5 (19.5–48.5) | 34.6 (±20.8) |
| Female | 1592 | 34.5 (22.5–50.5) | 37.2 (±20.3) |
| Race/color | |||
| White | 1830 | 29.5 (16.5–46.5) | 33.3 (±23.1) |
| Black | 2531 | 32.5 (22.5–46.5) | 34.9 (±18.3) |
| Yellow | 25 | 22.5 (15.5–33.5) | 28.0 (±21.8) |
| Brown | 4543 | 27.5 (15.5–41.5) | 29.2 (±19.5) |
| Indigenous | 19 | 36.5 (16.5–53.5) | 35.5 (±20.9) |
| Brazilian regions | |||
| North | 515 | 22.5 (8.5–34.5) | 25.0 (±19.2) |
| Northeast | 3159 | 26.5 (13.5–41.5) | 29.2 (±20.6) |
| Southeast | 4729 | 30.5 (20.5–45.5) | 33.1 (±19.5) |
| South | 448 | 32.5 (22.5–47.5) | 35.6 (±20.4) |
| Center-West | 961 | 29.5 (18.5–43.5) | 31.5 (±19.9) |
Source: Ministry of Health, Unified Health System Information Technology Department.
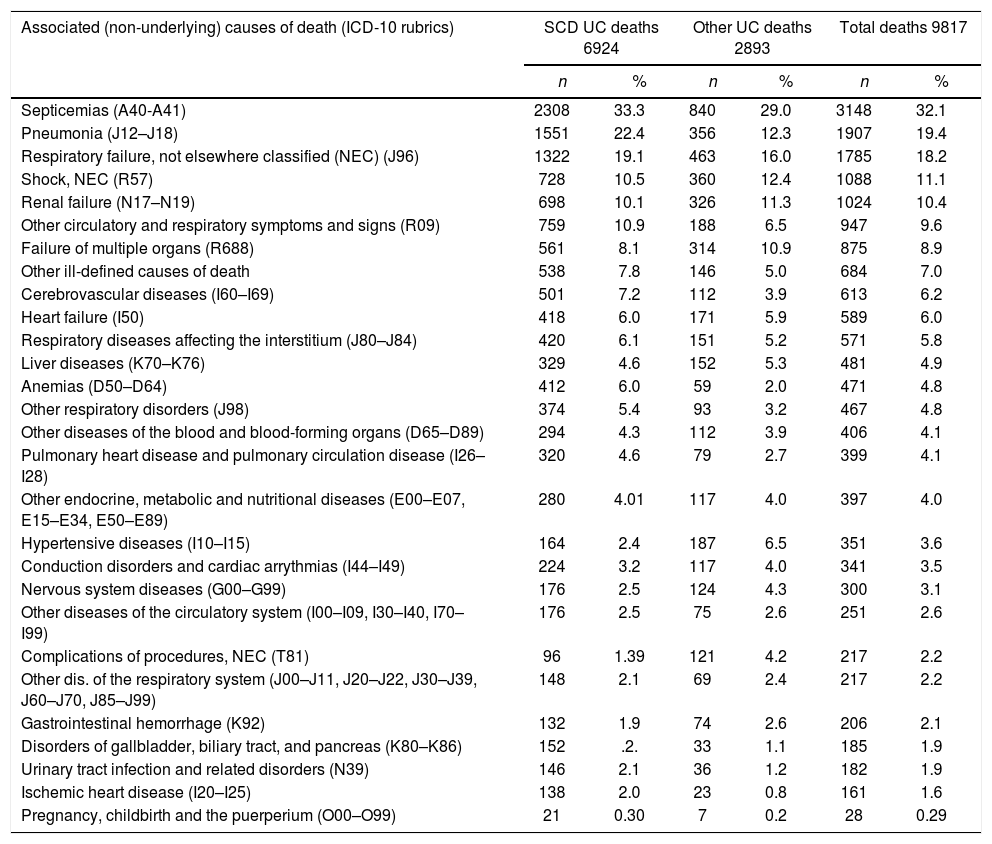
The leading associated (non-underlying) causes of deaths listed on death certificates, on which the underlying causes were SCD and other selected conditions for the years 2000–2018, are displayed in descending order in Table 4. Unquestionably, the septicemias responsible for 32.1% of the overall deaths, stand out as the main associated cause, followed by pneumonias and respiratory failure. As usual in death certification, the terminal ill-defined, circulatory and respiratory symptoms and signs appear among the leading causes. Additionally, 28 maternal deaths, included in the pregnancy, childbirth and puerperium ICD chapter, were observed as associated causes. The crude mean numbers of 3.21 (±1.16), 4.14 (±1.24) and 3.49 (±1.26) causes per death certificate were observed among SCD and other selected underlying causes of death and total deaths, respectively.
Leading associated (non-underlying) causes on death certificates in which sickle cell disease was identified as the underlying cause (UC) or as an associated (non-underlying) cause and total deaths in Brazil from 2000 to 2018.
| Associated (non-underlying) causes of death (ICD-10 rubrics) | SCD UC deaths 6924 | Other UC deaths 2893 | Total deaths 9817 | |||
|---|---|---|---|---|---|---|
| n | % | n | % | n | % | |
| Septicemias (A40-A41) | 2308 | 33.3 | 840 | 29.0 | 3148 | 32.1 |
| Pneumonia (J12–J18) | 1551 | 22.4 | 356 | 12.3 | 1907 | 19.4 |
| Respiratory failure, not elsewhere classified (NEC) (J96) | 1322 | 19.1 | 463 | 16.0 | 1785 | 18.2 |
| Shock, NEC (R57) | 728 | 10.5 | 360 | 12.4 | 1088 | 11.1 |
| Renal failure (N17–N19) | 698 | 10.1 | 326 | 11.3 | 1024 | 10.4 |
| Other circulatory and respiratory symptoms and signs (R09) | 759 | 10.9 | 188 | 6.5 | 947 | 9.6 |
| Failure of multiple organs (R688) | 561 | 8.1 | 314 | 10.9 | 875 | 8.9 |
| Other ill-defined causes of death | 538 | 7.8 | 146 | 5.0 | 684 | 7.0 |
| Cerebrovascular diseases (I60–I69) | 501 | 7.2 | 112 | 3.9 | 613 | 6.2 |
| Heart failure (I50) | 418 | 6.0 | 171 | 5.9 | 589 | 6.0 |
| Respiratory diseases affecting the interstitium (J80–J84) | 420 | 6.1 | 151 | 5.2 | 571 | 5.8 |
| Liver diseases (K70–K76) | 329 | 4.6 | 152 | 5.3 | 481 | 4.9 |
| Anemias (D50–D64) | 412 | 6.0 | 59 | 2.0 | 471 | 4.8 |
| Other respiratory disorders (J98) | 374 | 5.4 | 93 | 3.2 | 467 | 4.8 |
| Other diseases of the blood and blood-forming organs (D65–D89) | 294 | 4.3 | 112 | 3.9 | 406 | 4.1 |
| Pulmonary heart disease and pulmonary circulation disease (I26–I28) | 320 | 4.6 | 79 | 2.7 | 399 | 4.1 |
| Other endocrine, metabolic and nutritional diseases (E00–E07, E15–E34, E50–E89) | 280 | 4.01 | 117 | 4.0 | 397 | 4.0 |
| Hypertensive diseases (I10–I15) | 164 | 2.4 | 187 | 6.5 | 351 | 3.6 |
| Conduction disorders and cardiac arrythmias (I44–I49) | 224 | 3.2 | 117 | 4.0 | 341 | 3.5 |
| Nervous system diseases (G00–G99) | 176 | 2.5 | 124 | 4.3 | 300 | 3.1 |
| Other diseases of the circulatory system (I00–I09, I30–I40, I70–I99) | 176 | 2.5 | 75 | 2.6 | 251 | 2.6 |
| Complications of procedures, NEC (T81) | 96 | 1.39 | 121 | 4.2 | 217 | 2.2 |
| Other dis. of the respiratory system (J00–J11, J20–J22, J30–J39, J60–J70, J85–J99) | 148 | 2.1 | 69 | 2.4 | 217 | 2.2 |
| Gastrointestinal hemorrhage (K92) | 132 | 1.9 | 74 | 2.6 | 206 | 2.1 |
| Disorders of gallbladder, biliary tract, and pancreas (K80–K86) | 152 | .2. | 33 | 1.1 | 185 | 1.9 |
| Urinary tract infection and related disorders (N39) | 146 | 2.1 | 36 | 1.2 | 182 | 1.9 |
| Ischemic heart disease (I20–I25) | 138 | 2.0 | 23 | 0.8 | 161 | 1.6 |
| Pregnancy, childbirth and the puerperium (O00–O99) | 21 | 0.30 | 7 | 0.2 | 28 | 0.29 |
Source: Ministry of Health, Unified Health System Information Technology Department.
Percent related to the number of deaths.
Rubrics and codes of the International Statistical Classification of Diseases and Related Health Problems, Tenth Revision.
Duplication/multiplication of causes removed from ICD-10 Chapters, groups and categories.
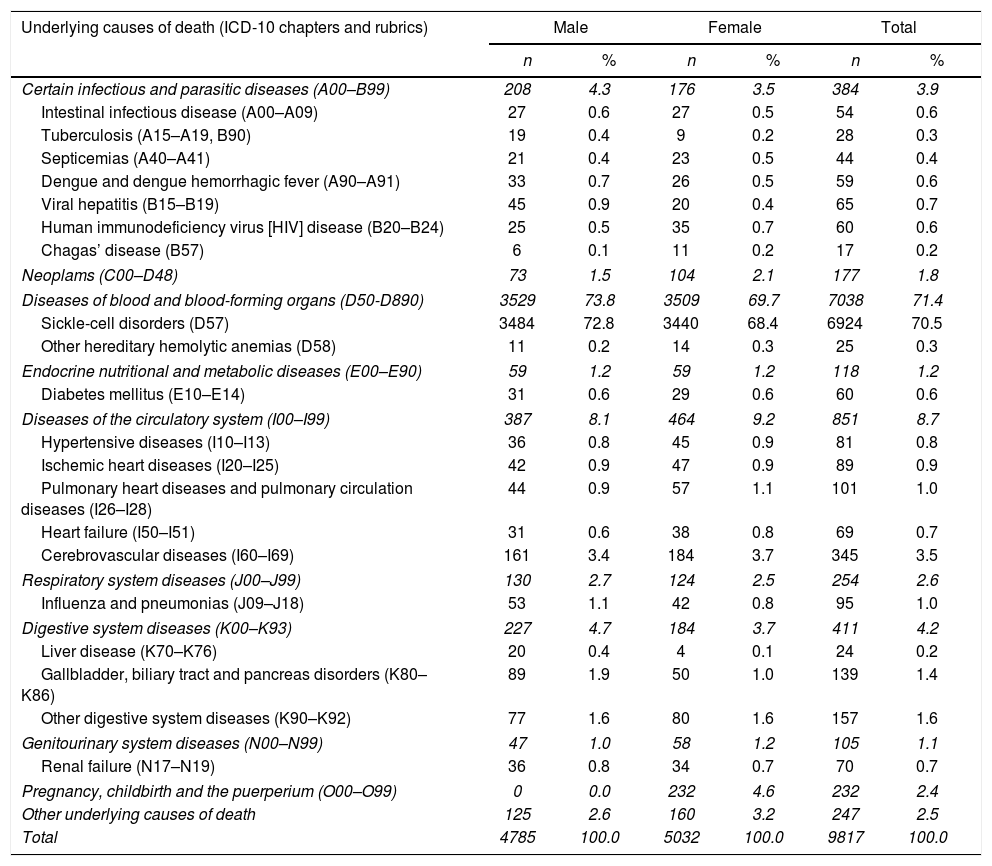
The underlying causes on 9817 death certificates for males and females in which SCD was listed as the cause of death are presented in Table 5, according to the ICD structure. The SCD accounts for 70.5% of the overall deaths. Other major underlying causes were included in the ICD chapter on circulatory system diseases, tallying 8.7% of deaths, followed, in males, by the digestive system, infectious diseases and respiratory system deaths, while in females, maternal deaths, included in the chapter on pregnancy, childbirth and the puerperium, accounting for 4.6% of female deaths, were succeeded by digestive system and infectious diseases.
Underlying causes of death on death certificates that listed sickle cell disease as cause of death in Brazil from 2000 to 2018.
| Underlying causes of death (ICD-10 chapters and rubrics) | Male | Female | Total | |||
|---|---|---|---|---|---|---|
| n | % | n | % | n | % | |
| Certain infectious and parasitic diseases (A00–B99) | 208 | 4.3 | 176 | 3.5 | 384 | 3.9 |
| Intestinal infectious disease (A00–A09) | 27 | 0.6 | 27 | 0.5 | 54 | 0.6 |
| Tuberculosis (A15–A19, B90) | 19 | 0.4 | 9 | 0.2 | 28 | 0.3 |
| Septicemias (A40–A41) | 21 | 0.4 | 23 | 0.5 | 44 | 0.4 |
| Dengue and dengue hemorrhagic fever (A90–A91) | 33 | 0.7 | 26 | 0.5 | 59 | 0.6 |
| Viral hepatitis (B15–B19) | 45 | 0.9 | 20 | 0.4 | 65 | 0.7 |
| Human immunodeficiency virus [HIV] disease (B20–B24) | 25 | 0.5 | 35 | 0.7 | 60 | 0.6 |
| Chagas’ disease (B57) | 6 | 0.1 | 11 | 0.2 | 17 | 0.2 |
| Neoplams (C00–D48) | 73 | 1.5 | 104 | 2.1 | 177 | 1.8 |
| Diseases of blood and blood-forming organs (D50-D890) | 3529 | 73.8 | 3509 | 69.7 | 7038 | 71.4 |
| Sickle-cell disorders (D57) | 3484 | 72.8 | 3440 | 68.4 | 6924 | 70.5 |
| Other hereditary hemolytic anemias (D58) | 11 | 0.2 | 14 | 0.3 | 25 | 0.3 |
| Endocrine nutritional and metabolic diseases (E00–E90) | 59 | 1.2 | 59 | 1.2 | 118 | 1.2 |
| Diabetes mellitus (E10–E14) | 31 | 0.6 | 29 | 0.6 | 60 | 0.6 |
| Diseases of the circulatory system (I00–I99) | 387 | 8.1 | 464 | 9.2 | 851 | 8.7 |
| Hypertensive diseases (I10–I13) | 36 | 0.8 | 45 | 0.9 | 81 | 0.8 |
| Ischemic heart diseases (I20–I25) | 42 | 0.9 | 47 | 0.9 | 89 | 0.9 |
| Pulmonary heart diseases and pulmonary circulation diseases (I26–I28) | 44 | 0.9 | 57 | 1.1 | 101 | 1.0 |
| Heart failure (I50–I51) | 31 | 0.6 | 38 | 0.8 | 69 | 0.7 |
| Cerebrovascular diseases (I60–I69) | 161 | 3.4 | 184 | 3.7 | 345 | 3.5 |
| Respiratory system diseases (J00–J99) | 130 | 2.7 | 124 | 2.5 | 254 | 2.6 |
| Influenza and pneumonias (J09–J18) | 53 | 1.1 | 42 | 0.8 | 95 | 1.0 |
| Digestive system diseases (K00–K93) | 227 | 4.7 | 184 | 3.7 | 411 | 4.2 |
| Liver disease (K70–K76) | 20 | 0.4 | 4 | 0.1 | 24 | 0.2 |
| Gallbladder, biliary tract and pancreas disorders (K80–K86) | 89 | 1.9 | 50 | 1.0 | 139 | 1.4 |
| Other digestive system diseases (K90–K92) | 77 | 1.6 | 80 | 1.6 | 157 | 1.6 |
| Genitourinary system diseases (N00–N99) | 47 | 1.0 | 58 | 1.2 | 105 | 1.1 |
| Renal failure (N17–N19) | 36 | 0.8 | 34 | 0.7 | 70 | 0.7 |
| Pregnancy, childbirth and the puerperium (O00–O99) | 0 | 0.0 | 232 | 4.6 | 232 | 2.4 |
| Other underlying causes of death | 125 | 2.6 | 160 | 3.2 | 247 | 2.5 |
| Total | 4785 | 100.0 | 5032 | 100.0 | 9817 | 100.0 |
Source: Ministry of Health, Unified Health System Information Technology Department.
Rubrics and codes of the International Statistical Classification of Diseases and Related Health Problems, Tenth Revision.
This study describes the mortality related to SCD in Brazil in the last 19 years, considering its mentions as cause of death on death certificates. Of course, the benefits of this approach refer to contemplate all death certificates in the whole country where SCB was listed and not only as the underlying cause of death. Furthermore, the mean numbers of 3.21 and 4.14 causes of death per death certificate for SCD underlying and other underlying causes, respectively, endorses the value of these data. However, since the paper by Alves (1979–1995),3 previous surveys revealed the underreporting of SCD as cause of death. In Minas Gerais, between 1998 and 2005, SCD was not identified as a cause of death in 35.9% (28/78) of deaths16 and between 1998 and 2012, the term “sickle cell” was not recorded in 46% of 193 death certificates, despite the reporting increase and awareness of the disease by physicians, acknowledged by the authors.17 In New York, from 2000 to 2009, among 21 deaths, 9 (42.9%) death certificates did not have SCD listed as a cause of death.18 By means of a multi-dimensional, population state-based surveillance system for SCD using diverse data sources, among 615 deaths in California and Georgia from 2004 to 2008, and among 275 deaths in California from 2011 to 2015, 263 (42.8%)19 and 115 (41.8%), respectively, did not have SCD listed as a cause of death.20
The finding that SCD was identified on average as the underlying cause of death in 70.5% of the certificates, a ratio higher than that observed in other countries, highlights the severity of this condition. The severity of SCD in children is further and better demonstrated, as this figure varies from 81.8% for those under 5 years of age (Table 1) to 47.2% for those aged between 80 and 84 (not shown). If the sickle cell patients live longer, it may become less probable to have SCD as a cause of death.21 A mortality study in France from 1979 to 2004, evaluating 670 overall deaths, reported SCD as the underlying cause in 397 (59.2%) of the certificates, as well as in 167 (68.7%) in 246 deaths among those between 0 and 18 years of age.22 In the United States, during the study period of 1979–2005, SCD was identified in sixty-five percent of 16,654 deaths as the underlying cause.21
The overall male and female median and mean ages at death in Brazil are lower than those in other developed countries. In the United States, from 1979 to 2005, among 16,654 deaths, the mean age at death for males was 33.4 years and for females, 36.9 years, while in 2005, the median age at death was 38 years for males and 42 years for females.21 From 2004 to 2008 in California and Georgia, among 615 deaths, the mean age at death was 43.4 years for females (median: 43.5 years) and 40.8 years for males (median: 41.9 years); the overall mean age at death was 42.2 years and median age of death 42.8 years.19 From 2004 to 2015 in California, among 543 deaths, the global mean and median ages at death were 44.2 and 45.7 years, respectively.20
Septicemia, pneumonia and respiratory failure occurred as the main associated (non-underlying) causes with overall deaths related to SCD as the underlying cause itself, as well as with additionals, a fact that indicates the severity of such an association. Septicemias generate septic shock and organ failure, while pneumonia is one of the main triggers for the acute chest syndrome. It should be noted that in mortality statistics, respiratory failure stands for acute chest syndrome as the cause of death, which does not carry a specific ICD code. The same problem arises with splenic sequestration, which along with the acute chest syndrome, was the object of a query of an international mortality coding group, however without response. In a study on deaths that occurred in a cohort of children diagnosed by the National Screening Program in Minas Gerais between 1998 and 2005, acute splenic sequestration was responsible for one third of the deaths, in contrast with the 14% identified on death certificates.16 Regarding septicemia and pneumonia, augmented vaccination schedules and routine penicillin prophylaxis must be emphasized. However, the study in Minas Gerais cited above found that the rate of special immunization was very low among fatal cases (only 40.4% of the children who died had been immunized).16,23 A study to evaluate the impact of the pneumococcal vaccine on mortality from pneumonia in children less than one year of age in Santa Catarina, Brazil, comparing the four years prior and the four years subsequent to the vaccine's introduction in 2010, observed an average mortality decrease of 11%.24 Three broader studies on childhood pneumonia mortality following the introduction of pneumococcal conjugate vaccines in Brazil and in Latin American and Caribbean countries verified modest, weak evidence, or no relevant changes of secular trends in Brazil.25–27 To the best of our knowledge, no papers were found on mortality related to the pneumococcal vaccine and sickle cell disease in Brazil.
Concern must be reserved for the 260 maternal-related deaths, respectively 232 as underlying and 28 as associated causes of death, the third major cause of death among women with SCB in Brazil, after SCD itself and diseases of the circulatory system. Due to progress in the control of SCD, most women now achieve the childbearing age. During the study period, 3339 deaths related to SCD of childbearing-aged women (10 through 49 years) occurred in Brazil. A similar observation was made for the period of 2010–2015, when 1311 such death occurred, 31% of which transpired during pregnancy, delivery and puerperium.7 Pregnancy is considered one of the foremost factors for deaths in women with SCD.28 Systematic reviews, meta-analyses and a study in Minas Gerais29 have disclosed an increased risk of maternal mortality, comparing women with SCD with women without SCD (relative risk for HbSS [RR] 5.98) and in women with non-specified SCD [RR] 18.51)28 and (poled Odds-Ratio 10.91).30
Population mortality statistics suffer from quantity and quality problems, while some specifics related to SCD were discussed in previous paragraphs. Estimations for 2017 indicate a coverage of 96.3% for the whole country, ranging from 92.7% in the northern region to 100.0% in the southern region. Regarding quality, recent evaluation of the establishment of multiple causes of death statistics in Brazil from 2003 to 2015 drove the crude mean number of causes per death certificate to increase from 2.81 to 3.02 (7.5%), deaths with only one mentioned cause to decrease from 20.32% to 13.75% and ill-defined causes of death due to an underlying cause to decrease from 12.95% to 5.59% (56.22%).31,32 Though automatic processing of mortality data is used in Brazil, causes of death are still established by trained nosologists who might make a mistake and introduce the wrong ICD code. This is more likely to occur at older ages, since SCD usually results in significant reduced life expectancy. Another question is linked with SCD as a rare cause of death, while decision tables for automatic processing may not include ICD mortality rules and dispositions involving all conditions of its natural history. Possibly some of the death certificates whose causes were listed in Table 5 might have given SCD as their proper underlying cause of death. And finally, it is most important to remember the responsibility of physicians to correctly identify causes of death on death certificates.
Conclusion In Brazil, from 2000 through 2018, SCD was identified as the underlying cause of death in 70.5% of the deaths, followed by circulatory system diseases (8.7%) and, among women, by maternal causes (4.6%). Septicemias, pneumonias and respiratory failure were the main overall associated causes of death. Underlying cause death rates increased from 2000 to 2009/2011, followed by a small decrease in males and a leveling in females, while associated-cause death rates displayed continuous increases. The mean and median ages at death were significantly lower for males and significantly lower for the number of deaths due to an underlying cause.
Conflicts of interestThe author declares no conflicts of interest.


