


Imatinib mesylate has revolutionized the treatment of chronic myeloid leukemia leading to significant reductions of BCR-ABL1 transcript levels in peripheral blood.
ObjectiveTo evaluate the response to imatinib mesylate treatment (400mg/day) in Brazilian patients in the chronic phase of chronic myeloid leukemia monitored by quantitative real time polymerase chain reaction.
MethodsBetween October 2002 and October 2010, 3169 peripheral blood samples were collected from 1403 patients from 3 to 5 months, 6 to 11 months, 12 to 17 months, 18 to 23 months and ≥24 months after beginning imatinib treatment. Eighty-two patients had samples available and analyzed for all time intervals. BCR-ABL1 quantification was performed by quantitative real time polymerase chain reaction using the ABL1 gene as the control. Results of the BCR-ABL1 ratio as a percentage were reported by the international scale (IS) using the laboratory conversion factor (0.51).
ResultsIn the first interval, 80.8% of patients achieved the optimal response (BCR-ABL1IS≤10%). In the second period, 69.1% achieved optimal response (BCR-ABL1IS≤1%) and, between 12 and 17 months, 47.3% achieved major molecular response (BCR-ABL1IS≤0.1%).
ConclusionsThe results of this retrospective study show that the response to imatinib treatment (400mg/day) of Brazilian patients in the chronic phase of chronic myeloid leukemia is within the expected profile when compared to patients reported in international prospective randomized studies.
The use of imatinib mesylate (IM), a first generation tyrosine kinase inhibitor, has revolutionized the treatment of chronic myeloid leukemia (CML) leading to a significant reduction of the breakpoint cluster region-Abelson murine leukemia 1 (BCR-ABL1) transcript levels in peripheral blood.1,2 The International randomized study of interferon vs. STI571 (IRIS) study showed that IM is able to reduce the amount of leukemic cells quickly and in large proportions in most patients with this disease.1–6 The intensity and speed of response to treatment are prognostic and treatment planning parameters. The hematological, cytogenetic and molecular responses, the latter based on the number of BCR-ABL1 transcripts in peripheral blood, are used to quantify the level of reduction of leukemic cells during therapy.5,6 By analyzing the IRIS study data, the European Leukemia Network (ELN) established response goals to be achieved in different intervals of drug exposure, particularly in the chronic phase of CML.5 Achieving major molecular response (MMR), defined as BCR-ABL1 transcripts ≤0.1%, is the goal of treatment with IM due to the association between this level of response and the higher likelihood of disease-free progression.7,8
The lack of data on the molecular response to treatment with IM in Brazilian patients and the availability of a large number of samples tested by quantitative real time polymerase chain reaction (Q-PCR) in the Immunogenetics Laboratory of Hospital de Clinicas, Universidade Federal do Paraná (HC-UFPR) motivated us to evaluate the results in this population to indirectly demonstrate the response of Brazilian patients to this drug in different time intervals after the beginning of therapy.
MethodsThe Immunogenetics Laboratory at HC-UFPR received samples from 26 Brazilian centers (23 public institutions) from October 2002 to October 2010. A total of 3169 samples were collected from 1403 patients from 3 to 5 months, 6 to 11 months, 12 to 17 months, 18 to 23 months and ≥24 months after the initiation of IM treatment. These samples were selected because they met the inclusion criteria for this study: Brazilian patients aged ≥18 years in the chronic phase of CML under treatment using IM (400mg/day) and being monitored by Q-PCR. Among the 1403 patients, only 82 had samples available for all time intervals. This study was approved by the Ethics Committee of HC-UFPR.
RNA stabilization and extractionSixteen to 20mL of peripheral blood collected in ethylenediaminetetraacetic acid (EDTA) was treated with red blood cell lysis buffer (0.144M of NH4Cl and 0.01M of NH4HCO3) within 24h of collection.9 For samples processed until September 2006, RNA from 1×10⁷ leukocytes was stabilized using GTC solution (4M guanidine thiocyanate, 5mM EDTA, 0.5% n-laurilsarcosil, 25mM sodium citrate, pH 7.0) with 7.1% β-mercaptoethanol and extracted with RNeasy Mini™ Kits (Qiagen, UK) according to the manufacturer's instructions.10,11 After September 2006, RNA from 1×10⁷ leukocytes was stabilized using Trizol® (Invitrogen, USA) and isolated with isopropanol, chloroform and ethanol according to the manufacturer's instructions. Complementary DNA was synthesized from total RNA using the enzyme, Moloney murine leukemia virus (M-MLV) reverse transcriptase (Invitrogen, USA) and randomized hexamer as previously described.11
Identification of the type of BCR-ABL1 transcriptThe type of BCR-ABL1 transcript was identified by multiplex polymerase chain reaction (PCR) as optimized by Cross et al.,10 except the ice bath was replaced for Platinum Taq DNA polymerase (Invitrogen, USA). The samples with negative results by multiplex PCR were amplified by nested PCR as previously described.11
Quantification of BCR-ABL1 transcriptsThe transcripts of all samples were quantified in duplicate by Q-PCR (ABIPRISM 7500, Life Technologies, USA) using the hydrolysis TaqMan™ probe system.12 The copy numbers of BCR-ABL1 and the control gene ABL1 were calculated by comparing the results with a standard curve based on serial dilutions of the linearized plasmid with the BCR-ABL1 insert (pNC210/G) engineered by Cross et al.13
Results are reported as a ratio (%) of the BCR-ABL1 to ABL1 copy numbers (BCR-ABL1/ABL1×100). The ratio was multiplied by the conversion factor (CF) to report values in the international scale (IS). The conversion factor of the Immunogenetics Laboratory at HC-UFPR is 0.51, which was determined by comparing the results of BCR-ABL1 transcript quantification in 30 samples analyzed in both the HC-UFPR laboratory and the reference laboratory at the Institute of Medical and Veterinary Science, Adelaide, Australia. The CF value was confirmed using a second set of 30 samples from the same reference laboratory. Samples were considered acceptable for analysis when the number of ABL1 copies was ≥10.000. Nested PCR was performed on all samples that had no transcripts detected by Q-PCR in order to confirm the results.
Statistical analysisDescriptive statistical analysis was performed for the general parameters of the sample: number of samples per patient, type of transcript, age at diagnosis and gender.
ResultsPatients’ demographics (n=1403) are detailed in Table 1. The age at diagnosis, gender, stage of disease, treatment and IM dose were obtained from the request form sent with the samples to the Immunogenetics Laboratory at HC-UFPR.
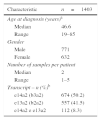
Demographics of Brazilian patients in the chronic phase of chronic myeloid leukemia under treatment with imatinib mesylate.
| Characteristic | n=1403 |
|---|---|
| Age at diagnosis (years)a | |
| Median | 46.6 |
| Range | 19–85 |
| Gender | |
| Male | 771 |
| Female | 632 |
| Number of samples per patient | |
| Median | 2 |
| Range | 1–5 |
| Transcript – n (%)b | |
| e14a2 (b3a2) | 674 (50.2) |
| e13a2 (b2a2) | 557 (41.5) |
| e14a2 e e13a2 | 112 (8.3) |
Data obtained from the analysis of 1382 patients. The birthdates of 21 patients were not informed on the requisition form sent with blood samples to the Hospital de Clinicas, Universidade Federal do Paraná (HC-UFPR) laboratory.
Data obtained from the analysis of 1343 patients. The transcript was not identified In 60 out of 1403 patients because they were in deep molecular response when their first sample was sent to the lab for monitoring yet they were included in the study because they had previous clinical diagnosis consistent with CML and were taking 400mg/day imatinib mesylate.
The number of samples per patient ranged from 1 to 5 (median=2). Samples were grouped into five time intervals close to those set by the ELN to assess response to IM treatment (Table 2); the responses of patients in each interval are shown in Table 3.
Number of samples distributed according to the time (months) from initiation of imatinib mesylate treatment.
| Time (months) | 3–5 | 6–11 | 12–17 | 18–23 | ≥24 |
| Samples na (%) | 339 (10.7) | 574 (18.1) | 628 (19.8) | 606 (19.1) | 1022 (32.2) |
Response of 1403 Brazilian patients in the chronic phase of chronic myeloid leukemia to imatinib mesylate treatment.
| BCR-ABLIS Transcripts – n(%) | Time (months) | ||||
|---|---|---|---|---|---|
| 3–5 | 6–11 | 12–17 | 18–23 | ≥24 | |
| ≥10% | 65 (19.2) | 63 (11) | 48 (7.7) | 39 (6.4) | 76 (7.4) |
| ≤10 to >1% | 97 (28.6) | 114 (19.9) | 92 (14.6) | 66 (10.9) | 115 (11.2) |
| ≤1 to >0.1% | 101 (29.8) | 177 (30.8) | 191 (30.4) | 151 (24.9) | 200 (19.6) |
| ≤0.1 | 76 (22.4) | 220 (38.3) | 297 (47.3) | 350 (57.8) | 631 (61.8) |
| n | 339 | 574 | 628 | 606 | 1022 |
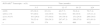
Among this cohort, only 82 patients had samples available and analyzed for every time interval established in this study; their response profile is shown in Figure 1. In the first time interval, 78.1% (64/82) of patients achieved levels of BCR-ABL1IS transcripts ≤10% and all of them reached this level of response in the last two time intervals. Between six and 11 months, 67% of patients (55/82) achieved BCR-ABL1IS transcripts ≤1%, and from 12 to 17 months 45.1% (37/82) had transcripts ≤0.1%.

The response to IM treatment in the larger cohort (1321 patients/2759 samples) who did not have samples available for all time intervals is shown in Figure 2. In the first interval, 81.7% (210/257) had BCR-ABL1IS transcripts ≤10% which increased to 92% (864/940) in the last interval. In the second time interval, 69.5% (342/492) of the patients achieved BCR-ABL1IS transcripts ≤1%, and between 12 and 17 months 47.7% (260/546) achieved results consistent with MMR (≤0.1%).
Discussion
This study showed the response to treatment using IM in a cohort of Brazilian patients in the chronic phase of CML. One of the difficulties was to establish time points to perform the analysis, due to the heterogeneity of sample collection dates that were not systematically planned. The time intervals in the present study were determined taking into consideration the times closest to those recommended by the ELN to monitor response to IM treatment.
The molecular response profile of patients with samples in all time intervals (n=82) showed in the first interval (three to five months) that 78.1% (64/82) had 1 log reduction in the number of BCR-ABL1IS transcripts; this is considered an optimal response to IM by the ELN.5 Hanfstein et al., in their prospective randomized study, found that after three months of IM treatment, 72% of patients had this level of response and observed that early reduction in the number of BCR-ABL1IS transcripts is a strong predictor of response throughout treatment.14 In this series, 53.7% (44/82) of patients had optimal responses and achieved transcript levels ≤1%, and 24.4% were in the range between 1% and 10% while Hanfstein et al. detected these levels of response in 31% and 41% of patients, respectively.14 MMR was achieved in 18.3% (15/82) of this patient sample compared to 15% found in the IRIS study at three months of treatment.4 A total of 12.2% (10/82) patients with MMR achieved a deep molecular response (DMR) with reductions of at least 4.5 logs,4,5 and of these, 1.2% (1/82) had no BCR-ABL1 transcripts detected either by Q-PCR or by nested PCR.
At six to 11 months from the beginning of IM treatment, 90.2% (74/82) of patients achieved 1 log reductions in the BCR-ABL1IS transcripts. According to the IRIS study, this level of response at six months is associated with better event-free survival and progression-free survival.3,4 In 67% (55/82) of the patients quantification of transcripts was ≤1%, considered an optimal response by the ELN.5 This result was similar to that found by Hanfstein et al. and by the seven years IRIS study update, where this level of response was observed in 63% and 67.8% of patients, respectively.4,14 In this time interval, 23.2% (19/82) had BCR-ABL1IS transcripts between 1% and 10%, thereby including them in the warning signs group, and 9.8% (8/82) remained with transcripts >10% denoting treatment failure according to the ELN.5 MMR occurred in 32.9% (27/82) of patients, similar to the 33.3% observed in the IRIS study at six months of treatment4; of these 18.3% (15/82) achieved DMR4,5 and 4.9% (4/82) had no BCR-ABL1 transcripts detected either by Q-PCR or by nested PCR.
Monitoring of BCR-ABL1IS transcripts between 12 and 17 months showed that 95.1% (78/82) of patients achieved reductions of at least 1 log and 76.8% (63/82) of at least 2 logs, and were similar to the IRIS study that found 91.8% and 79.9% of patients with these levels of responses, respectively.4 MMR was observed in 45.1% (37/82) of patients with a median of 14.2 months; these are considered optimal responders by the ELN.5 This result is close to the 50.3% found in the IRIS study update.4 De Lavallade et al., Silveira and Machado et al. found this level of response in 39.0%, 37.1% and 40% of patients, respectively.15–17 In the prospective and sequential study of de Lavallade et al., patients achieved MMR between two and 73 months (median: 15.7 months) after starting treatment.15 MMR was achieved with a median time of 18 months (6–78 months) according to Silveira, but his study included too few patients with molecular assessments (n=39).16 Machado et al. found this response level between 0.4 and 31 months of treatment (median: 8.5 months).17 In this time interval, 31.7% (26/82) were included in the warning signs group (BCR-ABL1IS >0.1 and ≤1%), and 23.2% (19/82) in the treatment failure group as the number of transcripts >1% according to the ELN criteria.5
In the interval between 18 and 23 months, all patients had at least 1 log and 87.8% (72/82) had at least 2 log reductions in BCR-ABL1IS transcripts. The IRIS study showed these levels of response in 93.7% and 83.8%, respectively.4 MMR was achieved by 63.4% (52/82) of patients. Hughes et al. found 64.8% of patients in MMR at 18 months of therapy.4
The evaluation of the period ≥24 months after initiation of IM treatment showed that MMR was achieved by 72% (59/82) of patients and DMR4,5 by 50% (41/82). It was observed that 28% (23/82) of patients who did not achieve MMR at 24 months were still under IM treatment. One possible cause is the difficulty for patients at distant centers to access specialized laboratories that perform quantification of BCR-ABL1 transcripts. Many were first monitored for BCR-ABL1 transcript levels only 18 months after the beginning of IM use. Other factors that may explain the unsatisfactory response are the misuse of the drug due to the side effects, the lack of adherence to treatment or even secondary drug resistance. Another reason to be considered in Brazil is the difficulty to access other treatment strategies, such as second-generation tyrosine kinase inhibitors and hematopoietic stem cell transplantation.
Variations in responses to IM treatment between this and other studies may reflect differences in the methods utilized. While the IRIS study was prospective, randomized and included patients recently diagnosed who received IM as first-line treatment, this study is retrospective and with no information available about previous therapies or the time between diagnosis and beginning of treatment. Bendit et al. showed that the number of Brazilian patients achieving MMR was significantly higher when IM was the first-line treatment compared to those who received IFN-α associated with ARA-C prior to IM.18 Scerni et al. found that the probability of achieving MMR was significantly higher (60%) in Brazilian patients who received IM within one year of diagnosis than in those who started treatment more than one year after diagnosis (40%).19
The molecular response of the 82 patients with samples analyzed in all time intervals was in agreement with the response of the 1321 patients who did not have sequential evaluations until the interval of 12–17 months. However, the responses to IM were better in the first group in the interval from 18 to 23 months and in the period ≥24 months. In this group, all patients achieved a reduction of 1 log from 18 months on. Yet, in the second group, this did not occur possibly because many patients had the first molecular testing performed only after 18 months of IM use. This data corroborates the importance of sequential monitoring, every three or six months, so that therapeutic interventions can take place early when the patient does not have an adequate response to the drug.
Data from this retrospective study give an overview of the molecular response in Brazilian patients with chronic phase CML being treated with IM (400mg/day), although this patient sample does not homogeneously represent the population of Brazilian patients with this disease. This can be because not all patients under IM treatment have the opportunity to be monitored for BCR-ABL1 transcripts as they live long distances from specialized molecular biology laboratories or because of financial limitations in the centers where they are treated.
The observation that sequential monitoring of patients is essential for proper clinical management emphasizes the importance of including this kind of laboratory test in the list of tests provided by the Brazilian National Health System. Furthermore, quantification of BCR-ABL1 transcripts at different time points in patients under IM treatment should be a requirement by regulatory agencies of both public and private healthcare systems. These measures will ensure that all CML patients receive proper monitoring of their response to IM, and the possibility of receiving other therapeutic strategies in a timely manner whenever appropriate.
In conclusion, the results of this retrospective study showed that the response of Brazilian patients in the chronic phase of CML, treated with IM (400mg/day) is close to that expected from patients reported in prospective and randomized international studies.
Conflict of interestThe authors declare no conflicts of interest.
To Dr. Nicholas Cross and Dr. Jaspal Kaeda our special thanks for generously providing the plasmids with the inserts of the BCR-ABL1 rearrangements, and technical training to our personnel making the implementation of the methods for BCR-ABL1 transcript quantification feasible in the Immunogenetics Laboratory at HC-UFPR in 2000.


