
Red blood cell genes are highly polymorphic with the distribution of alleles varying between different populations and ethnic groups. The objective of this study was to investigate gene polymorphisms of blood groups in the state of Santa Catarina, Southern Brazil.
MethodsThree hundred and seventy-three unrelated blood donors and 31 transfusion-dependent patients were evaluated to investigate polymorphisms of the Rh, Kell, Duffy, Kidd, and Diego blood group systems in a population from the state of Santa Catarina. The subjects, from seven regions that comprise the blood-banking network of the state, were assessed between August 2011 and March 2014. The genotypes of the Rh, Kell, Duffy, Kidd, and Diego systems were determined using the restriction fragment length polymorphism-polymerase chain reaction and allele-specific polymerase chain reaction techniques.
ResultsThe genotype frequencies in this study were significantly different when populations from different regions of Santa Catarina were compared. Furthermore, there were also significant differences in the genetic frequencies compared to other Brazilian states. The genotype frequencies of the Kell and Kidd blood groups are similar to European populations from Naples, Italy and Zurich, Switzerland.
ConclusionThis article reports for the first time the frequency of polymorphisms of blood group systems in blood donors from Santa Catarina, Southern Brazil.
According to the International Society of Blood Transfusion (ISBT), there are about 340 antigens, 308 of which are clustered into 36 blood group systems.1,2 For genotyping purposes, the causative polymorphism of red cell antigens are studied at the molecular level.3 Knowing the molecular basis of these genes is important to develop molecular biology methods, identify new mutations, understand polymorphisms, and discover new alleles and new systems.4,5
Red blood cell (RBC) genes are highly polymorphic. Typing of RBC polymorphisms at the DNA level is important in transfusion medicine to create an inventory of donor units suitable for patients with rare phenotypes and to select appropriate blood units for multi-transfused patients.6,7 Furthermore, it is useful to identify donors for the preparation of reagents in RBC panels used to detect or identify antibodies.8 Additionally, knowing the RBC polymorphisms of repeat blood donors can contribute to the understanding of the distribution of these polymorphisms in a population.
Molecular methods are applied in some countries to identify blood groups.8–13 Furthermore, there are well-established blood group genotyping protocols validated for the Brazilian population (e.g. Paraná State in Southern Brazil).14–17 However, due to the ethnic diversity in the country, blood group polymorphisms should be investigated in the different regions of Brazil. For instance, no study has been published to date on the population of the state of Santa Catarina, Southern Brazil. Hence, the purpose of this study was to evaluate the frequencies of polymorphisms of clinically important blood group systems [Rh, Kell (KEL), Duffy (FY), Kidd (JK), and Diego (Di)] in a population from Santa Catarina.
MethodsDonor samplesThree hundred and seventy-three blood donors were randomly selected from the Hemocentro de Santa Catarina (HEMOSC) between August 2011 and March 2014. All subjects provided written consent before participating in this study. This study was carried out in accordance with the standards recommended by the Ethics Committee on Human Research of the Universidade Federal de Santa Catarina (UFSC).
The population studied was selected from seven different regions of the state of Santa Catarina and was a representative sample of the state's blood-banking network.
Patient samplesThirty-one samples from the pool of transfusion-dependent patients were analyzed. The patients were split into sickle cell disease (SCD – n=11), myelodysplastic syndrome (n=5), leukemia (n=5), β-thalassemia major (n=3), and anemia (n=7). All patients had received at least three transfusions in the previous three months. Every patient provided written consent.
Molecular typingGenomic DNA extractionTo obtain the DNA, 5mL of peripheral blood were collected in tubes containing ethylenediaminetetraacetic acid (EDTA) and centrifuged (2500rpm for 10min) to obtain the Buffy coat. The DNA was extracted using QIAamp DNA Blood Mini Kit (Qiagen®, Chatsworth, CA, USA) following the manufacturer's instructions.
RHD, RHCE, Kell, Duffy, Kidd, and Diego genotypingPrimers and amplification conditions have been described previously.18,19 RHCE*C/c and RHD genotyping was performed by multiplex assay,20 and the RHD*pseudogene (RHD*ψ, RHD*04N.01) was detected using allele-specific polymerase chain reaction.21 RHCE*E/e, KEL*01.1/KEL*02, FY*01/FY*02, FY*02N.01 (GATA-1 mutation), JK*01/JK*02 (SLC14A1 gene), and DI*01/DI*02 genotyping was performed using the restriction fragment length polymorphism-polymerase chain reaction (RFLP-PCR) technique according to protocols previously described in the literature22–24 with some modifications. The PCR used 200ng of DNA, 50pmol of each primer, 2nmol of each dNTP, 1.0U of Taq DNA polymerase (Invitrogen Life Technologies®, Grand Island, NY, USA), and buffer to make up a final volume of 50μL. The amplification cycles were performed in a Mastercycler® Personal Thermal Cycler (Eppendorf, Hamburg, Germany) and consisted of denaturation at 95°C for 15min and 35 cycles of 20s at 94°C, 20s at 62°C, and 20s at 72°C, followed by an extension step of 10min at 72°C. The products obtained RHCE*E/e, KEL*01.1/KEL*02, FY*01/FY*02, FY*02N.01 (GATA-1 mutation), JK*01/JK*02 (SLC14A1 gene), and DI*01/DI*02 PCR were digested overnight with their respective restriction enzymes (New England Biolabs Beverly, MA, USA): Bsm I, Ban I, Sty I, Mnl I, and Msp I, in final volumes of 20μL, using 10μL of PCR product and 10μL of the enzyme/buffer mixture, following the manufacturer's instructions. Analyses of mutations in the GATA-1 gene and in the other alleles [RHCE*E/e, KEL*01.1/KEL*02, FY*01/FY*02, JK*01/JK*02 (SLC14A1 gene), and DI*01/DI*02] were performed after electrophoresis in 10% polyacrylamide gel stained with GelRed™ (Biotium Inc., Hayward, CA, USA).
Statistical analysisGenotypic frequencies observed were compared with the frequencies expected by the Hardy–Weinberg equilibrium using the chi-square test. A comparison of genotypic and allelic frequencies was achieved by the chi-square test with Yate's correction using the Openepi software or, where appropriate, Fisher's exact test with a 2×2 contingency table using the Simple Interactive Statistical Analysis (SISA) software.24 A p-value<0.05 was considered significant.
ResultsThree hundred and seventy-three unrelated healthy O blood group donors from the seven different regions that make up the blood-banking network in the state of Santa Catarina were selected for this study. Of all donors, 105 (28.2%) were from Florianópolis, 47 (12.6%) were from Blumenau, 55 (14.7%) were from Lages, 36 (9.7%) were from Chapecó, 58 (15.5%) were from Criciúma, 33 (8.8%) were from Joaçaba, and 39 (10.5%) were from Joinville.
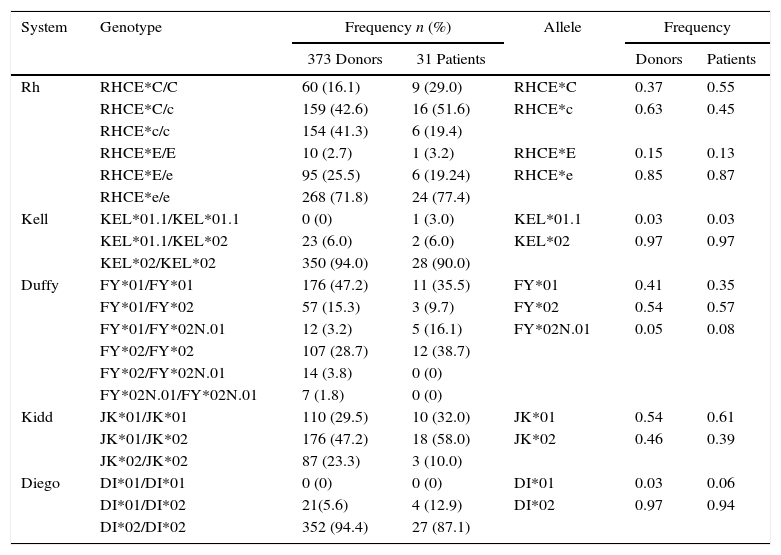
The clinically important genotype and allele frequencies of the RH, KEL, FY, JK, and Di blood group systems of the population are shown in Table 1. The population was found to be in Hardy–Weinberg equilibrium for all the analyzed genes.
Genotype and allele frequencies for Rh, Kell. Duffy, Kidd and Diego systems observed in a population of 373 voluntary blood donors and 31 patients from southern Brazil.
| System | Genotype | Frequency n (%) | Allele | Frequency | ||
|---|---|---|---|---|---|---|
| 373 Donors | 31 Patients | Donors | Patients | |||
| Rh | RHCE*C/C | 60 (16.1) | 9 (29.0) | RHCE*C | 0.37 | 0.55 |
| RHCE*C/c | 159 (42.6) | 16 (51.6) | RHCE*c | 0.63 | 0.45 | |
| RHCE*c/c | 154 (41.3) | 6 (19.4) | ||||
| RHCE*E/E | 10 (2.7) | 1 (3.2) | RHCE*E | 0.15 | 0.13 | |
| RHCE*E/e | 95 (25.5) | 6 (19.24) | RHCE*e | 0.85 | 0.87 | |
| RHCE*e/e | 268 (71.8) | 24 (77.4) | ||||
| Kell | KEL*01.1/KEL*01.1 | 0 (0) | 1 (3.0) | KEL*01.1 | 0.03 | 0.03 |
| KEL*01.1/KEL*02 | 23 (6.0) | 2 (6.0) | KEL*02 | 0.97 | 0.97 | |
| KEL*02/KEL*02 | 350 (94.0) | 28 (90.0) | ||||
| Duffy | FY*01/FY*01 | 176 (47.2) | 11 (35.5) | FY*01 | 0.41 | 0.35 |
| FY*01/FY*02 | 57 (15.3) | 3 (9.7) | FY*02 | 0.54 | 0.57 | |
| FY*01/FY*02N.01 | 12 (3.2) | 5 (16.1) | FY*02N.01 | 0.05 | 0.08 | |
| FY*02/FY*02 | 107 (28.7) | 12 (38.7) | ||||
| FY*02/FY*02N.01 | 14 (3.8) | 0 (0) | ||||
| FY*02N.01/FY*02N.01 | 7 (1.8) | 0 (0) | ||||
| Kidd | JK*01/JK*01 | 110 (29.5) | 10 (32.0) | JK*01 | 0.54 | 0.61 |
| JK*01/JK*02 | 176 (47.2) | 18 (58.0) | JK*02 | 0.46 | 0.39 | |
| JK*02/JK*02 | 87 (23.3) | 3 (10.0) | ||||
| Diego | DI*01/DI*01 | 0 (0) | 0 (0) | DI*01 | 0.03 | 0.06 |
| DI*01/DI*02 | 21(5.6) | 4 (12.9) | DI*02 | 0.97 | 0.94 | |
| DI*02/DI*02 | 352 (94.4) | 27 (87.1) | ||||
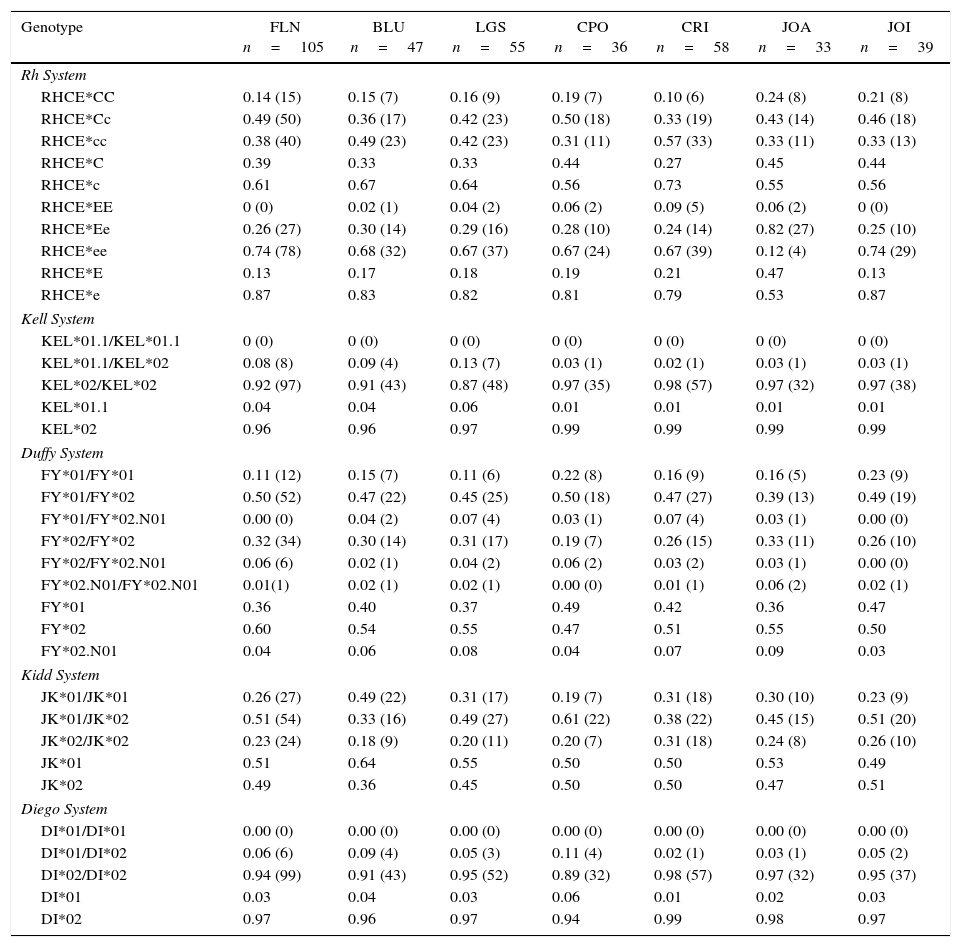
Table 2 shows the analysis of the genotype and allele frequencies of blood donors from the seven regions of Santa Catarina.
Genotype frequencies and alleles for the Rh, Kell, Duffy, Kidd and Diego systems in voluntary blood donors from seven regions of the state of Santa Catarina.
| Genotype | FLN n=105 | BLU n=47 | LGS n=55 | CPO n=36 | CRI n=58 | JOA n=33 | JOI n=39 |
|---|---|---|---|---|---|---|---|
| Rh System | |||||||
| RHCE*CC | 0.14 (15) | 0.15 (7) | 0.16 (9) | 0.19 (7) | 0.10 (6) | 0.24 (8) | 0.21 (8) |
| RHCE*Cc | 0.49 (50) | 0.36 (17) | 0.42 (23) | 0.50 (18) | 0.33 (19) | 0.43 (14) | 0.46 (18) |
| RHCE*cc | 0.38 (40) | 0.49 (23) | 0.42 (23) | 0.31 (11) | 0.57 (33) | 0.33 (11) | 0.33 (13) |
| RHCE*C | 0.39 | 0.33 | 0.33 | 0.44 | 0.27 | 0.45 | 0.44 |
| RHCE*c | 0.61 | 0.67 | 0.64 | 0.56 | 0.73 | 0.55 | 0.56 |
| RHCE*EE | 0 (0) | 0.02 (1) | 0.04 (2) | 0.06 (2) | 0.09 (5) | 0.06 (2) | 0 (0) |
| RHCE*Ee | 0.26 (27) | 0.30 (14) | 0.29 (16) | 0.28 (10) | 0.24 (14) | 0.82 (27) | 0.25 (10) |
| RHCE*ee | 0.74 (78) | 0.68 (32) | 0.67 (37) | 0.67 (24) | 0.67 (39) | 0.12 (4) | 0.74 (29) |
| RHCE*E | 0.13 | 0.17 | 0.18 | 0.19 | 0.21 | 0.47 | 0.13 |
| RHCE*e | 0.87 | 0.83 | 0.82 | 0.81 | 0.79 | 0.53 | 0.87 |
| Kell System | |||||||
| KEL*01.1/KEL*01.1 | 0 (0) | 0 (0) | 0 (0) | 0 (0) | 0 (0) | 0 (0) | 0 (0) |
| KEL*01.1/KEL*02 | 0.08 (8) | 0.09 (4) | 0.13 (7) | 0.03 (1) | 0.02 (1) | 0.03 (1) | 0.03 (1) |
| KEL*02/KEL*02 | 0.92 (97) | 0.91 (43) | 0.87 (48) | 0.97 (35) | 0.98 (57) | 0.97 (32) | 0.97 (38) |
| KEL*01.1 | 0.04 | 0.04 | 0.06 | 0.01 | 0.01 | 0.01 | 0.01 |
| KEL*02 | 0.96 | 0.96 | 0.97 | 0.99 | 0.99 | 0.99 | 0.99 |
| Duffy System | |||||||
| FY*01/FY*01 | 0.11 (12) | 0.15 (7) | 0.11 (6) | 0.22 (8) | 0.16 (9) | 0.16 (5) | 0.23 (9) |
| FY*01/FY*02 | 0.50 (52) | 0.47 (22) | 0.45 (25) | 0.50 (18) | 0.47 (27) | 0.39 (13) | 0.49 (19) |
| FY*01/FY*02.N01 | 0.00 (0) | 0.04 (2) | 0.07 (4) | 0.03 (1) | 0.07 (4) | 0.03 (1) | 0.00 (0) |
| FY*02/FY*02 | 0.32 (34) | 0.30 (14) | 0.31 (17) | 0.19 (7) | 0.26 (15) | 0.33 (11) | 0.26 (10) |
| FY*02/FY*02.N01 | 0.06 (6) | 0.02 (1) | 0.04 (2) | 0.06 (2) | 0.03 (2) | 0.03 (1) | 0.00 (0) |
| FY*02.N01/FY*02.N01 | 0.01(1) | 0.02 (1) | 0.02 (1) | 0.00 (0) | 0.01 (1) | 0.06 (2) | 0.02 (1) |
| FY*01 | 0.36 | 0.40 | 0.37 | 0.49 | 0.42 | 0.36 | 0.47 |
| FY*02 | 0.60 | 0.54 | 0.55 | 0.47 | 0.51 | 0.55 | 0.50 |
| FY*02.N01 | 0.04 | 0.06 | 0.08 | 0.04 | 0.07 | 0.09 | 0.03 |
| Kidd System | |||||||
| JK*01/JK*01 | 0.26 (27) | 0.49 (22) | 0.31 (17) | 0.19 (7) | 0.31 (18) | 0.30 (10) | 0.23 (9) |
| JK*01/JK*02 | 0.51 (54) | 0.33 (16) | 0.49 (27) | 0.61 (22) | 0.38 (22) | 0.45 (15) | 0.51 (20) |
| JK*02/JK*02 | 0.23 (24) | 0.18 (9) | 0.20 (11) | 0.20 (7) | 0.31 (18) | 0.24 (8) | 0.26 (10) |
| JK*01 | 0.51 | 0.64 | 0.55 | 0.50 | 0.50 | 0.53 | 0.49 |
| JK*02 | 0.49 | 0.36 | 0.45 | 0.50 | 0.50 | 0.47 | 0.51 |
| Diego System | |||||||
| DI*01/DI*01 | 0.00 (0) | 0.00 (0) | 0.00 (0) | 0.00 (0) | 0.00 (0) | 0.00 (0) | 0.00 (0) |
| DI*01/DI*02 | 0.06 (6) | 0.09 (4) | 0.05 (3) | 0.11 (4) | 0.02 (1) | 0.03 (1) | 0.05 (2) |
| DI*02/DI*02 | 0.94 (99) | 0.91 (43) | 0.95 (52) | 0.89 (32) | 0.98 (57) | 0.97 (32) | 0.95 (37) |
| DI*01 | 0.03 | 0.04 | 0.03 | 0.06 | 0.01 | 0.02 | 0.03 |
| DI*02 | 0.97 | 0.96 | 0.97 | 0.94 | 0.99 | 0.98 | 0.97 |
FLN: Florianópolis; BLU: Blumenau; LGS: Lages; CPO: Chapecó; CRI: Criciúma; JOA: Joaçaba; JOIN: Joinville.
Figures shown as n (%); *p-value<0.05.
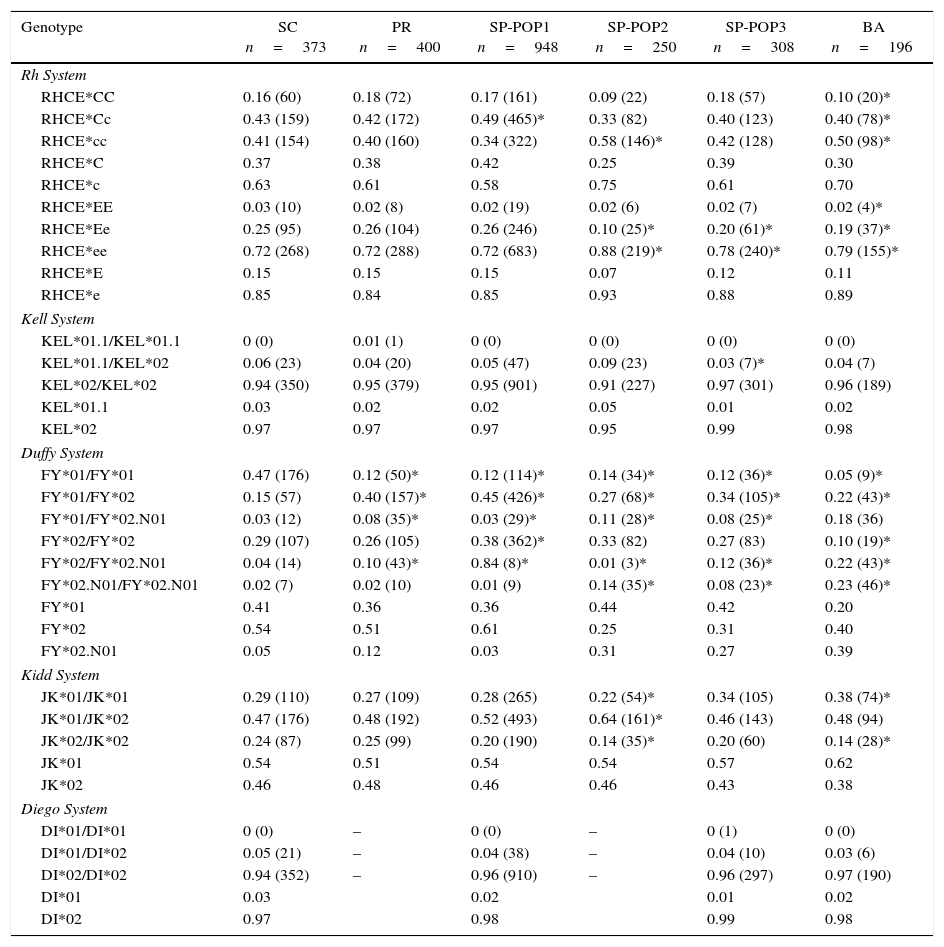
The frequencies were compared with other Brazilian and European populations (Tables 3 and 4, respectively).
Genotype and allele frequencies of Santa Catarina compared with other states of Brazil.
| Genotype | SC n=373 | PR n=400 | SP-POP1 n=948 | SP-POP2 n=250 | SP-POP3 n=308 | BA n=196 |
|---|---|---|---|---|---|---|
| Rh System | ||||||
| RHCE*CC | 0.16 (60) | 0.18 (72) | 0.17 (161) | 0.09 (22) | 0.18 (57) | 0.10 (20)* |
| RHCE*Cc | 0.43 (159) | 0.42 (172) | 0.49 (465)* | 0.33 (82) | 0.40 (123) | 0.40 (78)* |
| RHCE*cc | 0.41 (154) | 0.40 (160) | 0.34 (322) | 0.58 (146)* | 0.42 (128) | 0.50 (98)* |
| RHCE*C | 0.37 | 0.38 | 0.42 | 0.25 | 0.39 | 0.30 |
| RHCE*c | 0.63 | 0.61 | 0.58 | 0.75 | 0.61 | 0.70 |
| RHCE*EE | 0.03 (10) | 0.02 (8) | 0.02 (19) | 0.02 (6) | 0.02 (7) | 0.02 (4)* |
| RHCE*Ee | 0.25 (95) | 0.26 (104) | 0.26 (246) | 0.10 (25)* | 0.20 (61)* | 0.19 (37)* |
| RHCE*ee | 0.72 (268) | 0.72 (288) | 0.72 (683) | 0.88 (219)* | 0.78 (240)* | 0.79 (155)* |
| RHCE*E | 0.15 | 0.15 | 0.15 | 0.07 | 0.12 | 0.11 |
| RHCE*e | 0.85 | 0.84 | 0.85 | 0.93 | 0.88 | 0.89 |
| Kell System | ||||||
| KEL*01.1/KEL*01.1 | 0 (0) | 0.01 (1) | 0 (0) | 0 (0) | 0 (0) | 0 (0) |
| KEL*01.1/KEL*02 | 0.06 (23) | 0.04 (20) | 0.05 (47) | 0.09 (23) | 0.03 (7)* | 0.04 (7) |
| KEL*02/KEL*02 | 0.94 (350) | 0.95 (379) | 0.95 (901) | 0.91 (227) | 0.97 (301) | 0.96 (189) |
| KEL*01.1 | 0.03 | 0.02 | 0.02 | 0.05 | 0.01 | 0.02 |
| KEL*02 | 0.97 | 0.97 | 0.97 | 0.95 | 0.99 | 0.98 |
| Duffy System | ||||||
| FY*01/FY*01 | 0.47 (176) | 0.12 (50)* | 0.12 (114)* | 0.14 (34)* | 0.12 (36)* | 0.05 (9)* |
| FY*01/FY*02 | 0.15 (57) | 0.40 (157)* | 0.45 (426)* | 0.27 (68)* | 0.34 (105)* | 0.22 (43)* |
| FY*01/FY*02.N01 | 0.03 (12) | 0.08 (35)* | 0.03 (29)* | 0.11 (28)* | 0.08 (25)* | 0.18 (36) |
| FY*02/FY*02 | 0.29 (107) | 0.26 (105) | 0.38 (362)* | 0.33 (82) | 0.27 (83) | 0.10 (19)* |
| FY*02/FY*02.N01 | 0.04 (14) | 0.10 (43)* | 0.84 (8)* | 0.01 (3)* | 0.12 (36)* | 0.22 (43)* |
| FY*02.N01/FY*02.N01 | 0.02 (7) | 0.02 (10) | 0.01 (9) | 0.14 (35)* | 0.08 (23)* | 0.23 (46)* |
| FY*01 | 0.41 | 0.36 | 0.36 | 0.44 | 0.42 | 0.20 |
| FY*02 | 0.54 | 0.51 | 0.61 | 0.25 | 0.31 | 0.40 |
| FY*02.N01 | 0.05 | 0.12 | 0.03 | 0.31 | 0.27 | 0.39 |
| Kidd System | ||||||
| JK*01/JK*01 | 0.29 (110) | 0.27 (109) | 0.28 (265) | 0.22 (54)* | 0.34 (105) | 0.38 (74)* |
| JK*01/JK*02 | 0.47 (176) | 0.48 (192) | 0.52 (493) | 0.64 (161)* | 0.46 (143) | 0.48 (94) |
| JK*02/JK*02 | 0.24 (87) | 0.25 (99) | 0.20 (190) | 0.14 (35)* | 0.20 (60) | 0.14 (28)* |
| JK*01 | 0.54 | 0.51 | 0.54 | 0.54 | 0.57 | 0.62 |
| JK*02 | 0.46 | 0.48 | 0.46 | 0.46 | 0.43 | 0.38 |
| Diego System | ||||||
| DI*01/DI*01 | 0 (0) | – | 0 (0) | – | 0 (1) | 0 (0) |
| DI*01/DI*02 | 0.05 (21) | – | 0.04 (38) | – | 0.04 (10) | 0.03 (6) |
| DI*02/DI*02 | 0.94 (352) | – | 0.96 (910) | – | 0.96 (297) | 0.97 (190) |
| DI*01 | 0.03 | 0.02 | 0.01 | 0.02 | ||
| DI*02 | 0.97 | 0.98 | 0.99 | 0.98 | ||
SC: population from state of Santa Catarina, Southern Brazil (reference).
PR: Mixed Brazilian population from state of Parana, Southern Brazil.25
SP (POP1, POP2 and POP3): Mixed population from the state of São Paulo, southeastern Brazil14,17 and unpublished data.
BA: Mixed population from state of Bahia, northeastern Brazil – unpublished data.
Figures shown as n (%) *p-value<0.05.
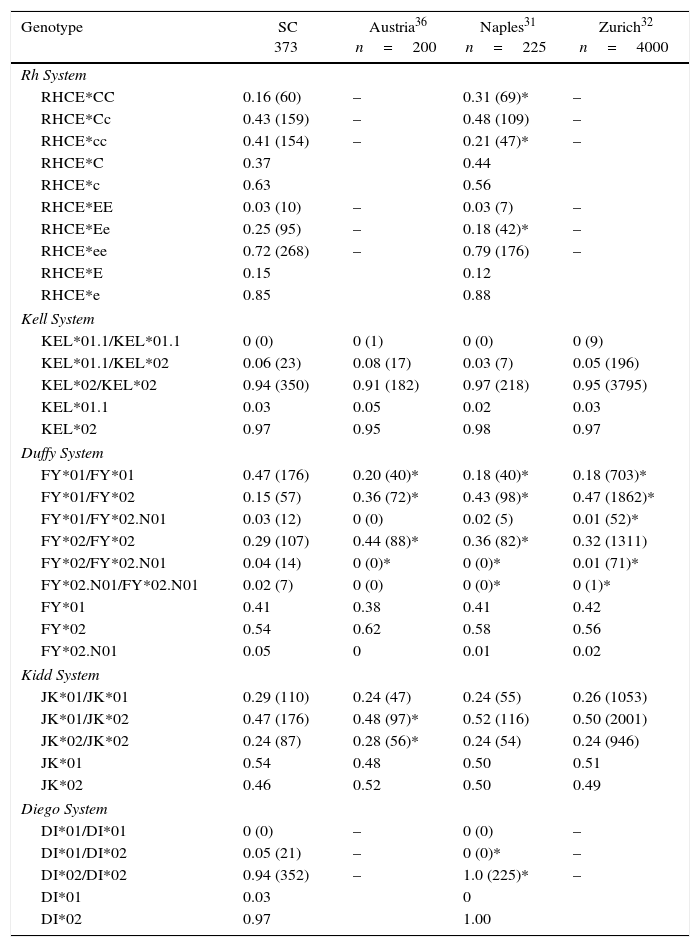
Genotype and allele frequencies of southern Brazil compared with European populations.
| Genotype | SC 373 | Austria36 n=200 | Naples31 n=225 | Zurich32 n=4000 |
|---|---|---|---|---|
| Rh System | ||||
| RHCE*CC | 0.16 (60) | – | 0.31 (69)* | – |
| RHCE*Cc | 0.43 (159) | – | 0.48 (109) | – |
| RHCE*cc | 0.41 (154) | – | 0.21 (47)* | – |
| RHCE*C | 0.37 | 0.44 | ||
| RHCE*c | 0.63 | 0.56 | ||
| RHCE*EE | 0.03 (10) | – | 0.03 (7) | – |
| RHCE*Ee | 0.25 (95) | – | 0.18 (42)* | – |
| RHCE*ee | 0.72 (268) | – | 0.79 (176) | – |
| RHCE*E | 0.15 | 0.12 | ||
| RHCE*e | 0.85 | 0.88 | ||
| Kell System | ||||
| KEL*01.1/KEL*01.1 | 0 (0) | 0 (1) | 0 (0) | 0 (9) |
| KEL*01.1/KEL*02 | 0.06 (23) | 0.08 (17) | 0.03 (7) | 0.05 (196) |
| KEL*02/KEL*02 | 0.94 (350) | 0.91 (182) | 0.97 (218) | 0.95 (3795) |
| KEL*01.1 | 0.03 | 0.05 | 0.02 | 0.03 |
| KEL*02 | 0.97 | 0.95 | 0.98 | 0.97 |
| Duffy System | ||||
| FY*01/FY*01 | 0.47 (176) | 0.20 (40)* | 0.18 (40)* | 0.18 (703)* |
| FY*01/FY*02 | 0.15 (57) | 0.36 (72)* | 0.43 (98)* | 0.47 (1862)* |
| FY*01/FY*02.N01 | 0.03 (12) | 0 (0) | 0.02 (5) | 0.01 (52)* |
| FY*02/FY*02 | 0.29 (107) | 0.44 (88)* | 0.36 (82)* | 0.32 (1311) |
| FY*02/FY*02.N01 | 0.04 (14) | 0 (0)* | 0 (0)* | 0.01 (71)* |
| FY*02.N01/FY*02.N01 | 0.02 (7) | 0 (0) | 0 (0)* | 0 (1)* |
| FY*01 | 0.41 | 0.38 | 0.41 | 0.42 |
| FY*02 | 0.54 | 0.62 | 0.58 | 0.56 |
| FY*02.N01 | 0.05 | 0 | 0.01 | 0.02 |
| Kidd System | ||||
| JK*01/JK*01 | 0.29 (110) | 0.24 (47) | 0.24 (55) | 0.26 (1053) |
| JK*01/JK*02 | 0.47 (176) | 0.48 (97)* | 0.52 (116) | 0.50 (2001) |
| JK*02/JK*02 | 0.24 (87) | 0.28 (56)* | 0.24 (54) | 0.24 (946) |
| JK*01 | 0.54 | 0.48 | 0.50 | 0.51 |
| JK*02 | 0.46 | 0.52 | 0.50 | 0.49 |
| Diego System | ||||
| DI*01/DI*01 | 0 (0) | – | 0 (0) | – |
| DI*01/DI*02 | 0.05 (21) | – | 0 (0)* | – |
| DI*02/DI*02 | 0.94 (352) | – | 1.0 (225)* | – |
| DI*01 | 0.03 | 0 | ||
| DI*02 | 0.97 | 1.00 | ||
Figures shown as n (%).
Statistical differences were observed on comparing these results with other Brazilian populations. The genotypes RHCE*Ee, KEL*01.1/KEL*02, FY*01/FY*01, JK*01/JK*01, and JK*02/02 were more prevalent in the population from the state of Santa Catarina compared to the state of São Paulo. In addition, the RHCE*Cc, RHCE*cc, RHCE*ee, FY*01/FY*02, FY*01/FY*02.N01, FY*02/FY*02, FY*02/FY*02.N01, FY*02.N01/FY*02.N01, and JK*01/JK*02 genotypes were more common in the population from the state of São Paulo.
When the data were compared with the state of Bahia, only the frequencies of the KEL and Di systems did not differ and a difference was observed only for the FY system in respect to the state of Paraná.
When the data were compared with European populations, only the RHCE*Cc, RHCE*EE, RHCE*ee, KEL*01.1/KEL*01.1, KEL*01.1/KEL*02, KEL*02/KEL*02 JK*01/JK*01, and DI*01/DI*01 genotypes did not differ statistically (Table 4).
A significant difference was also observed among the regions of Santa Catarina as is shown in Table 2.
DiscussionKnowing RBC polymorphisms in a population is important and has been of interest mainly in the fields of transfusion medicine and anthropology. Several studies have been conducted with the aim of knowing the genotype frequencies in various populations from different countries, including Brazil.
The state of Santa Catarina is located in the southern region of Brazil and, according to the Brazilian census department (Instituto Brasileiro de Geografia e Estatística – IBGE), the state has 6,634,254 inhabitants, about 3.3% of the Brazilian population.25 According to Manta et al.,26 the population of the state of Santa Catarina is predominantly of European origin (79.7%), with a contribution of Africans (11.4%) and Amerindians (8.9%).
Statistical differences were observed on comparing the population from Santa Catarina with populations from other states in Brazil (Table 3). Santa Catarina and Paraná17 had similar results for the Rh, KEL, JK, and Di blood group systems with differences only for the FY system, which shows that these two populations are genetically similar probably due to a similar miscegenation pattern. However, the difference observed for the FY system shows that, despite this similarity, they may have greater influences by different ethnic groups.
Differences were also observed between the genotype frequencies of Santa Catarina and São Paulo15,27 (Table 3). These differences can be explained by the high population density in the state of São Paulo, Southeastern Brazil, and the continuous immigration from the country's northeastern region. A study by Manta et al.26 showed that the genetic composition of the state of São Paulo comprises Europeans (61.9%), Blacks (25.5%), and Amerindians (11.6%). This percentage of Blacks may explain the statistically significant difference observed between the studies for the FY*01/FY*02.N01, FY*02/FY*02.N01, and FY*02.N01/FY*02.N01 genotypes. The FY*02N.01 allele is rare in Caucasian and Asian populations and is more common in Africans.28–30
The genotype frequencies in Santa Catarina were also different to the population of Bahia. This analysis aimed to show the difficulty in finding compatibility for sickle cell patients. Although it was expected that sickle cell patients in this study (35.5% of the sample) would have greater compatibility with the Brazilian Northeast, frequencies differed for the RHCE*CC, RHCE*cc, FY*01/FY*01, FY*02/FY*02, FY*02/FY*02N.01, FY*02N.01/FY* 02N.01, JK*A/JK*A, DI*01/DI*02, and DI*02/DI*02 genotypes.
Further comparisons were performed to analyze the similarity between the genotype frequencies found in this study and frequencies in European populations.20,31,32 In general, the genotype frequencies of Santa Catarina were different however, some populations (Naples, Italy and Zurich, Switzerland) were similar in respect to the KEL and JK systems. The difference observed for the Di system might be explained by the Amerindian influence in the Brazilian population.24 According to a genetic study published by Manta et al.,26 the state of Santa Catarina has 8.9% of Amerindians in its genetic composition. The Di(a) antigen is scarcely found in Caucasians or Blacks (1.0%), but it has been found in some Native North and South American Indian groups (more than 30%) and Asians (6–15%).33,34
Statistical differences were also observed among the seven regions of the state of Santa Catarina (Table 3), which may be explained by ethnic influences. Santa Catarina was colonized predominantly by Europeans; each region is influenced by different ethnic groups. According to data from the IBGE, the population of Florianópolis has high proportions of Portuguese, German, Italian, Polish, Swedish, Austrian, and Spanish descendants whereas the populations of Blumenau, Joaçaba, and Lages have more Italian and German descendants. Moreover, the population of Chapecó is made up more of Italian, German, Polish, and Amerindian descendants and the population of Criciúma has a greater influence of Italians, Germans, Poles, Portuguese, and Blacks.35
The data of studies that determine genotype frequencies are useful in transfusion medicine to create a database of genotyped donors to facilitate the selection of adequate blood components for patients (in particular sickle cell disease patients), to discover new alleles, and to find donors with rare phenotypes.
ConclusionThe genotype frequencies of the Rh, KEL, FY, JK, and Di systems in the population of the state of Santa Catarina were significantly different from those in other Brazilian states. Moreover, the genotype frequencies differed among the populations of the different regions of the state of Santa Catarina, showing that, even within the state, the population is heterogeneous. Furthermore, the population of the state of Santa Catarina has genotype frequencies similar to those of populations from Naples, Italy and Zurich, Switzerland for the KEL and JK systems.
FundingThis research was supported by a scholarship for Costa, DC from Capes – Coordenação de Aperfeiçoamento de Pessoal Nível Superior. This study was done with no other financial support.
Conflicts of interestThe authors declare no conflicts of interest.
We thank Dr. Maria Luiza Bazzo and the Santa Catarina Blood Bank for technical support.


