
This study endeavored to assess the lipid profile and atherogenic lipid indexes in children with transfusion-dependent thalassemia (TDT) and to compare them with matched healthy children.
MethodThe study group consisted of a total of 72 TDT patients aged 3 to14 years, while the control group had 83 age- and sex-matched healthy children. The fasting lipid profile and lipid indexes were estimated and the atherogenic index of plasma (AIP), Castelli's risk indexes I and II, atherogenic coefficient were calculated and compared between the two groups.
ResultCompared to the control group, the mean LDL, HDL and cholesterol levels were significantly lower among the case group (p-value < 0.001). The mean VLDL and triglycerides were significantly higher in the case group (p-value < 0.001). Lipid indexes, including the atherogenic index of plasma (AIP), Castelli's risk indexes I and II and atherogenic coefficients were significantly higher in TDT children.
ConclusionDyslipidemia and increased risk of atherosclerosis were found in TDT children, as they had elevated atherogenic lipid indexes. Our study underlines the importance of the routine use of these indexes in TDT children. Future studies should focus on lipid indexes in this high-lipid group of children so that preventive strategies can be planned accordingly.
Thalassemia is the most common monogenic disorder causing hemoglobinopathy worldwide. It is an autosomal recessive disorder, in which there is the reduced or absent production of α- or β- hemoglobin chains, the imbalance of which leads to hemolysis and ineffective erythropoiesis, which are the main causative factors of its pathophysiology.
The homozygous beta thalassemia, non-deletional HbH and severe HbE/β-thalassemia are categorized as transfusion-dependent thalassemia (TDT) which is the most severe form of the spectrum.1 These TDT patients need regular blood transfusion for survival, which in the long term causes iron overload, leading to an increase in the non-transferrin-bound iron and labile iron pool, causing oxidative damage, chronic hypoxia, metabolic dysregulations and cellular damage. Both elevated oxidative stress due to iron overload and increased hemolysis lead to the over-utilization of minerals required for antioxidant enzyme activities.2 The TDT is also associated with altered lipid levels because of oxidative stress that can lead to early atherosclerosis, adding to the morbidity and even early mortality, by increasing the incidence of cardiovascular disease and stroke. Lipid peroxidation is one of the causative factors for dyslipidemia in thalassemia.3 Previous studies have found that children with TDT are at risk of developing premature atherosclerosis, as a result of chronic hemolysis, iron overload and dyslipidemia.4 To predict the risk of early atherosclerosis and cardiac morbidity, few lipid indexes are being used in the adult population, such as the atherogenic index of plasma (AIP), atherogenic coefficient (AC), Castelli's risk indexes I & II.5 Very few studies have assessed the risk of premature atherosclerosis using these lipid indexes in adult thalassemia patients.6 There is scanty research work to date evaluating these lipid indexes as a predictor of early atherosclerosis and cardiovascular disease in children with transfusion-dependent thalassemia. Hence, we assessed the lipid profile and atherogenic indexes in children with TDT and compared them with age- and sex-matched healthy children.
MethodThis was a cross-sectional study conducted between November 2020 and October 2021 including the children with transfusion-dependent thalassemia registered at the thalassemia day-care center of a tertiary care pediatric hospital in Delhi, India. The study was approved by the institutional ethics committee. Informed written consent for participation in the study was obtained from parents of all children and assent was also obtained from children who were over 7 years of age.
All consecutive children with TDT aged 3–14 years of age registered at our thalassemia day-care center receiving regular blood transfusions and chelation therapy were enrolled. Children with TDT who were not on regular blood transfusions due to poor compliance, those with diabetes mellitus, renal failure, hereditary hyperlipidemia and hypothyroidism were excluded. Age- and sex-matched healthy children were enrolled for comparison of the serum lipid levels. Healthy matched controls were obtained from children visiting the hospital's outpatient department for immunization, some unrelated minor illnesses, such as upper respiratory infection, or for routine check-up.
A thorough medical history was obtained from the enrolled children, with special emphasis on the age at first transfusion, frequency of red cell transfusion and duration of blood transfusion. The dietary history was analyzed, based on dietary intake as vegetarian and non-vegetarian diet; those consuming non-vegetarian items at least three times a week were included in the non-vegetarian group. In the detailed clinical examination including the anthropometric measurements, clinical evidence of systemic complications of iron overload were noted. Children were asked to come after an overnight fasting of at least 12 h on the day of their regular transfusion for blood sampling. Liver function tests, including serum bilirubin and liver enzymes, and the kidney function test were performed on the same day on the Beckman Coulter AU 680 biochemistry analyzer. Estimation of plasma lipids, including total cholesterol (TC), triglycerides (TG), high-density lipoprotein (HDL), low-density lipoprotein (LDL) and very-low-density lipoprotein (VLDL) were evaluated. Atherogenic lipid indexes, the atherogenic index of plasma [(log10)(TG/HDL)], atherogenic coefficient (AC) [(TC − HDL)/HDL], Castelli's risk indexes I (TC/HDL) & II (LDL/HDL), were calculated, and compared with the age- and sex-matched healthy controls for better prediction of early atherosclerosis. The potential relationships between these parameters were assessed with anthropometric parameters, frequency of transfusion, pre-transfusion hemoglobin (Hb) (average of 3 months), serum ferritin and liver enzymes in children with TDT.
Statistical analysisThe data were entered into a Microsoft Excel sheet and were analyzed using the Statistical Package for Social Sciences (SPSS) Version 25.0 for Windows. The measure of central tendencies (mean), and the variability (standard deviation (SD)) were calculated. The results were presented as mean ± SD. The Student's t-test was used to compare differences between two means. The chi-square test or Fisher-exact test was used to compare categorical variables. The Pearson correlation and Spearman's correlation coefficient were used for correlation in parametric and non-parametric data, respectively. The p-value <0.05 was considered significant.
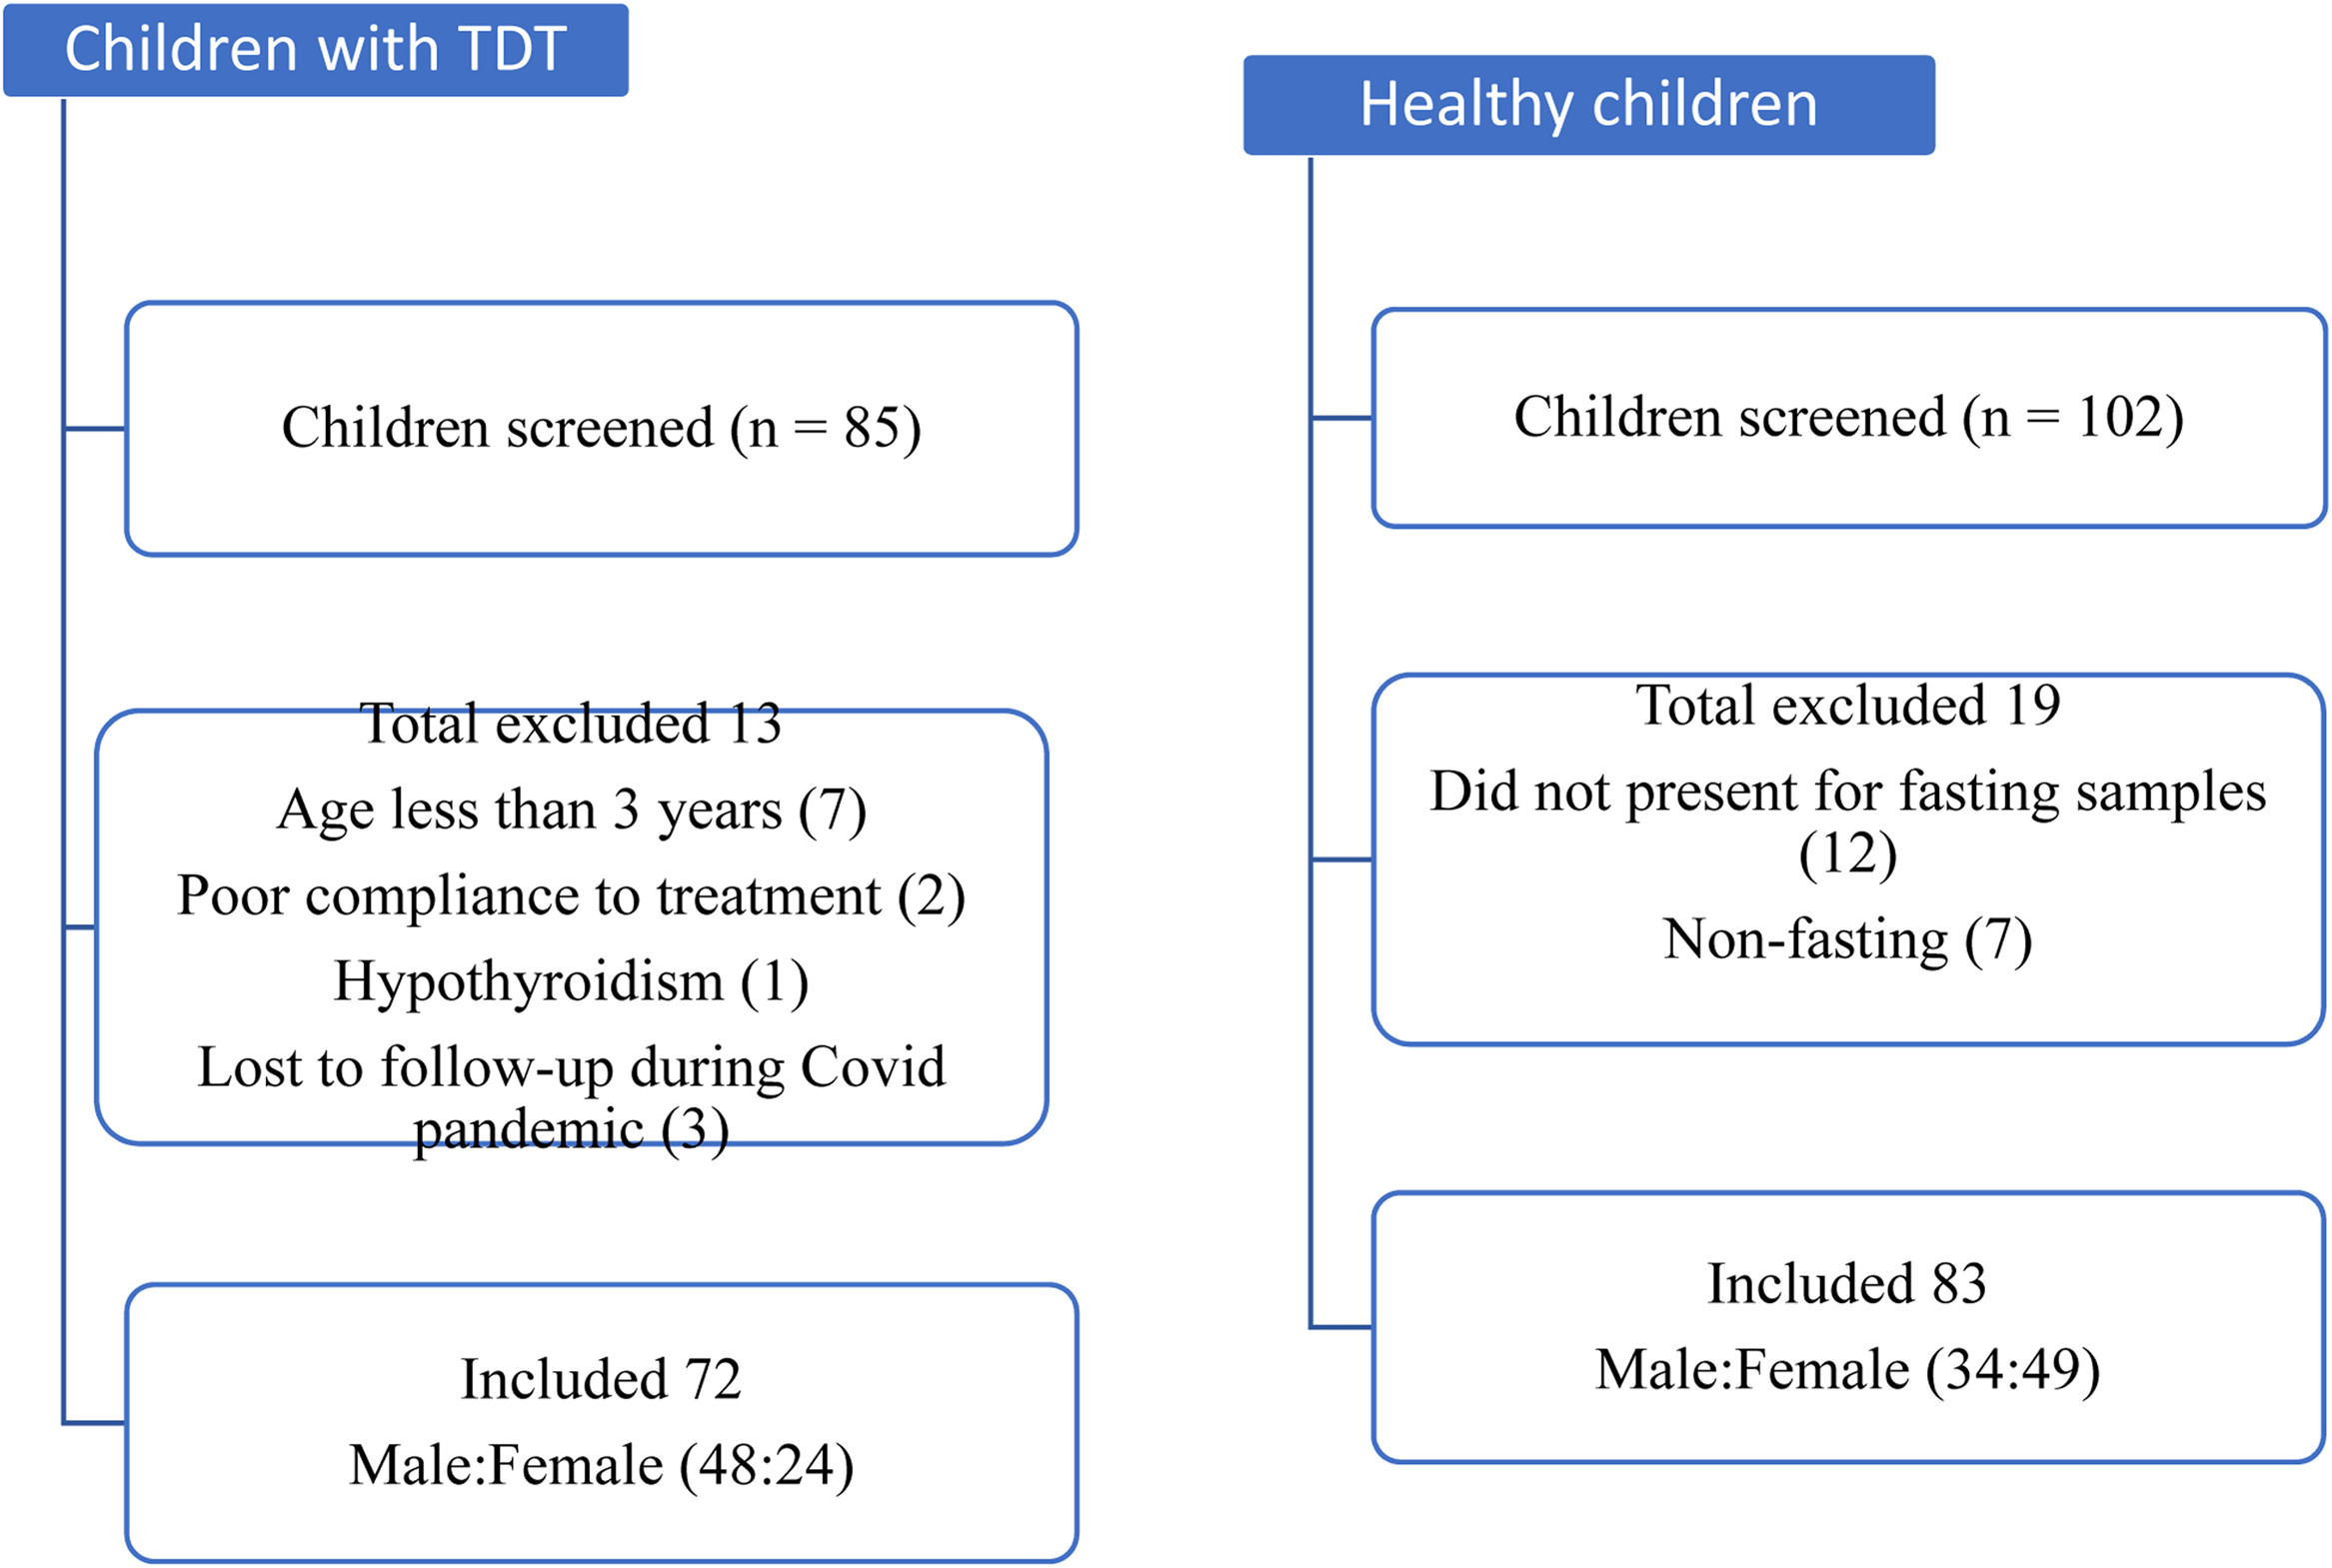
ResultsEighty-five children with TDT registered at the thalassemia day-care center were screened and, of these, seventy-two aged 3 to14 years were enrolled. Another 102 healthy children (age- and sex-matched) were approached and screened, among which eighty-three children were finally enrolled as the comparison group. Figure 1 depicts the flow of participants in the study. In both the groups, the prevalence of male predominance was seen. The mean (SD) age was 8.5 (3.2) years and 8.6 (2.8) years in the case and control groups, respectively. On anthropometric assessment, 40% (29/72) of children with TDT were underweight, compared to 8.4% (7/83) in the comparison group, which was significantly higher (p < 0.001). The mean BMI was significantly lower in cases (14.6 kg/m2), compared to the control group (15.7 kg/m2) (p < 0.001). There was no statistically significant difference between the two groups in terms of the dietary pattern.

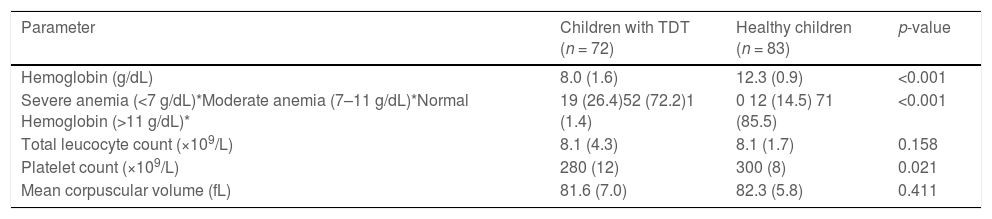
The comparison of the hematological parameters in the two groups of children is shown in Table 1. The mean age at diagnosis of children with TDT was 11.8 ± 1.5 months. The mean age at first blood transfusion was 11.4 ± 1.4 months in children with TDT. These patients were receiving around 17 (mean value) transfusions per year, which means one packed red blood cell transfusion every 3 weeks. The median (range) ferritin level in children with TDT was 1500 (123.0–8543.0) μg/L. Among the children with TDT, 86.1% (62/72) had abnormal ferritin levels. The majority of the patients had a ferritin value between 1000 and 2000 μg/L, while only 6 of our patients had a ferritin value over 5000 μg/L.
Comparison of hematological parameters in children with TDT and healthy children.
Data expressed as mean (SD) *Data given as n (%).
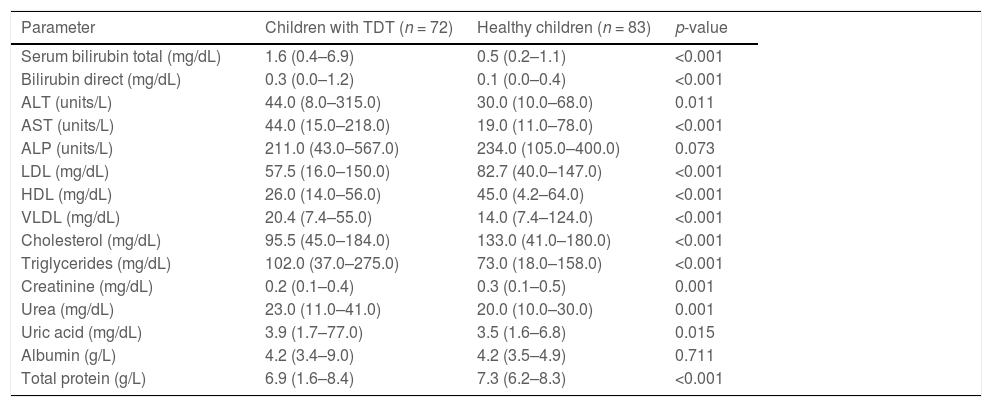
Levels of ALT and AST were significantly increased in the case group than control group (p = 0.011 and p < 0.001, respectively). Compared to healthy controls, significantly elevated levels of serum bilirubin were observed in the case group (p < 0.001) because of ongoing hemolysis in thalassemia. Compared to the control group, the mean LDL, HDL and cholesterol levels were significantly lower among the case group (p-value < 0.001). The mean VLDL and triglycerides were significantly higher in the case group, compared to controls (p-value < 0.001) (Table 2).
Comparison of biochemical parameters in children with TDT and healthy children.
Data shown as median (range); ALT: alanine transaminase; AST: aspartate transaminase; ALP: alkaline phosphatase; HDL: high-density lipoprotein; LDL: low-density lipoprotein; VLDL: very-low-density lipoprotein.
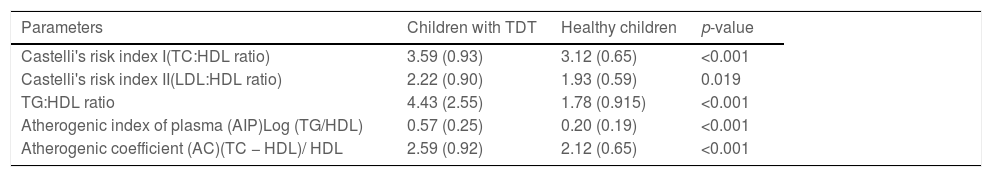
On comparing the atherogenic lipid indexes, including Castelli's risk indexes I and II, the atherogenic index of plasma and the atherogenic coefficient between children with TDT and healthy children, the values were significantly higher in children with TDT (Table 3).
Atherogenic indexes among children with TDT and healthy children.
Data shown as mean (SD).
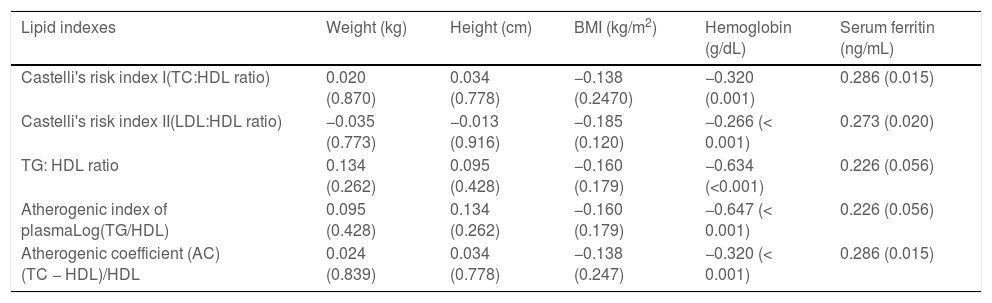
Castelli s risk indexes I and II and the atherogenic coefficient had a significant correlation with the serum ferritin level. The lipid indexes also had significant negative correlations with the hemoglobin of children with TDT (Table 4). There were no significant correlation between lipid indexes and anthropometric parameters in the study group.
Association of lipid indexes with various parameters among the children with TDT.
All values as Spearman correlation (p-value), p-value < 0.05 is considered significant.
The aim of this research was to assess the lipid profile and lipid indexes in children with TDT. The mean LDL, HDL and cholesterol levels were significantly lower among children with TDT (p-value < 0.001), while the mean VLDL and triglycerides were significantly higher in children with TDT, compared to age- and sex-matched healthy children (p-value < 0.001) in our study. The atherogenic lipid indexes, including Castelli's risk indexes I and II, atherogenic index of plasma and atherogenic coefficient, were significantly higher in children with TDT, as compared to healthy children. Castelli's risk indexes I and II and the atherogenic coefficient had a significant correlation with the pre-transfusion Hb level (average of latest 3 months) and serum ferritin levels. Low pre-transfusion hemoglobin was strongly associated with increased dyslipidemia, meaning that ineffective erythropoiesis was not inhibited and led to greater oxidative stress and, thus, a greater degree of dyslipidemia. This finding re-emphasizes the need to keep pre-transfusion hemoglobin above 9.5 g/dL, according to the Thalassemia International Federation (TIF) guidelines.
The liver is the earliest organ affected by excess iron deposition in children with TDT, which leads to gradual damage to the hepatocytes and reticulo-endothelial cells, resulting in hepatic fibrosis.7,8 It is manifested by increased liver enzymes, low serum levels of total cholesterol, low high-density lipoprotein and low-density lipoprotein and high triglycerides levels. The serum level of lipids and lipoproteins are affected by a number of physiological and pathological factors. Age, gender, population-based variables, such as nutritional habits and ethnicity, are a few of the important factors affecting lipid homeostasis in children with TDT. The increased incidence of early atherogenesis, thromboembolic events and endothelial dysfunctions has been found in adult TDT patients, probably due to dyslipidemia and its consequences. The lipid profile abnormality increases the risk of cardiovascular and cerebrovascular complications due to increased atherogenesis, as well as increasing the risk of pancreatitis due to elevated serum TG levels. Lipid and carbohydrate metabolisms are also affected by insulin resistance and liver damage due to transfusional iron overload in these patients.9 This alteration in the lipid profile is likely due to diminished hepatic biosynthesis because of anemia, iron overload, hormonal disturbances and the rapid degradation of HDL and LDL by activated monocytes and macrophages, while a reduced extrahepatic lipolytic action could be responsible for the rise in circulating TG.10 Similar to our study, some studies have also documented low blood cholesterol levels in patients with TDT, which has been attributed to the increased erythropoiesis and increased LDL uptake by macrophage and histiocytes in the reticuloendothelial system (RES).11 Dyslipidemia in thalassemia is a consequence of lipid peroxidation associated with iron overload.12 The low cholesterol levels were related to depletion of vitamin E and severity of thalassemia.13 Oxidative modification of thalassemic LDL had been reported, which was related to the increased protein and triglyceride (TG) content, but decreased cholesterol and vitamin E content.14 Hartman et al.15 described the mechanisms of hypocholesterolemia in TDT patients as hemodilution due to anemia, excessive requirement of cholesterol due to erythroid hyperplasia, increased cytokine release due to the activated macrophage system, increased cholesterol uptake by the activated reticuloendothelial system and hepatic damage secondary to iron overload. Research by Sharif et al.16 also showed similar increase in serum TG levels similar to our study. A study by Mashaali et al.17 also found comparatively lower total cholesterol, HDL and high TG in TDT groups. The suggested mechanisms for the reduction in lipids were increased erythropoiesis and cholesterol consumption, iron overload, hormonal change and oxidative stress in TDT. The study by Shams et al. found that serum TG was significantly higher in patients, compared to controls and correlated well with serum glucose, cholesterol, AST, ALT, iron, ferritin and age.18 In the study by Papanastasiou et al.19 hypertriglyceridemia was observed in 34.6% of the patients, while it was seen in 6.6% of the controls, and a positive correlation was found between the serum TG and age of the patients. On the contrary, a few researchers found no significant difference in the serum TG level between healthy individuals, in comparison with TDT patients.20 These discrepancies might be due to variations in lifestyle and nutrition habits and ethnicities in various studied populations, which need further validation through research.
The atherogenic index of plasma (AIP) is calculated based on serum TG and HDL, both of which are independent risk factors for coronary artery disease (CAD).21 Castelli's risk indexes (CRI-I) and (CRI-II) and the atherogenic coefficient (AC) are among the few other clinically significant indexes which are used to predict risk factors for CAD.22,23 Recent studies have indicated that AIP not only reflects the relationship between protective and atherogenic lipoproteins, but is a strong predictor of atherosclerosis and coronary heart disease.24 The use of triglycerides and HDL in AIP reflects the complex interactions among the metabolism of different lipoproteins and is an important marker for predicting plasma atherogenicity. A recent study by Sujatha et al.7 evaluated 290 adult patients with stroke and found that the CRI-I and AC significantly contributed to the risk of stroke. The authors also suggested that AIP values of −0.3 to 0.1, 0.10 to 0.24 and > 0.24, associated with low, medium and high cardiovascular risk in the adult population, respectively. A study by Dobiasova et al. also found that the atherogenic index plasma value of over 0.24 is a significant predictor for cardiovascular diseases.25 In our study, the mean AIP of the study group was 0.57 ± 0.25, which is quite high, as compared to the values given by adult studies. Though we could not find any separate cutoff for these indexes for the pediatric population, a higher AIP index indicates the significantly increased risk atherosclerosis in this group. In this study, children with TDT had significantly high CRI-I and CRI-II. A recent meta-analysis and systematic review in an adult population showed that a higher TG/HDL ratio was associated with a 43% higher risk of cardiovascular events, whereas the per unit increment of the TG/HDL-C ratio was associated with an 8% higher risk of cardiovascular complications, and it was concluded that the TG/HDL-C ratio may be useful in the prediction and prevention of cardiovascular disease.26
Most studies evaluating the significance of these indexes were performed on the adult population and we could only find very few studies which included pediatric patients. One such study, performed by Nogay et al. studied 400 healthy children of 6 to 18 years of age and concluded that an increase in the AIP is associated with cardiovascular risk factors and it is superior among other indexes in the assessment of cardiometabolic risks in children and adolescents.27 The LDL/HDL ratio is also important, as these both are components of total cholesterol and each have been suggested to be linked to the risk of sudden cardiac death. The higher the LDL/HDL ratio is, the higher the risk, but there is hardly any pediatric literature on this ratio and data on this ratio in TDT children are still rare.28 We could find very few studies analyzing lipid indexes in children with TDT. A recent study performed on children with TDT found the elevated levels of AIP and CRI-1 similar to those in our study.29 Another study published in 2018 showed that the indexes of atherogenicity, particularly the AIP, also correlate well with nutritional status, abdominal obesity and parameters of insulin resistance in the pediatric population.30
Strengths of the studyThis is one of the very few studies analyzing atherogenic indexes in children with TDT. The lipid profile and indexes were compared with age- and sex-matched healthy controls. Children not on regular transfusion and chelation therapy were excluded.
Limitations of the studyA detailed dietary evaluation was not performed on the study subjects and control group. A long-term follow-up was not performed to document the effects of dyslipidemia and abnormal atherogenic indexes.
ConclusionThe observations from our study suggest that, despite regular transfusion and chelation, most TDT children had dyslipidemia and grossly deranged atherogenic indexes, as compared to the healthy children, which makes them prone to the development of early atherosclerosis. Thus, the study adds to the importance of the screening and monitoring of TDT children for atherosclerotic complications, such as cardiovascular morbidities and cerebrovascular accidents. As very few studies have looked into this aspect of lipid indexes in TDT children, more research is needed in this field for the development of effective preventive strategies in this cohort of children.
Ethics statementThis study was performed in accordance with the principles of the Declaration of Helsinki. Ethical clearance was obtained from institutional ethics committee. Informed consent was obtained from parents of children and assent was also obtained from those children aged over 7 years of age.
None.


