Hyperglycemia occurs in Acute Lymphoblastic Leukemia (ALL) due to chemotherapeutic agents and may be stress-induced. Given the potential impact of hyperglycemia on the clinical outcomes of ALL patients, we sought to determine the association of hyperglycemia with the development of infectious complications.
MethodsThis is a retrospective cohort involving adult Filipino ALL patients admitted at a tertiary referral center. Patients were stratified according to blood glucose levels and infections were classified into microbiologically and clinically defined infections. Logistic regression was performed to determine whether hyperglycemia was associated with the development of infectious complications.
ResultsOf the 174 patients admitted for ALL, only 76 patients (44%) underwent blood glucose monitoring and were thus included in this study. Hyperglycemia was observed in 64 patients (84.21%). Infectious complications were seen in 56 patients (73.68%), of whom 37 patients (48.68%) had microbiologically defined infections and 19 (25%) had clinically defined infections. The respiratory tract was the most common site of infection and gram-negative bacteria were the predominant isolates. Hyperglycemia significantly increased the likelihood of infectious complications, particularly at blood glucose levels ≥ 200 mg/dL.
ConclusionHyperglycemia is associated with an increased likelihood of infectious complications in Filipino ALL patients. With sepsis being one of the main causes of mortality in this population, our study provides compelling evidence for us to consider routine blood glucose monitoring in order to manage and potentially decrease the occurrence of infections in these patients.
Acute lymphoblastic leukemia (ALL) is a malignant disease of the bone marrow originating from lymphoid progenitor cells. The proliferation of blasts results in the suppression of normal hematopoiesis with consequent anemia, neutropenia and thrombocytopenia. Treatment of ALL involves the use of multi-agent chemotherapy, including high dose corticosteroids. Infectious complications are seen in at least fifty percent of patients, with severe neutropenia predisposing these patients to invasive infections from bacteria, viruses and fungi.1,2 A review of the management of adult and pediatric ALL in Asia noted a 30% induction death rate, with infection and bleeding as the most common causes.3
Hyperglycemia in these patients can occur due to chemotherapeutic agents (corticosteroids and L-asparaginase) or may be stress-induced. Studies have shown that 86% of patients receiving high-dose corticosteroids for various acute and chronic conditions as inpatients develop at least one episode of hyperglycemia.4 Critical illness can result in metabolic stress, with hyperglycemia developing as an adaptive response.5 Hyperglycemia is known to negatively affect the innate immune system response.5-7 Studies on both intensive care unit (ICU) and non-ICU inpatients have demonstrated that hyperglycemia is associated with increased morbidity, mortality and infectious complications.5,8
Studies on the effect of hyperglycemia on the clinical outcome of adult ALL patients are limited. The study by Weiser et al. on adult ALL patients revealed that hyperglycemia in this population was a risk factor for early disease recurrence, complicated infections and mortality.9 This was supported by the study of Matias et al. on adult patients with acute leukemia (acute myeloid leukemia, ALL, biphenotypic leukemia), which noted that patients with hyperglycemia had an increased risk of complicated infections and death.10 However, the study by Storey and Von Ah on hospitalized adult leukemia (acute and chronic leukemia) patients revealed that, although patients with hyperglycemia had a longer median hospital stay, an increased risk of infection was not statistically significant.11
Given the scarcity of studies on this subject, as well as the potential impact of hyperglycemia on the clinical outcomes of ALL patients, we sought to determine the association of hyperglycemia with the development of infectious complications in adult Filipino patients with ALL. It is important to determine the clinical consequences in order to formulate recommendations on monitoring blood glucose and standardize hyperglycemia interventions in ALL patients.
MethodsPatientsThis was a retrospective cohort involving chart review and abstraction that was conducted at a government tertiary referral center in the Philippines. The study was approved by the Institutional Research Ethics Board.
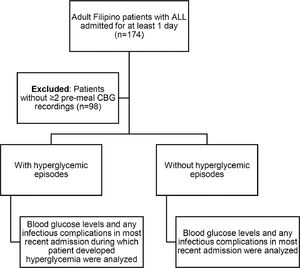
Capillary blood glucose (CBG) testing is the most commonly used tool for monitoring hospitalized patients, as it is a safe and inexpensive method which requires very small volumes of blood to make immediate and reasonably accurate glucose level determination possible.12,13 Furthermore, CBG testing is the recommended method for monitoring patients who are initiated on corticosteroid therapy.14 We opted to use pre-meal CBG values because studies have shown that during periods of fasting, capillary glucose is only slightly (2–5 mg/dL) higher than venous plasma glucose, compared to the postprandial state.15 We retrospectively analyzed 174 adult (age ≥ 18) Filipino patients with ALL admitted for at least 1 day for any reason from 2012 to 2018. Of these, 98 patients did not have at least two pre-meal CBG recordings and were thus excluded.
In patients with multiple admissions and no hyperglycemic episodes, the blood glucose levels and any infectious complications during the most recent admission were recorded. In patients with multiple admissions and hyperglycemic episodes, the blood glucose levels and any infectious complications were recorded during the most recent admission in which the patient developed hyperglycemia (Figure 1).
Definitions and classificationHyperglycemia was defined as having at least one CBG ≥ 140 mg/dL16, with or without pre-existing glucose intolerance. Patients were stratified according to blood glucose levels: Group A (pre-meal CBG 140–199 mg/dL on ≥ 1 determination) and Group B (pre-meal CBG ≥ 200 mg/dL on ≥ 1 determination), based on previous studies showing higher levels of hyperglycemia being associated with worse outcomes, including infections among medical and surgical patients.16–20 For patients who eventually required insulin to control blood glucose excursions, only the initial CBG levels were included in the analysis to minimize the confounding effect of blood glucose stabilization on the infectious comorbidity. Studies on hospitalized patients with or without pre-existing diabetes have shown that hyperglycemia on admission independently predicts infectious complications in both the medical and surgical settings.17,21
Infections were classified into microbiologically defined infections (MDI) and clinically defined infections (CDI). The infection was defined as MDI when a single infectious organism or polymicrobial infection was detected in blood cultures, even without a localized source of inflammation, or when a localized microbiologically defined site of infection was present, with or without concomitant positive blood cultures. If the site of infection was identified clinically or radiologically but the microbiologic pathogenesis was not proven or examined, the infection was defined as CDI.22
Statistical analysisDescriptive statistics was used to summarize the demographic and clinical characteristics of the patients. Frequency and proportion were used for categorical variables, median and inter quartile range (IQR), for non-normally distributed continuous variables and mean and standard deviation (SD), for normally distributed continuous variables. The odds ratio (OR) and corresponding 95% confidence intervals (CI) from binary logistic regression were computed to determine the variables that were significantly associated with the development of infectious complications. The significant variables in the univariate analysis underwent a stepwise method to determine the significant variables in the multivariate analysis. The Shapiro-Wilk test was used to test the normality of the continuous variables. Missing variables were neither replaced nor estimated. The null hypotheses were rejected at the 0.05α-level of significance. STATA 13.1 was used for data analysis.
ResultsSeventy-six patients (44%) had at least two determinations of CBG levels during their admission and were thus included in this study. Of the 76 patients, 64 (84.21%) met the definition for hyperglycemia. Thirty-three patients (43.42%) were classified as Group A (pre-meal CBG 140–199 mg/dL) and thirty-one patients (40.79%) were classified as Group B (pre-meal CBG ≥ 200 mg/dL). Table 1 demonstrates the baseline characteristics of the patients. The mean age was 31.93 years (SD ± 12.80), with a 1.4:1 male to female ratio. Twenty-three patients (30.26%) had comorbidities other than ALL and pre-existing glucose intolerance. There were nine patients with pre-existing glucose intolerance. Five of these patients were maintained on oral hypoglycemic agents, three patients were maintained on insulin and one patient was maintained on both an oral hypoglycemic agent and insulin. The median white blood cell (WBC) count on admission was 24.71 × 10⁹/L (IQR 4.45 × 10⁹/L to 64.87 × 10⁹/L). Only 15 patients had results of cytogenetic analysis. Of these, nine patients had Philadelphia chromosome-positive ALL, five patients had a normal karyotype and one patient had trisomy 5. Sixty-five patients (85.53%) received corticosteroids during their admission. Some patients were shifted from one type of corticosteroid to another within the same admission. Forty-one patients (53.95%) received prednisone, 25 patients (32.89%) received dexamethasone, and 11 patients (14.47%) received hydrocortisone at any time during their admission. Forty-six patients (60.53%) received chemotherapy during their admission. This included 17 patients on Berlin-Frankfurt-Münster (BFM) induction, 1 patient on BFM consolidation, 1 patient on BFM maintenance, 5 patients on hyper-CVAD odd cycles (cyclophosphamide, vincristine, doxorubicin and dexamethasone), 5 patients on hyper-CVAD even cycles (high dose methotrexate and cytarabine), 5 patients on augmented hyper-CVAD, 1 patient on Cancer and Leukemia Group B (CALGB) induction, 2 patients on 6-mercaptopurine, vincristine, methotrexate, prednisone (POMP) maintenance and 9 patients on cytoreduction with vincristine and/or cytarabine. Only two of the 33 patients (6.06%) in Group A and 25 of the 31 patients (80.64%) in Group B received treatment for hyperglycemia. Patients received insulin, with or without oral hypoglycemic agents. The most common form of treatment given was short-acting insulin on an as needed basis.
Demographic and clinical profile of patients (n = 76).
BMI: body mass index; CNS: central nervous system; WBC: white blood cell
Fifty-six patients (73.68%) were noted to have infectious complications, of which 37 (48.68%) had microbiologically defined infections and 19 (25%) had clinically defined infections. The infectious and clinical outcomes of patients are shown in Table 2. Most of the infections were noted to occur in the respiratory tract and 27 patients (35.53%) were observed to have bacteremia. Gram-negative bacteria were the most common isolates, with Klebsiella spp (n = 14, 26.92%) comprising the majority, followed by Acitenobacter spp (n = 11, 21.15%), Pseudomonas spp (n = 8, 15.38%), Escherichia spp (n = 7, 13.46%), Enterobacter spp (n = 2, 3.85%), Morganella spp (n = 1, 1.92%), Proteus spp (n = 1, 1.92%) and Serratia spp (n = 1, 1.92%). Gram-positive bacteria (Staphylococcus spp) comprised three (5.77%) isolates. Fungal infections (Candida spp) also comprised three (5.77%) isolates. Only one (1.92%) viral infection (Varicella zoster) was noted. Of the 64 patients observed to have hyperglycemia, 51 (79.68%) were observed to have infections, compared to five (41.67%) of the 12 euglycemic patients. Thirteen (20.31%) of the 64 patients with hyperglycemia developed septic shock, compared to two (16.67%) of the 12 euglycemic patients. Mortality was noted in 24 patients (37.5%) with hyperglycemia and one patient (8.33%) with euglycemia.
Infectious and clinical outcomes of patients (n = 76).
MDI: microbiologically defined infections; CDI: clinically defined infections; CNS: central nervous system
The association between hyperglycemia and infectious complications during admission is demonstrated in Table 3. On multivariate analysis, patients with hyperglycemia were 6.12 times more likely to have infectious complications after adjusting for body mass index (p-value = 0.034). Additionally, overweight patients were 88% less likely to have infectious complications, compared to patients with a normal body mass index. Table 4 demonstrates the rates of infectious complications among the blood sugar groups. Patients in Group B were 9.45 times more likely to have infectious complications, compared to patients with euglycemia (p-value = 0.005).
Univariate and multivariate analysis of risk factors for the development of infectious complications.
BMI: body mass index; WBC: white blood cell
Infections were more common in patients with hyperglycemia (79.68%), compared to patients who were euglycemic (41.67%). Our study determined that the respiratory tract was the most common site of infection and gram-negative bacteria were the predominant isolates. Sepsis is one of the most common causes of mortality in adult and pediatric patients with ALL in Asian countries with limited resources.3 As such, any risk factor that may increase the incidence of infection in these patients must be identified to improve patient outcomes. Our study revealed that hyperglycemia significantly increased the likelihood of infectious complications. This finding supports the study of Weiser et al.9 on adult ALL patients and Matias et al.10 on adult acute leukemia patients. The study by Storey and Von Ah11 did not note a statistically significant increase in infections among hyperglycemic patients, however, the population of that study was smaller and included both acute and chronic leukemia patients.
Our study revealed that hyperglycemia was common among adult Filipino patients admitted with ALL. Hyperglycemia was noted in 84.21% of the patients, a higher prevalence than that observed in the studies conducted by Matias et al. (67.1%) and Storey and Von Ah (60%), despite both these studies having lower blood glucose levels as thresholds for hyperglycemia.10,11 However, their populations did not solely consist of ALL patients for whom corticosteroids remain a mainstay of therapy. The study by Weiser et al.9 on adult ALL patients noted that hyperglycemia occurred in 37% of their patient population, similar to that of Group B patients in our study (40.79%), who shared the same threshold for hyperglycemia as that in the aforementioned study.
It is noteworthy that, despite the common use of corticosteroids and the increased vulnerability for stress-induced hyperglycemia, blood glucose was only monitored in 44% of the patients. This is comparable to the review of 20 ALL patients by Shapiro et al., which noted that only 40% of the patients underwent monitoring of blood glucose.23 Patients with ALL suffer a myriad of complications arising from the leukemia itself, such as the suppression of normal hematopoiesis, increased bleeding and thrombosis or from treatment with chemotherapeutic agents including, but not limited to, cardiac, renal, hepatic and nervous system toxicities. As there are no guidelines on blood glucose monitoring in ALL patients, we surmise this is often overlooked in the presence of other complications, especially when there are no symptoms of hyperglycemia or no known pre-existing evidence of glucose intolerance. Thus, hyperglycemia can go undocumented and untreated. Although this study did not establish a decreased rate of infection with the treatment of hyperglycemia, it was not designed to determine the effect of treatment of hyperglycemia on the rate of infection. Moreover, the management of hyperglycemia in these patients was not standardized and possibly even inadequate. Not all patients with hyperglycemia were given treatment and the most common intervention for hyperglycemia was only short-acting insulin given on an as needed basis.
Interestingly, being overweight was associated with a decreased likelihood of infections. However, it is important to note that the body mass index (BMI) of the patients was calculated based on the weight and height on admission only. Admission length varied from 4 days to as long as 124 days. For patients with prolonged admissions, we can surmise that their weights could have fluctuated, thus altering the BMI. A study on 52 patients with acute leukemia revealed a mean loss of 5.1 ± 4.8 kg of body weight during the induction chemotherapy period.24 The chemotherapeutic agents used in ALL are emetogenic and can also commonly cause oral mucositis. This can lead to anorexia and subsequent weight loss. Illness-induced weight loss can also result in significant changes in BMI.25 Alternatively, it can be hypothesized that overweight patients have higher metabolic reserves that can be protective in patients with acute or chronic illnesses. The immunomodulatory and anti-inflammatory properties of adipokines may contribute to the host defense system and influence infection risk.26–28
The findings of this study are limited partly by its retrospective design and the inclusion of only one tertiary medical center. There was a disparity in the number of patients classified as hyperglycemic and euglycemic, with euglycemic patients having a smaller sample size. As such, further studies on the association of the blood glucose level and the development of infectious complications with a larger sample size for the euglycemia group are suggested to corroborate our initial findings. Since this study was conducted in a resource-limited setting, inaccessibility to certain diagnostics and ideal treatment precluded further analyses. Additionally, the monitoring of blood glucose was not standardized and neither was the management of hyperglycemia. We did not determine risk factors for hyperglycemia which were not the focus of this study. Long-term follow-up beyond the admissions was not performed, hence the conclusions from this analysis can only be applied to the inpatient care of patients with ALL. Nevertheless, this study does reveal a significant association between hyperglycemia and an increased likelihood of infections in adult Filipino patients with ALL, thus providing compelling evidence for us to consider routine blood glucose monitoring in these patients.
ConclusionHyperglycemia is associated with an increased likelihood of infectious complications, particularly at blood glucose levels ≥ 200 mg/dL in adult Filipino patients with ALL. With sepsis being one of the main causes of mortality in this population, it is important for us to determine the presence of hyperglycemia through blood glucose monitoring in order to manage and potentially decrease the occurrence of infections in these patients. We recommend further prospective studies with standardized glucose monitoring and treatment to determine whether glycemic control can improve outcomes in these patients. We also recommend further studies on the association of hyperglycemia with the remission rate, event-free survival, and 5-year overall survival in this population.


