Minimal residual disease is an important independent prognostic factor that can identify poor responders among patients with acute lymphoblastic leukemia.
ObjectiveThe aim of this study was to analyze minimal residual disease using immunoglobulin (Ig) and T-cell receptor (TCR) gene rearrangements by conventional polymerase chain reaction followed by homo-heteroduplex analysis and to compare this with real-time polymerase chain reaction at the end of the induction period in children with acute lymphoblastic leukemia.
MethodsSeventy-four patients diagnosed with acute lymphoblastic leukemia were enrolled. Minimal residual disease was evaluated by qualitative polymerase chain reaction in 57 and by both tests in 44. The Kaplan–Meier and multivariate Cox methods and the log-rank test were used for statistical analysis.
ResultsNine patients (15.8%) were positive for minimal residual disease by qualitative polymerase chain reaction and 11 (25%) by real-time polymerase chain reaction considering a cut-off point of 1×10⁻³ for precursor B-cell acute lymphoblastic leukemia and 1×10⁻² for T-cell acute lymphoblastic leukemia. Using the qualitative method, the 3.5-year leukemia-free survival was significantly higher in children negative for minimal residual disease compared to those with positive results (84.1%±5.6% versus 41.7%±17.3%, respectively; p-value=0.004). There was no significant association between leukemia-free survival and minimal residual disease by real-time polymerase chain reaction. Minimal residual disease by qualitative polymerase chain reaction was the only variable significantly correlated to leukemia-free survival.
ConclusionGiven the difficulties in the implementation of minimal residual disease monitoring by real-time polymerase chain reaction in most treatment centers in Brazil, the qualitative polymerase chain reaction strategy may be a cost-effective alternative.
With current cure rates of 80–85%, modern treatment protocols for acute lymphoblastic leukemia (ALL) incorporate risk stratification of patients, in order to intensify treatment in higher-risk patients and reduce adverse effects of those with greater probability of cure.1
Several studies have shown that the detection of residual leukemic cells, that is minimal residual disease (MRD), especially at the end of the induction period, is an important prognostic factor to identify patients with higher risk of relapse.2–4
Current ALL protocols use immunophenotyping by flow cytometry or real-time quantitative polymerase chain reaction (RQ-PCR) to evaluate MRD. Both methods are highly sensitive and specific but complex and expensive.5,6
The evaluation of MRD by flow cytometry is a fast quantitative method that requires limited sample manipulation and may reach sensitivities of 10−3 to 10−5 depending on the number of fluorochromes used in the analysis (from 3 to 9).6 However, the expression of antigens may vary during treatment and normal B precursor cells may express markers similar to those of lymphoblasts in ALL.7
Clonal immunoglobulin (Ig) and T cell receptor (TCR) gene rearrangements have been widely used in MRD evaluation because of their high frequencies in both B-ALL and T-cell acute lymphoblastic leukemia (T-ALL) cells.8 RQ-PCR analysis of rearranged Ig and TCR genes has high sensitivity (10−4 to 10−5), a good degree of standardization, besides the advantage of using a stable sample (DNA). On the other hand, the high cost and complexity may hinder its implementation in most oncohematology units in developing countries.6
MRD analysis of Ig and TCR gene rearrangements can also be accomplished by qualitative PCR followed by homo-heteroduplex analysis to discriminate clonal PCR amplicons, a much simpler method. Although less sensitive (10−2 to 10−3), the test can be used to identify patients at higher risk of relapse.9
ObjectiveThis study aimed to compare MRD results of qualitative PCR and the gold standard, RQ-PCR.
MethodsPatientsSeventy-four consecutive zero- to 19-year-old patients with a diagnosis of ALL were investigated. Patients were identified in three leading institutions in Belo Horizonte, Minas Gerais, Brazil: Hospital das Clínicas da Universidade Federal de Minas Gerais (UFMG) (n=52); Hospital da Baleia/Fundação Benjamin Guimarães (n=14); and Santa Casa de Misericórdia de Belo Horizonte (n=8). Bone marrow samples were collected from January 2010 to December 2012. Most patients (n=45) were treated according to the Grupo Brasileiro de Tratamento da Leucemia Infantil-leucemia linfoide aguda (GBTLI-LLA-99) protocol although 21 patients were treated according to GBTLI-LLA-2009, and eight patients using the Associazione Italiana Ematologia ed Oncologia Pediatrica (AIEOP-95) protocol. According to the GBTLI-LLA-99 and 2009 protocols, patients older than nine years at diagnosis and/or with a white blood cell (WBC) count above 50×109/L were assigned to the group with high risk of relapse and the others were assigned to the low-risk group and received less intensive treatment. Approval was obtained from the Ethics Committee of the three participating institutions and all guardians and/or patients gave their informed written consent to participate in the study according to the Declaration of Helsinki. No family or patient refused to sign the informed consent form.
Diagnostic studiesDiagnosis of ALL was made by standard morphological analysis and by flow cytometry immunophenotyping. Karyotype analysis and reverse transcription PCR (RT-PCR) were also performed at diagnosis for the BCR-ABL, TCF3/PBX1, ETV6/RUNX1 and MLL-AF4 fusion genes.
Cell samples and DNA isolationBone marrow samples were obtained from the patients at diagnosis (Day 0) and at the end of the induction period (Day 28 for those treated according to GBTLI-LLA-99 protocol; Day 33 for AIEOP-95; and Day 35 for GBTLI-LLA-2009).
Mononuclear cells were separated using Histopaque® (Sigma–Aldrich, Saint Louis, USA) centrifugation gradient and DNA was extracted with the NucleoSpin® Tissue Kit (Macherey-Nagel, Düren, Germany) according to manufacturer's instructions. The extracted DNA was quantified using the NanoDrop 2000™ Spectrophotometer. The quality of DNA was confirmed through amplification of the Fms-like tyrosine kinase 3 (FLT3) gene, according to Meshinchi et al.10
Identification of immunoglobulin/T cell receptor minimal residual disease targets at diagnosisDNA from diagnostic samples was screened using 19 primer mixes according to the ALL subtype. For precursor B-cell acute lymphoblastic leukemia (pB-ALL), BIOMED2 primer sets for the complete and incomplete IgH (VH-(DH)-JH, DH-JH), IgK (Vk-Kde, Intron-Kde), TCRG (Vg-Jg1.3/2.3+Jg1.1/2.1) and incomplete TCRD gene rearrangements (Vd2-Dd3, Dd2-Dd3) were used.11 For T-ALL, BIOMED2 primer sets for the IgH (DH-JH), TCRG (Vg-Jg1.3/2.3+Jg1.1/2.1), TCRD (Vd-(Dd)-Jd1, Dd2-Jd1, Vd2-Dd3, Dd2-Dd3) gene rearrangements and for the Sil-Tal (Sil-Tal1, Sil-Tal2) microdeletion were used.11,12
PCR was carried out in 25μL reactions containing 25ng of DNA, 1U of Tth DNA polymerase (Biotools, Madrid, Spain), 10pmol of each primer, 2mM of MgCl2, and 100μM of each dNTP. The PCR amplification cycles have been previously described.11,12 Two negative controls were used in each PCR assay: one without DNA and the other containing pools of polyclonal DNA obtained from peripheral blood mononuclear cells (PBL) from ten healthy donors. PCR products were analyzed by homo-heteroduplex analysis on 12% acrylamide gels stained with Sybr Safe DNA gel stain (Invitrogen, USA), as previously described.13 Amplified gene rearrangements were characterized as clonal when a band of the expected size was visible,11 and not present in the PBL control. The band containing the clonal amplicon, according to the expected molecular size, was cut from the gel, dissolved in water and stored at −20°C for subsequent sequencing.
Qualitative minimal residual disease analysisFor MRD monitoring by the qualitative method, at least two clonal markers identified at diagnosis were tested, whenever possible. PCRs and homo-heteroduplex analyses were carried out as described above, except that 500ng of DNA were used. Day 28–35 samples, diagnostic DNA samples, as well as the polyclonal PBL DNA and the non-template controls were run in parallel. Follow-up samples were considered positive when they showed the same migration pattern and molecular weight as the samples at diagnosis.
Sequencing and design of patient-specific primersClonal PCR products from Day 0 that had been dissolved in water were re-amplified in a volume of 50μL using the same primer sets (but with T7 or M13 extensions) and reaction conditions as described above. Sequencing reactions were carried out using the BigDye Terminator Cycle Sequencing Reaction Kit (PE Applied Biosystems) and T7 and M13 primers. Sequences were run using the ABI Prism 3130 Genetic Analyzer (PE Applied Biosystems) and analyzed using the Chromas Lite 2.4 software (Technelysium Pty Ltd.). Patient-specific junctional region sequences were identified with the Blast tool (http://blast.ncbi.nlm.nih.gov/Blast.cgi) and IMGT/V-QUEST (http://www.imgt.org/IMGT_vquest/share/textes/).
The Primer3 Biotools software (http://biotools.umassmed.edu/bioapps/primer3_www.cgi) was used to design patient-specific primers complementary to the junctional region sequence and compatible with primers and probes previously described for IgH,14IgK,15TCRG,16TCRD,17 and Sil-Tal.18 Two patient-specific primers were designed for each Ig/TCR region. GC rich (>80%) junctional regions were not used as targets.
Patient-specific primers were tested for specificity and sensitivity. RQ-PCR analysis was performed in duplicate, in a final volume of 25μL containing 100ng of DNA, 5μM sequence-specific TaqMan probes (Applied Biosystems), 7.5pmol of each primer, and TaqMan Universal Master mix (2×) (Applied Biosystems), on the StepOnePlus™ RQ-PCR System (Applied Biosystems). Results were analyzed with the StepOne software v2.3 and the sensitivity was defined as the point with the greatest dilution in which the cycle threshold (Ct) reached at least one Ct below the lowest Ct for polyclonal PBL. The primer was considered more specific the greater the difference between the sensitivity of Ct and that of PBL Ct.
Minimal residual disease using real-time polymerase chain reactionRQ-PCR MRD analysis of Day 28–35 samples was performed and interpreted according to the guidelines of van der Velden et al.19 RQ-PCRs were carried out as described above for sensitivity tests, except that 500ng of DNA were used. Results were normalized using N-RAS as a control gene.18 MRD cut-off points were defined according to the GBTLI-2009 protocol, in which patients with results above 1×10⁻³ for pB-ALL and 1×10⁻² for T-ALL are considered positive and classified as poor responders at the end of the induction therapy.
Statistical analysisOverall survival (OS), event-free survival (EFS) and leukemia-free survival (LFS) curves were plotted employing the Kaplan–Meier method. The OS was calculated from the date of diagnosis to the date of death or last follow-up. The EFS was calculated from the date of diagnosis to the date of relapse or death. The LFS was calculated from the date of leukemia remission to the date of relapse (patients who died in remission was censored on the date of death). The cut-off date for censoring non-relapsed patients was 22 October 2014. Curves for different MRD groups were compared by the log-rank test according to age, WBC count at diagnosis, immunophenotype, risk group, gender, institution of origin and treatment protocol. All statistical analyses were performed using the Statistical Program for the Social Sciences (SPSS) software (version 20.0) with the level of significance set for p-values≤0.05. The association between LFS, qualitative MRD and RQ-PCR MRD results were adjusted for the effect of clinical and biological categorical variables in a multivariate Cox model.
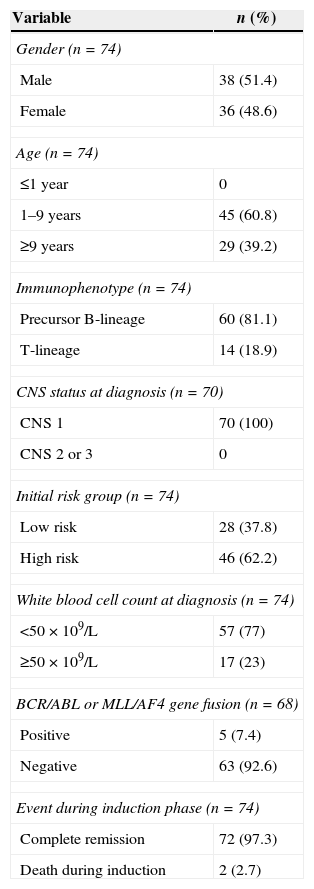
ResultsThe main clinical and biological characteristics of patients at diagnosis and in the induction phase are depicted in Table 1.
Clinical and biological variables of children with acute lymphoblastic leukemia (n=74).
| Variable | n (%) |
|---|---|
| Gender (n=74) | |
| Male | 38 (51.4) |
| Female | 36 (48.6) |
| Age (n=74) | |
| ≤1 year | 0 |
| 1–9 years | 45 (60.8) |
| ≥9 years | 29 (39.2) |
| Immunophenotype (n=74) | |
| Precursor B-lineage | 60 (81.1) |
| T-lineage | 14 (18.9) |
| CNS status at diagnosis (n=70) | |
| CNS 1 | 70 (100) |
| CNS 2 or 3 | 0 |
| Initial risk group (n=74) | |
| Low risk | 28 (37.8) |
| High risk | 46 (62.2) |
| White blood cell count at diagnosis (n=74) | |
| <50×109/L | 57 (77) |
| ≥50×109/L | 17 (23) |
| BCR/ABL or MLL/AF4 gene fusion (n=68) | |
| Positive | 5 (7.4) |
| Negative | 63 (92.6) |
| Event during induction phase (n=74) | |
| Complete remission | 72 (97.3) |
| Death during induction | 2 (2.7) |
CNS: central nervous system.
Fourteen out of the 74 patients were not tested for gene rearrangements because there was not enough bone marrow material for molecular biology studies at diagnosis, and two patients died during the induction period. Thus, 58 patients were screened for Ig/TCR rearrangements. At least one clonal marker was detected in 57 children (98.3%): 47 out of 47 (100%) for pB-ALL and 10 out of 11 (90.9%) for T-ALL. Two or more clonal markers were detected in 46 children (79.3%): 41 out of 47 (87.2%) for pB-ALL and 5 out of 11 (45.5%) for T-ALL. Ig/TCR rearrangements were not be detected in one patient with T-ALL.
The most frequent rearrangement for pB-ALL was IgH (74.5%), followed by TCRD (59.6%), IgK (53.2%) and TCRG (38.3%). For T-ALL, the most frequent rearrangement was TCRG (90.9%), followed by Sil-Tal1 (18.2%).
Of the 57 patients with at least one clonal marker, 51 (89.5%) had suitable targets for the design of specific primers. A total of 173 primers (75 for IgH, 43 for TCRD, 33 for TCRG and 22 for IgK) were designed and tested for sensitivity and specificity. Primers for the Sil-Tal1 rearrangement were also tested in two patients. IgH, IgK and Sil-Tal1 primers achieved higher sensitivity (1×10⁻⁴) than primers for TCRG and TCRD. A high proportion of TCRG and TCRD primers were unspecific (66.7% and 55.8%, respectively). After testing the 175 primers, 44 patients had at least one primer that was suitable for RQ-PCR monitoring of MRD.
MRD evaluationAt the end of the induction therapy, 9/57 patients (15.8%) had positive MRD by the qualitative assay, 12.8% (6/47) for pB-ALL and 30% (3/10) for T-ALL. Eight out of the nine MRD-positive patients had been assigned to the high-risk group at diagnosis; one of them was BCR-ABL-positive and another was MLL-AF4-positive. Sensitivity of the assay with the qualitative primers was 10−2 to 10−3.13
MRD analysis by RQ-PCR was performed in 14/44 (32%) patients using two markers and in 30 (68%) using just one marker. Twenty-seven IgH, 12 IgK, five TCRG and 11 TCRD rearrangements were used. Eleven out of the 44 patients (25%) had positive MRD at the cut-off level of 10−3 (pB-ALL) or 10−2 (T-ALL); 10/39 (25.6%) pB-ALL patients and 1/5 (20%) T-ALL patients. Eight out of the 11 had been assigned to the high-risk group at diagnosis; two of them were BCR-ABL-positive and another was MLL-AF4-positive. The observed sensitivity of the assay with the specific primers varied from 10−3 to 10−5.
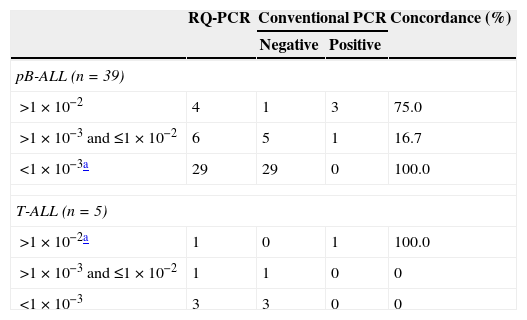
According to MRD RQ-PCR cut-off points established by the GBTLI-2009 protocol, the agreement between the two methods using Kappa statistics was 40% for pB-ALL and 100% for T-ALL. When a cut-off point of 1×10⁻² was used for pB-ALL, the Kappa coefficient was 75%, and considering a cut-off point of 1×10⁻³ for T-ALL, it was 50% (Table 2). Most divergent results between assays were patients with MRD loads between 10−2 and 10−3, which were positive in RQ-PCR but negative in conventional PCR.
Comparative analysis of minimal residual disease by conventional polymerase chain reaction (PCR) and real-time quantitative polymerase chain reaction (RQ-PCR).
| RQ-PCR | Conventional PCR | Concordance (%) | ||
|---|---|---|---|---|
| Negative | Positive | |||
| pB-ALL (n=39) | ||||
| >1×10⁻² | 4 | 1 | 3 | 75.0 |
| >1×10⁻³ and ≤1×10⁻² | 6 | 5 | 1 | 16.7 |
| <1×10⁻³a | 29 | 29 | 0 | 100.0 |
| T-ALL (n=5) | ||||
| >1×10⁻²a | 1 | 0 | 1 | 100.0 |
| >1×10⁻³ and ≤1×10⁻² | 1 | 1 | 0 | 0 |
| <1×10⁻³ | 3 | 3 | 0 | 0 |
pB-ALL: precursor-B cell acute lymphoblastic leukemia; T-ALL: T-cell acute lymphoblastic leukemia.
The estimated 3.5-year probabilities of OS and EFS were 73.6% and 68.2%, respectively, while the estimated 3.5-year probability of LFS was 72.3% (Figure 1).
 overall survival and (B) event-free survival of all patients (n=74); and (C) leukemia-free survival in 72 patients.")
The median time of LFS for children without relapse was 3.0 years (1.1–4.5 years) from the date of morphological bone marrow remission. The median time from remission to relapse was 1.2 years (0.5–2.5 years). The 3.5-year LFS was significantly higher in qualitatively MRD-negative children (84.1±5.6%) when compared to MRD-positive children (41.7±17.3%; p-value=0.004) (Figure 2). There was no significant association between any other analyzed clinical or biological variables and LFS. Even different protocols had no impact on survival (data not shown).

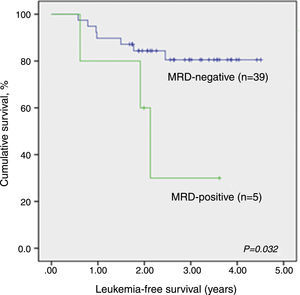
LFS data analysis for qualitative MRD results was repeated considering only patients evaluated by both techniques, qualitative PCR and RQ-PCR (n=44). Again, qualitative MRD-negative patients had significantly higher LFS than MRD-positive children (p-value=0.032; Supplemental figure 1).
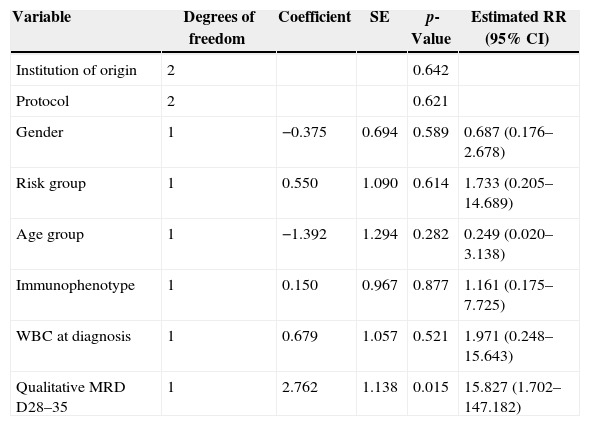
Cox's regression model was used to assess the prognostic impact of qualitative MRD on LFS on Days 28–35. After adjusting for the effect of gender, institution of origin, treatment protocol, risk group, immunophenotype, WBC count at diagnosis and age in a multivariate analysis, MRD was the only variable significantly associated with LFS (p-value=0.015) (Table 3).
Cox model for the prognostic influence of minimal residual disease consensus primers on Days 28–35 on the leukemia-free survival of 57 children with acute lymphoblastic leukemia.
| Variable | Degrees of freedom | Coefficient | SE | p-Value | Estimated RR (95% CI) |
|---|---|---|---|---|---|
| Institution of origin | 2 | 0.642 | |||
| Protocol | 2 | 0.621 | |||
| Gender | 1 | −0.375 | 0.694 | 0.589 | 0.687 (0.176–2.678) |
| Risk group | 1 | 0.550 | 1.090 | 0.614 | 1.733 (0.205–14.689) |
| Age group | 1 | −1.392 | 1.294 | 0.282 | 0.249 (0.020–3.138) |
| Immunophenotype | 1 | 0.150 | 0.967 | 0.877 | 1.161 (0.175–7.725) |
| WBC at diagnosis | 1 | 0.679 | 1.057 | 0.521 | 1.971 (0.248–15.643) |
| Qualitative MRD D28–35 | 1 | 2.762 | 1.138 | 0.015 | 15.827 (1.702–147.182) |
SE: standard error; RR: relative risk; CI: confidence interval; WBC: white blood cell count; MRD D28–35: minimal residual disease on Days 28–35.
After excluding non-significant variables, positive MRD by qualitative PCR on Days 28–35 was significantly associated with a lower LFS (p-value=0.009). The relapse risk for positive MRD patients on Days 28–35 was 4.6 higher than for those with negative MRD (95% confidence interval: 1.5–14.6).
There was no significant association between RQ-PCR MRD and LFS (Figure 3). Analyzing the individual data, only one of six children (all with pB-ALL) with positive RQ-PCR MRD and negative qualitative MRD relapsed so far, after one year of remission. The remaining five are alive and without relapsing for 3.2–4.0 years since the initial remission.

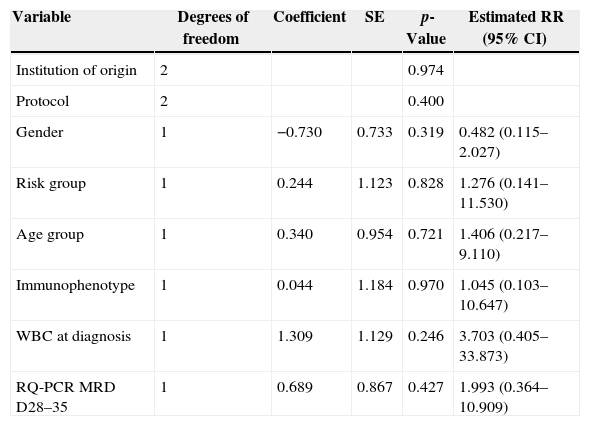
Cox's regression model was used to determine the prognostic impact of RQ-PCR MRD on Days 28–35 on LFS. After adjusting for the effect of gender, institution of origin, treatment protocol, risk group, WBC count at diagnosis, age and immunophenotype in a multivariate analysis, no variable was statistically associated with LFS, including RQ-PCR MRD (p-value=0.427; Table 4).
Cox model for the prognostic influence of minimal residual disease based on real-time quantitative polymerase chain reaction (RQ-PCR) on Days 28–35 on the leukemia-free survival of 44 children with acute lymphoblastic leukemia.
| Variable | Degrees of freedom | Coefficient | SE | p-Value | Estimated RR (95% CI) |
|---|---|---|---|---|---|
| Institution of origin | 2 | 0.974 | |||
| Protocol | 2 | 0.400 | |||
| Gender | 1 | −0.730 | 0.733 | 0.319 | 0.482 (0.115–2.027) |
| Risk group | 1 | 0.244 | 1.123 | 0.828 | 1.276 (0.141–11.530) |
| Age group | 1 | 0.340 | 0.954 | 0.721 | 1.406 (0.217–9.110) |
| Immunophenotype | 1 | 0.044 | 1.184 | 0.970 | 1.045 (0.103–10.647) |
| WBC at diagnosis | 1 | 1.309 | 1.129 | 0.246 | 3.703 (0.405–33.873) |
| RQ-PCR MRD D28–35 | 1 | 0.689 | 0.867 | 0.427 | 1.993 (0.364–10.909) |
SE: standard error; RR: relative risk; CI: confidence interval; WBC: white blood cell count; MRD D28–35: minimal residual disease on Days 28–35.
Risk stratification is still a challenging issue in the treatment of children with ALL. The stratification of patients based on MRD defined by Ig/TCR markers using PCR at the end of induction therapy was included in the Brazilian protocols for the first time in 2009 and is still under evaluation.20 The present study aimed to compare a low-cost PCR-based technique of detection and monitoring MRD with the gold standard method, RQ-PCR.
The detection of at least one clonal rearrangement in 98.3% of patients tested by PCR supports the applicability of the GBTLI-2009 strategy for the screening of rearrangements in the vast majority of children with ALL.
For pB-ALL patients, the prevalence of rearrangements was similar to that found by van der Velden et al., Flohr et al., and two other Brazilian studies using the same methodology.9,13,21,22 The most common of the 19 clonal rearrangements screened was IgH, followed by TCRD and IgK, as observed by Thorn et al.23 In T-ALL, the most frequent rearrangement was TCRG, in line with other studies.9,13,24 Frequency of the SIL-TAL1 rearrangement (18.2%) is also in agreement with findings from other Brazilian groups.25
In the present study, two or more clonal rearrangements were detected in 87% of the pB-ALL and in 45% of the T-ALL patients. Since most researchers propose two targets for MRD monitoring,5 there is a need to increase T-ALL targets.
According to van der Velden, the sensitivity of the RQ-PCR assay depends on several factors, including the type of rearrangement.26 In this study, primers synthesized for IgH and IgK rearrangements were the most sensitive and specific as in previous reports,27 and should be the first choice for MRD monitoring in pB-ALL. The low specificity of TCRG rearrangements (only two of the nine primers tested were approved in the sensitivity and specificity tests) could be due to the size of the N region,16 although this aspect was not evaluated in the present study.
MRD by qualitative PCR was positive on Days 28–35 in 15.8% of the patients in this study, a figure within the range described previously by Scrideli et al. using a similar methodology (13.2%).9 MRD by RQ-PCR was positive in 25% of the patients at the end of induction.
Comparing the qualitative and quantitative techniques, this study found a 40% agreement for pB-ALL and 100% for T-ALL. All negative cases in the quantitative test were also negative in the qualitative test. The GBTLI-2009 reference laboratory from Centro Infantil Boldrini (Campinas, SP, Brazil) reported a 68% agreement between the two methods for pB-ALL (n=121) and 100% for T-ALL (n=9) in an ongoing prospective study (personal communication). The discordance rate between the two assays for pB-ALL is not surprising since the qualitative assay has low sensitivity (10−2 to 10−3) and therefore the qualitative test may miss pB-ALL patients characterized as positive by the quantitative assay with a cut-off point of 10−3.
Several clinical trials that stratify patients based on RQ-PCR MRD have shown that molecular response is highly predictive for relapse in childhood ALL.28–30 In this study MRD by qualitative PCR was the single variable that showed a statistically significant association with the LFS. Surprisingly, RQ-PCR MRD showed no association, in contrast to what has been observed in other studies.22,30 It is important to point out that the follow-up time of the present study is relatively short and patients who had been MRD-positive by RQ-PCR may relapse later on. Moreover, the number of patients evaluated was rather low. It is possible that the effect of low-level MRD on outcome detected by RQ-PCR would be evident had a larger group of patients been studied. In addition, MRD was studied at just one time point while other studies evaluated the kinetics of MRD from the end of induction to maintenance at two time points.6,28 The lack of association between RQ-PCR data and LFS in this study is intriguing and needs to be further examined in a larger cohort with a longer follow-up.
It is interesting to highlight that six pB-ALL patients with a MRD load close to 10−3 were identified as positive by RQ-PCR but negative by qualitative PCR. As already stated, only one patient has relapsed so far. Perhaps the sensitivity of the qualitative assay may be enough to identify patients with a relatively high-level MRD who are at a higher risk of relapse and need intensification of therapy or alternative protocols that could avoid relapse.
ConclusionsThe RQ-PCR method is highly sensitive and specific as reported by many institutions all over the world. The GBTLI-2009 protocol also recommends this method for MRD analysis in children with ALL. The present study, however, suggests that primer-based MRD at the end of induction seems to be an effective alternative to assign risk to children with ALL. Undoubtedly, it is a simple and cost-effective strategy for institutions and countries with limited technical and financial resources.
Conflicts of interestThe authors declare no conflict of interest.
We would like to thank all patients and their families for taking part in this research. We would like to thank some medical doctors, especially Joaquim Caetano de Aguirre Neto and Alvaro Pimenta Dutra (Santa Casa de Misericórdia, BH), Eduardo Ribeiro Lima (Hospital da Baleia, Fundação Bernardo Guimarães, BH), Benigna Maria de Oliveira, Cybele de Andrade Paes and Mitiko Murao (Hospital das Clínicas da Universidade Federal de Minas Gerais). We also thank Valéria Cristina Câmara for the technical support. This work was supported by Conselho Nacional de Desenvolvimento Científico e Tecnológico (CNPq) and Fundação de Amparo à Pesquisa de Minas Gerais (FAPEMIG).
MBV and JAY have research grants from CNPq (Brazilian Research Council), Brazil. This work was supported by grants from Fundação de Amparo à Pesquisa de Minas Gerais (FAPEMIG) to MBV and Ronald McDonald Institute (79/2011) to JAY.