


We investigated the predictive capacity of six prognostic indices [Karnofsky Performance Status (KPS), Hematopoietic Cell Transplant-Specific Comorbidity Index (HCT-CI), Disease Risk Index (DRI), European Bone Marrow Transplantation (EBMT) and Revised Pre-Transplantation Assessment of Mortality (rPAM) Scores and Endothelial Activation and Stress Index (EASIX)] in 205 adults undergoing post-transplant cyclophosphamide (PTCy)-based allo-HCT. KPS, HCT-CI, DRI and EASIX grouped patients into higher and lower risk strata. KPS and EASIX maintained appropriate discrimination for OS prediction across the first 2 years after allo-HCT [receiver operating characteristic curve (area under the curve (AUC) > 55 %)]. The discriminative capacity of DRI and HCT-CI increased during the post-transplant period, with a peak of prediction at 2 years (AUC of 61.1 % and 61.8 %). The maximum rPAM discriminative capacity was at 1 year (1-year AUC of 58.2 %). The predictive capacity of the EBMT score was not demonstrated. This study validates the discrimination capacity for OS prediction of KPS, HCT-CI, DRI and EASIX in PTCy-based allo-HCT.
Prognosis scores predictors of transplant outcomes support clinical decisions in allogeneic hematopoietic cell transplantation (allo-HCT).1,2 The most widely used prognostic scores in clinical practice include the Karnofsky Performance Status (KPS) and the Hematopoietic Cell Transplantation-Specific Comorbidity Index (HCT-CI).3,4 The Disease Risk Index (DRI),5 the European Bone Marrow Transplantation (EBMT) and the Pre-transplantation Assessment of Mortality (PAM) Scores are alternative prognostic tools often used by different transplant institutions.6,7 More recently, the Endothelial Activation and Stress Index (EASIX) has been proposed as a predictor of transplant outcomes when evaluated before allo-HCT.8
Post-transplant cyclophosphamide (PTCy), generally in combination with other immunosuppressant agents, provides an effective prevention of clinically relevant graft versus host disease (GvHD).9 Secondary to its efficacy, the use of PTCy is expanded to allo-HCT independently of the selected donor source.10-12 The PTCY-based allo-HCT has resulted in a novel transplant platform that induces a specific T-cell depletion immunosuppressant effect and transplant-related toxicities, a different infectious risk profile.13,14 Consequently, different studies have been conducted exploring whether the use of this novel prophylaxis impacts on relapse risks and transplant success with inconsistent results.15-18
The prognostic indices listed above were defined and validated in cohorts of patients transplanted using non-PTCy-containing GvHD prophylaxis.3-8 As the use of PTCy for GvHD prophylaxis is becoming more widespread in the transplant community, the present study investigates whether the predictive capacity/power of these prognostic indices remains adequate in a contemporary cohort of adults undergoing allo-HCT and PTCy for GvHD prevention.
MethodsIndices applicationPrognostic scores were calculated for each patient using the definitions and following the methodology described in the original publications.3-8 The KPS and HCT-CI were evaluated as part of our clinical practice, executed by expert allo-HCT physicians. The DRI, EBMT, rPAM and EASIX scores were calculated retrospectively using data from clinical charts. The PAM score was calculated using the simplified version published in 2015 [revised PAM score (rPAM score)]7 and the EASIX score was calculated based on the information provided from bloodwork collected during pre-transplant assessments (between days −30 and −7 before allo-HCT).
Patient selectionBetween January 2014 and February 2021, 205 consecutive adults with hematological malignancies underwent their first peripheral blood allo-HCT combined with PTCy-based GvHD prophylaxis at our Institution. Eligibility criteria for allo-HCT are detailed in the Supplementary Material. Clinical information was collected retrospectively and updated in January 2022. This study was approved by the Ethics Committee of the Hospital Clinic de Barcelona, Spain and was performed in accordance with standards set by the Declaration of Helsinki.
Conditioning regimen, graft characteristics and GVHD prophylaxisMyeloablative conditioning (MAC) regimens generally combined high-dose of busulfan (3.2 mg/kg/day intravenously (IV) × four days) or 12 Gy of total body irradiation (TBI) with fludarabine (30 mg/m2/day IV × four days). The majority of reduced-intensity conditioning (RIC) regimens contained lower doses of busulfan (3.2 mg/Kg/day IV × three days), or 8 Gy of TBI combined with standard doses of fludarabine.
Between January 2014 and May 2015, the Institutional standard GvHD prophylaxis consisted of PTCy 50 mg/kg/day administered on days +3 and +4, followed by mycophenolate mofetil (MMF) from day +5 to day +28, and tacrolimus (TK) started on day +5 at a dose of 0.04/kg/day IV, maintained therapeutically until day +90, and tapered down progressively up to day +120, in the absence of GvHD. Since June 2015, the standard GvHD prophylaxis out of the haplo-HCT setting was modified to PTCY and TK (PTCY-TK). Information related to graft source, infectious prophylaxis and supportive care is reported in the Supplementary Material.
Statistical methodsThe overall survival (OS) and non-relapse mortality (NRM) were considered the main outcome variables. The main explanatory variables were KPS, HCT-CI, DRI, EBMT score, rPAM and EASIX. Patients were grouped into two risk groups of high- and low-risk strata. This classification was made based on the optimal cutoff value for each score and for the main outcome variable: OS. The cutoff value was calculated using maximally selected rank statistics. In the case of EASIX and following standard practices in the literature, the original value of the index was transformed to a base-2 logarithm value (log2-EASIX) to perform the statistical analysis.
The OS was calculated using the Kaplan-Meier estimator method and the NRM was estimated using the cumulative incidence method, considering relapse as a competing event. The score prediction ability for the OS and NRM was first explored during the entire post-transplant follow-up across the entire cohort and in each of the scores independently, using the concordance index (C-index). This index confirms the predictive power of the evaluated score for values superior to 0.5 with the perfect discrimination of the value of 1.19 The prognostic indices were compared using the reclassification calibration statistic goodness-of-fit applied to reclassified categories. This method compares the proportions of patients whose estimated risk shifts in the correct and wrong directions based on a χ2 goodness-of-fit test within reclassified categories for each score. In this setting, a p-value > 0.05 indicates a good fit.20 Diagnostic accuracy measures (sensitivity, specificity and predictive values) were calculated at 2 years.
The impact of the explanatory variables on the OS and NRM and the prediction ability of the five scores were analyzed using the regression analysis and C-index, respectively, and censoring the post-transplant follow-up at the following time points after the allo-HCT: 3 months, 6 months, 1 year and 2 years. The score discrimination was additionally evaluated using the inverse probability of censoring weighting estimation of cumulative time-dependent receiver operating characteristic (ROC) curves and, from them, calculating the area under the curve (AUC) at each time-point. The perfect discrimination corresponds to an AUC of 1.0, meaning that the predicted risk for all individuals who developed the outcome was higher than that for all individuals who did not experience the outcome. An AUC of 0.5 is indicative of an equal probability of risk assigned to individuals who experience the outcome and to individuals who did not, i.e., the prediction is purely random.21 The p-values were two-sided. For statistical analyses, p < 0.05 was considered to indicate a statistically significant result. Statistical analysis was performed using the R.3.6.1 software (R Foundation for Statistical Computing, Vienna, Austria, http://www.R-project.org).
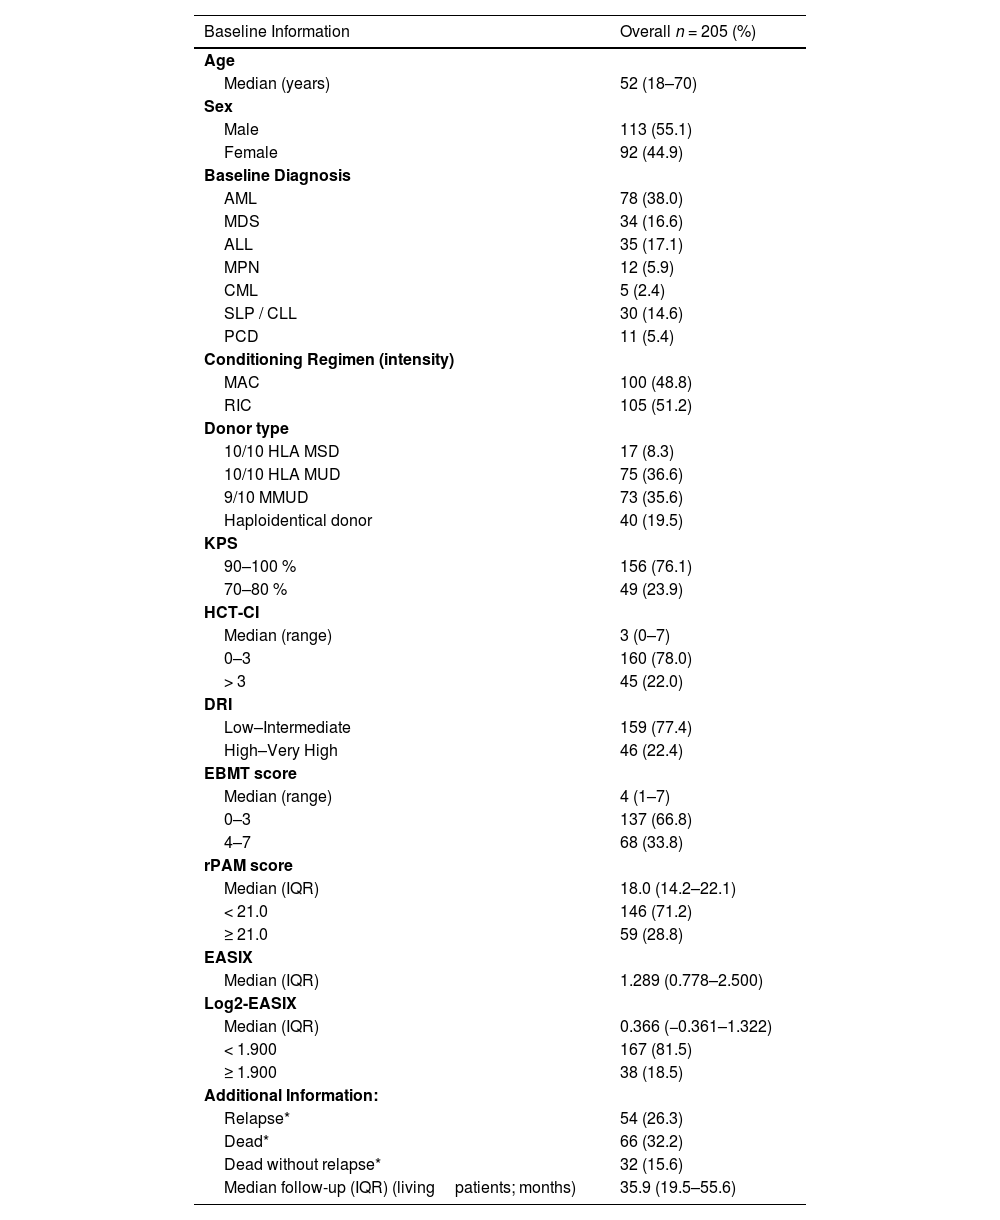
ResultsPatient characteristics and outcome informationAs shown in Table 1, the patients’ median age was 52 years (range: 18 - 70), acute myeloid leukemia (38.0 %) was the most prevalent baseline diagnosis, 51.2 % of adults underwent the RIC allo-HCT and 72.2 % of patients received grafts from unrelated donors (UDs), while 19.5 % received from haploidentical donors.
Main baseline information.
| Baseline Information | Overall n = 205 (%) |
|---|---|
| Age | |
| Median (years) | 52 (18–70) |
| Sex | |
| Male | 113 (55.1) |
| Female | 92 (44.9) |
| Baseline Diagnosis | |
| AML | 78 (38.0) |
| MDS | 34 (16.6) |
| ALL | 35 (17.1) |
| MPN | 12 (5.9) |
| CML | 5 (2.4) |
| SLP / CLL | 30 (14.6) |
| PCD | 11 (5.4) |
| Conditioning Regimen (intensity) | |
| MAC | 100 (48.8) |
| RIC | 105 (51.2) |
| Donor type | |
| 10/10 HLA MSD | 17 (8.3) |
| 10/10 HLA MUD | 75 (36.6) |
| 9/10 MMUD | 73 (35.6) |
| Haploidentical donor | 40 (19.5) |
| KPS | |
| 90–100 % | 156 (76.1) |
| 70–80 % | 49 (23.9) |
| HCT-CI | |
| Median (range) | 3 (0–7) |
| 0–3 | 160 (78.0) |
| > 3 | 45 (22.0) |
| DRI | |
| Low–Intermediate | 159 (77.4) |
| High–Very High | 46 (22.4) |
| EBMT score | |
| Median (range) | 4 (1–7) |
| 0–3 | 137 (66.8) |
| 4–7 | 68 (33.8) |
| rPAM score | |
| Median (IQR) | 18.0 (14.2–22.1) |
| < 21.0 | 146 (71.2) |
| ≥ 21.0 | 59 (28.8) |
| EASIX | |
| Median (IQR) | 1.289 (0.778–2.500) |
| Log2-EASIX | |
| Median (IQR) | 0.366 (−0.361–1.322) |
| < 1.900 | 167 (81.5) |
| ≥ 1.900 | 38 (18.5) |
| Additional Information: | |
| Relapse* | 54 (26.3) |
| Dead* | 66 (32.2) |
| Dead without relapse* | 32 (15.6) |
| Median follow-up (IQR) (living patients; months) | 35.9 (19.5–55.6) |
AML: Acute Myeloid Leukemia; MDS: Myelodysplastic Syndrome; ALL: Acute Lymphoblastic Leukemia; MPN: myeloproliferative neoplasm; CML: Chronic Myeloid Leukemia; NHL: Non-Hodgkin Lymphoma; CLL: Chronic Lymphocytic Leukemia: PCL: Plasma Cell Disorders; MSD: Matched-Sibling Donor: MUD: Matched Unrelated Donor: MMUD: Mismatched Unrelated Donor: KPS: Karnofsky Performance Status; HCT-CI: Hematopoietic Cell Transplantation specific Comorbidity Index; DRI: Disease Risk Index; EBMT: European Society for Blood and Marrow Transplantation; rPAM: Revised Pre-transplantation Assessment of Mortality; EASIX: Endothelial Activation and Stress Index. IQR: Interquartile Range.
Of the 205 patients included, 202 (98.5 %) were primary engrafted. Three (1.4 %) patients had moderate-severe sinusoidal obstruction syndrome (SOS) and 9 (4.4 %), thrombotic microangiopathy (TMA). The cumulative incidences of grades II to IV and grades III to IV acute GvHD at day +100 were 24.4 % (95 %CI 18.7–30.5) and 4.9 % (95 %CI 2.5–8.4), respectively, while those of moderate/severe chronic GvHD at 2 years was 7.6 (95 % CI 4.2–12.2). With a median follow-up among surviving patients of 35.9 months, 54 (26.3 %) patients relapsed and 66 (32.2 %) died. The main causes of death were relapse (34 patients, 16.6 %) and infection (13 patients, 6.3 %). The estimated 2-year OS, NRM, relapse-free survival and cumulative incidence of relapse were, respectively, 69.9 % (95 %CI 62.8–76.0), 16.1 % (95 %CI 11.4–21.6), 57.5 % (50.1 %–64.2 %) and 26.3 % (95 %CI 20.3–32.8).
Clinical scoring systems distributionBased on the result obtained from the five clinical risk-scoring indices, patients were categorized into two risk groups (high-risk and low-risk) based on the optimal cutoff value for the OS prediction determined using maximally selected rank statistics. As shown in Table 1, according to the KPS, 49 (23.9 %) patients were classified into the high-risk group (KPS values: 70–80 %). According to the HCT-CI, the number of high-risk (HCT-CI: > 3) patients was 45 (22.0 %). Regarding the DRI, 46 (22.4 %) patients were classified into the high-risk group (DRI: high or very high risk) and, according to the EBMT score, 68 (33.8 %) adults were considered high-risk (EBMT score: ≥ 4). The optimal cutoff value of the rPAM score for the prediction of the OS was ≥ 21.0 (Supplementary Figure 1) and 59 (28.8 %) adults were classified into the high-risk group. Lastly, 38 (18.5 %) patients with log-2 EASIX ≥ 1.900 (pre–logarithmic transformed EASIX equivalent value ≥ 3.800) were classified into the high-risk group (Supplementary Figure 2).
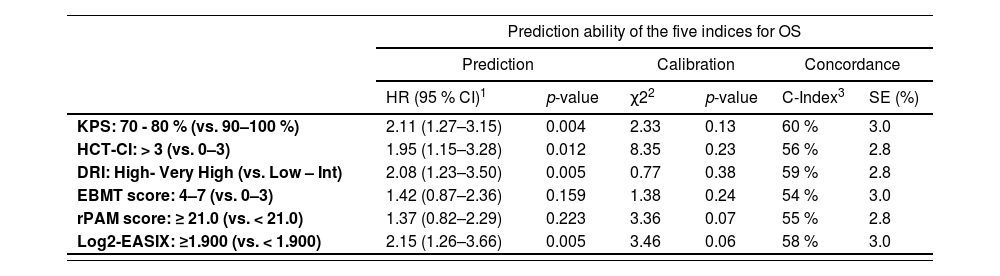
Predictive power and discrimination capacity of the different scoring systems for overall survivalAs shown in Table 2 and Figure 1, the classifications of patients in the high- and low-risk strata according to the KPS, HCT-CI, DRI and EASIX indices for the prediction of the OS were statistically significant during the entire post-transplant period. In terms of hazard ratios (HRs) and according to the KPS, high-risk adults were 2.11 (p = 0.004) times more likely to die secondary to any cause than low-risk adults. According to the DRI, patients classified as high-risk were 2.04 (p = 0.005) times more likely to die than low-risk patients. The estimated HR for mortality of high-risk adults according to the HCT-CI index (score > 3) was 1.95 (p = 0.012) and the probability of mortality was 2.15 times superior for patients with an EASIX value ≥ 3.800 (log2-EASIX ≥ 1.900). According to the C-index value, the ranking of indices in terms of the predictive power of overall mortality, from high to low, was as follows: first the KPS (C-value 60 %), DRI (C-value 58 %), EASIX (C-value 58 %), HCT-CI (C-value 56 %), rPAM (C-value 55 %) and EBMT score (C-value 54 %).
Prediction ability of the selected indices for overall survival and non-relapse mortality during the entire post-transplant follow-up.
| Prediction ability of the five indices for OS | ||||||
|---|---|---|---|---|---|---|
| Prediction | Calibration | Concordance | ||||
| HR (95 % CI)1 | p-value | χ22 | p-value | C-Index3 | SE (%) | |
| KPS: 70 - 80 % (vs. 90–100 %) | 2.11 (1.27–3.15) | 0.004 | 2.33 | 0.13 | 60 % | 3.0 |
| HCT-CI: > 3 (vs. 0–3) | 1.95 (1.15–3.28) | 0.012 | 8.35 | 0.23 | 56 % | 2.8 |
| DRI: High- Very High (vs. Low – Int) | 2.08 (1.23–3.50) | 0.005 | 0.77 | 0.38 | 59 % | 2.8 |
| EBMT score: 4–7 (vs. 0–3) | 1.42 (0.87–2.36) | 0.159 | 1.38 | 0.24 | 54 % | 3.0 |
| rPAM score: ≥ 21.0 (vs. < 21.0) | 1.37 (0.82–2.29) | 0.223 | 3.36 | 0.07 | 55 % | 2.8 |
| Log2-EASIX: ≥1.900 (vs. < 1.900) | 2.15 (1.26–3.66) | 0.005 | 3.46 | 0.06 | 58 % | 3.0 |
| Prediction ability of the five indices for NRM | ||||||
|---|---|---|---|---|---|---|
| HR (95 % CI)1 | p-value | Statistic2 | p-value | C-Index3 | SE | |
| KPS: 70–80 % (vs. 90–100 %) | 3.24 (1.61–6.51) | < 0.001 | 2.62 | 0.11 | 65 % | 4.4 |
| HCT-CI: >3 (vs. 0–3) | 1.37 (0.64–2.92) | 0.40 | 0.98 | 0.32 | 53 % | 3.8 |
| DRI: High- Very High (vs. Low – Int) | 1.90 (0.92–3.89) | 0.079 | 2.18 | 0.14 | 56 % | 4.0 |
| EBMT score: 4–7 (vs. 0–3) | 1.52 (0.78–3.10) | 0.20 | 2.12 | 0.15 | 55 % | 4.0 |
| rPAM score: ≥ 21.0 (vs. < 21.0) | 1.76 (0.87–3.54) | 0.110 | 0.04 | 0.85 | 57 % | 4.0 |
| Log2-EASIX: ≥ 1.900 (vs. < 1.900) | 3.32 (1.66–6.64) | < 0.001 | 0.74 | 0.39 | 61 % | 4.0 |
KPS: Karnofsky Performance Status; HCT-CI: Hematopoietic Cell Transplantation Specific Comorbidity Index; DRI: Disease Risk Index; EBMT: European Society for Blood and Marrow Transplantation; rPAM: Revised Pre-Transplantation Assessment of Mortality; EASIX: Endothelial Activation and Stress Index.
 and Non-Relapse Mortality (Second Row) Based on the Clinical Scoring System Distribution.")
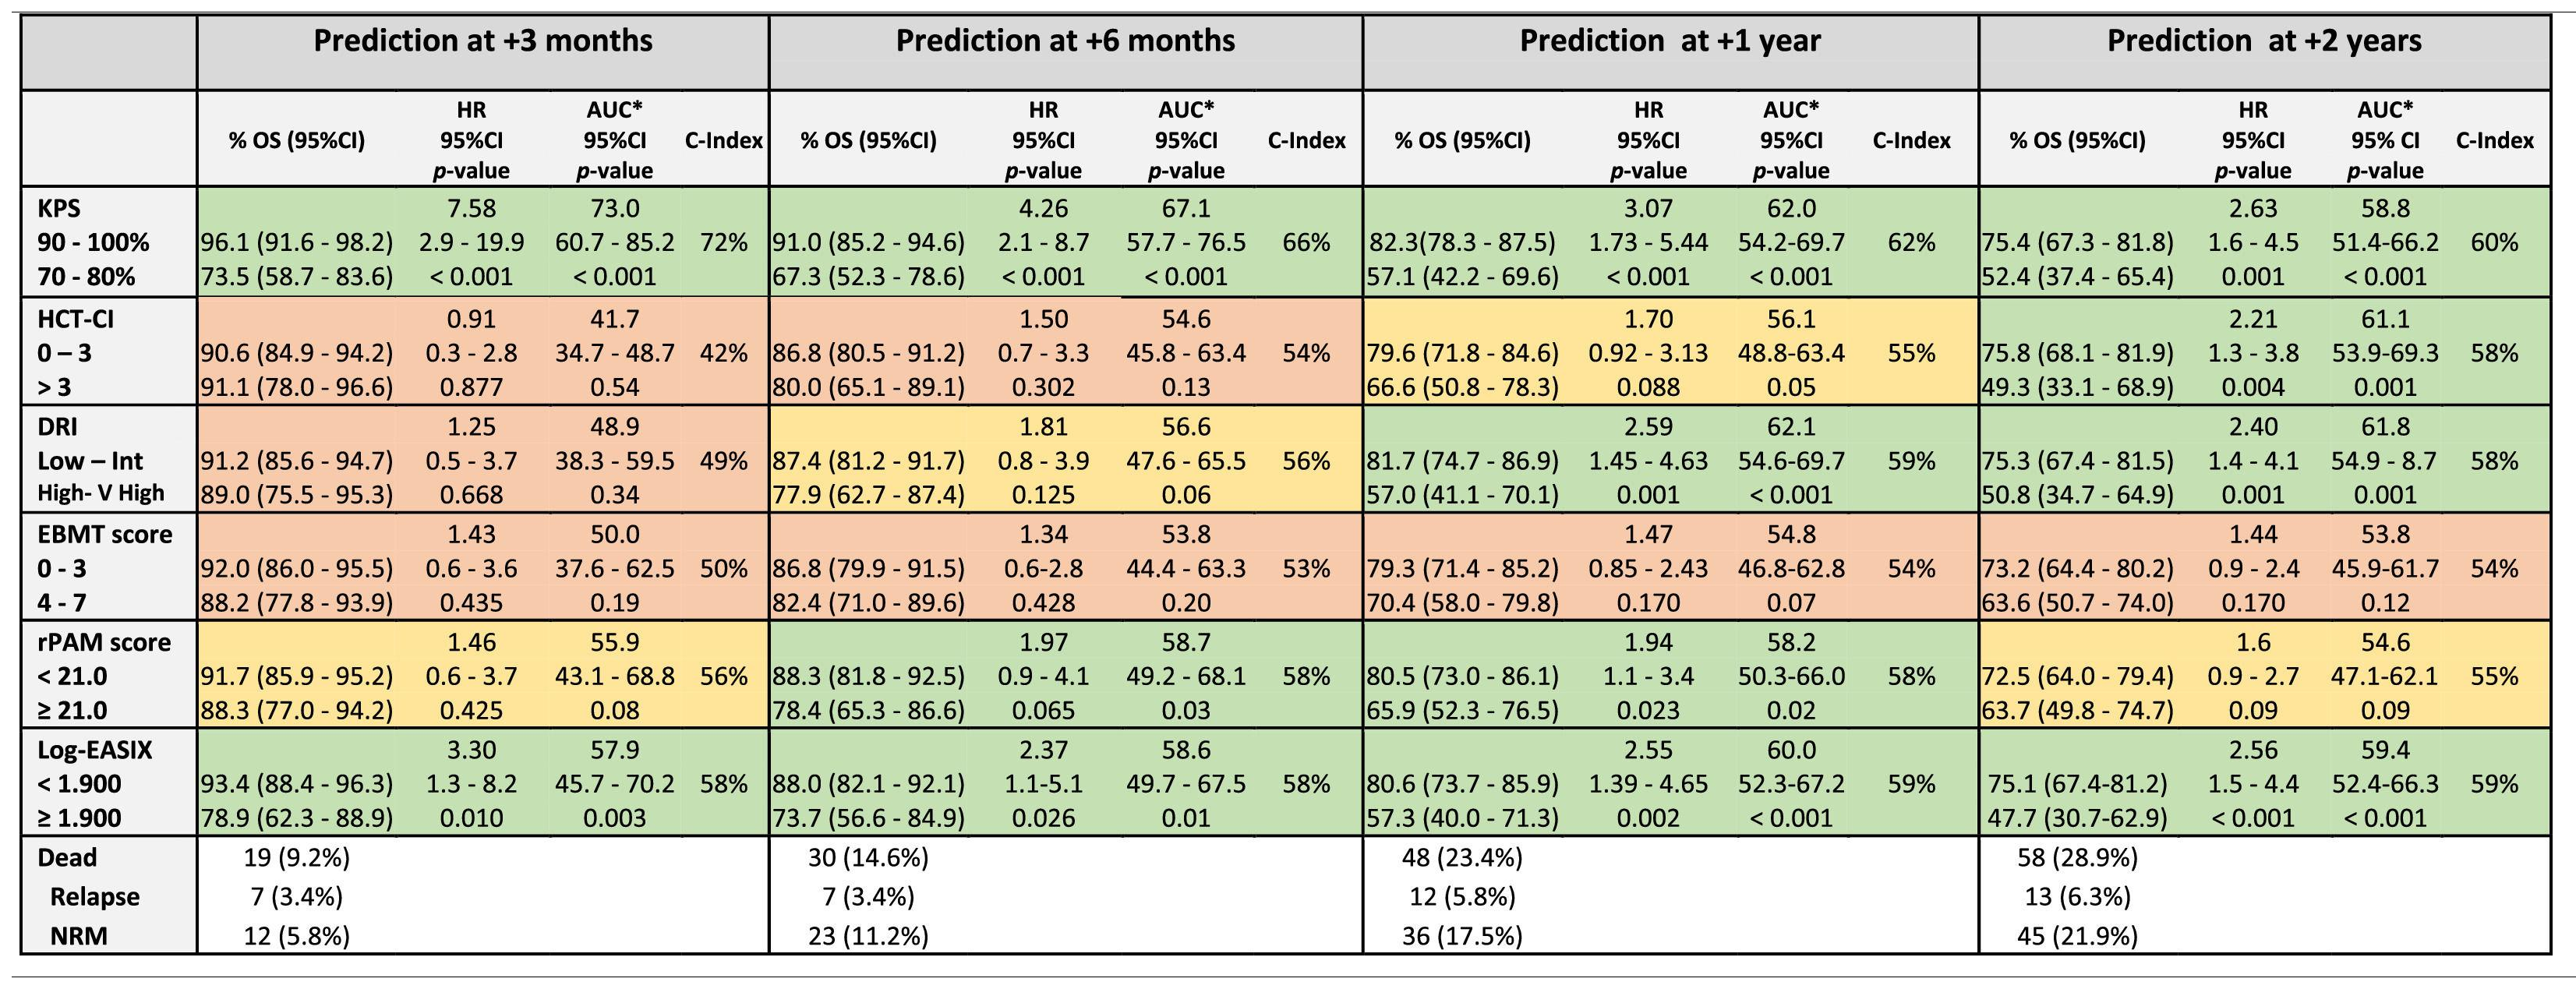
The discrimination capacity for the OS at 100 days, 6 months, 1 year, and 2 years is summarized in Table 3 and Figure 2. The KPS and EASIX maintained an appropriate discrimination during the four-time points evaluated after the allo-HCT, with values of the AUC-statistic higher than 55 %. The discriminative ability of the DRI and HCT-CI was low at day +100 (AUC values inferior to 50 %) and increased progressively during the post-transplant period, with a peak of discriminative capacity at 2 years (AUC equal to 61.1 % and 61.8 %, respectively). The rPAM showed an acceptable discrimination capacity during the first year after the allo-HCT (AUC increasing from 55.9 % at day +100 to 58.7 % and 58.2 % at 6 months and 1 year), decreasing to as low as 54.6 % at 2 years. These results were consistent with those obtained in the Cox regression analysis as the criterion for statistical significance and the C-value. Lastly, the predictive capacity for the OS of the EBMT score was neither demonstrated during the entire post-transplant period nor at the different time points after the allo-HCT.
Prediction ability of the six indices for overall survival predicted at different time-points after allo-HCT.

Legend: The prediction ability of each score was analyzed in the entire cohort and independently. Each time period accounts for the sum of events documented from day 0 to day +100, day 180, day +365 and day +730. Green color: Good prediction (C-Index ≥ 58 %), Yellow color: Acceptable prediction (C-Index > 55 % - < 58 %), Red color: Inaccurate prediction (C-Index ≤ 55 %). *ROC curve: Null hypothesis: true area = 0.5.

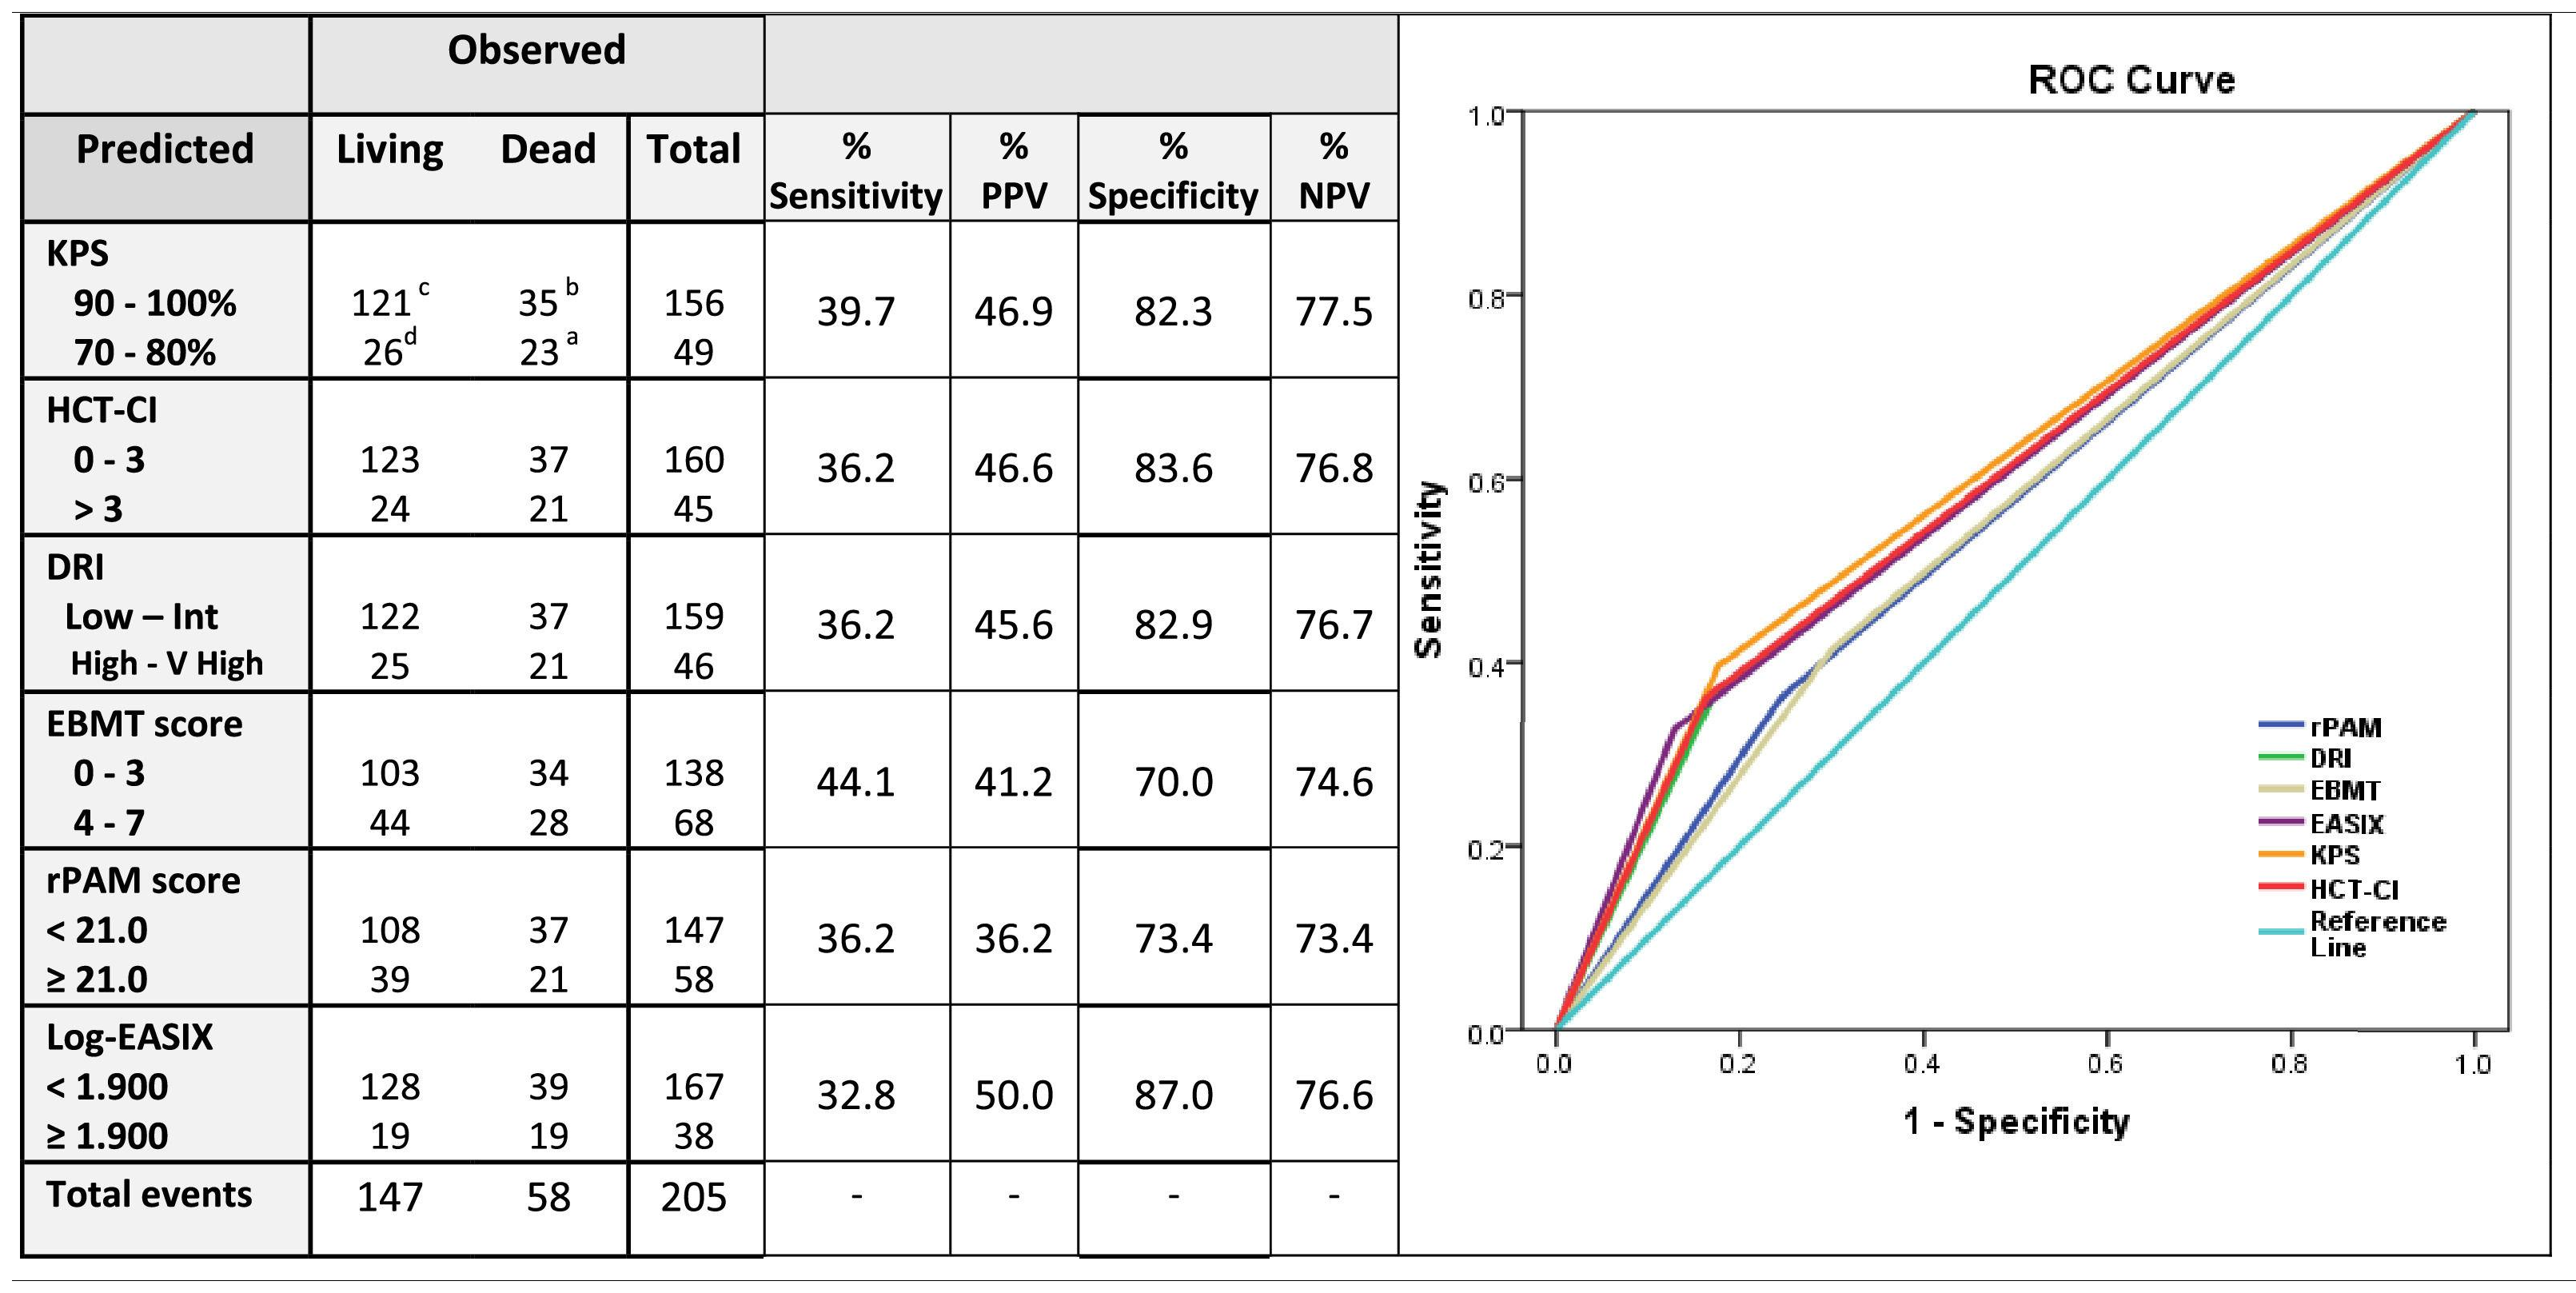
Sensitivity and specificity, together with the positive predictive values (PPVs) and negative predictive values (NPVs) were calculated for the prediction of the 2-year OS for each score independently (Table 3). The estimated sensitivity of each score was inferior to 40 %, except for the EBMT score, which was 44.1 %. The EASIX score, followed by the KPS and HCT-CI, had the highest PPV values (50 %, 46.9 % and 46.6 %, respectively) and the rPAM and the EBMT scores, the lowest (36.2 % and 36 %, respectively). The EASIX, HCT-CI, KPS and DRI were the more specific predictive tools, with proportions superior to 80 % (87 %, 83.6 %, 82.9 % and 82.3 %, respectively) and all these four scales presented an NPV higher than 75 % (76.6 %, 76.8 %, 77.5 % and 76.8 %, respectively) (Table 4).
Sensitivity, positive predictive value, specificity and negative predictive value of each index for the prediction of 2-year overall survival.

Legend: If a predictive tool is less sensitive, risk of mortality can be overestimated (Type I error). If a test less is specific, risk of mortality can be underestimated (Type II error); for these reasons, the present table explores the sensitivity, predictive positive value, specificity and predictive negative value of the selected five prognostic scales for the prediction of mortality at 2 years.
Sensitivity: ability of a screening test to detect a true positive. It refers to the proportion of those who have the condition that received a positive result on this test. Calculation: number of true positives / number of true positives + number of false negatives. Formula:% Sensitivity= [a/(a + b)] × 100. Positive Predictive Value (PPV): probability that people with a positive screening test result indeed do have the condition of interest. Calculation: Truly classified as high-risk/Total predicted as high-risk. Formula: % PPV= [a/(a + d)] × 100.
Specificity: ability of a screening test to detect a true negative. It refers to the proportion of those who do not have the condition that received a negative result on this test. Calculation: number of true negatives/number of true negatives + number of false positives. Formula:% Specificity= [c/(c + d)] × 100. Positive Predictive Negative (PPN): probability that people with a negative screening test result indeed do not have the condition of interest. Calculation: Truly classified as high-risk/Total predicted as high-risk. Formula: % PPN= [c/(c + b)] × 100.
Needs to be checked!!!.
The predictive ability of the five scores was additionally calculated for the prediction of the NRM across the entire cohort and in each of the scores independently. The study cohort was stratified into the same two groups defined for the prediction of the main outcome variable, the OS. In the case of the EASIX and rPAM, the cutoff values for the prediction of the NRM were re-calibrated and were found to be close to those defined for the prediction of the OS. For this reason, as well as to increase the clinical application of the conclusions obtained from the present study, the cutoff values for the EASIX and rPAM were maintained at 3.800 (log2-EASIX 1.900) and 21.0, respectively (Supplementary Figures 1 and 2).
As shown in Table 2 and Figure 1, the KPS and EASIX grouped patients into higher and lower risk strata, supporting their use for risk classification for the prediction of the NRM and during the entire post-transplant period. According to the KPS, high-risk adults were 3.24 (p < 0.001) times more likely to die secondary to transplant-related toxicity than low-risk adults. The estimated HR for transplant-related mortality of high-risk adults, according to the EASIX (log2-EASIX > 1.900), was 3.32 (p < 0.001). Additionally, high-risk adults, according to the DRI, were found to present a non-significant trend to a higher NRM, compared to low-risk patients (HR 1.90, p = 0.079). According to the C-index, the ranking of indices in terms of the predictive power of the NRM from high to low was the KPS (65 %), EASIX (61 %), rPAM (57 %), DRI (56 %) EBMT score (55 %) and HCT-CI (53 %).
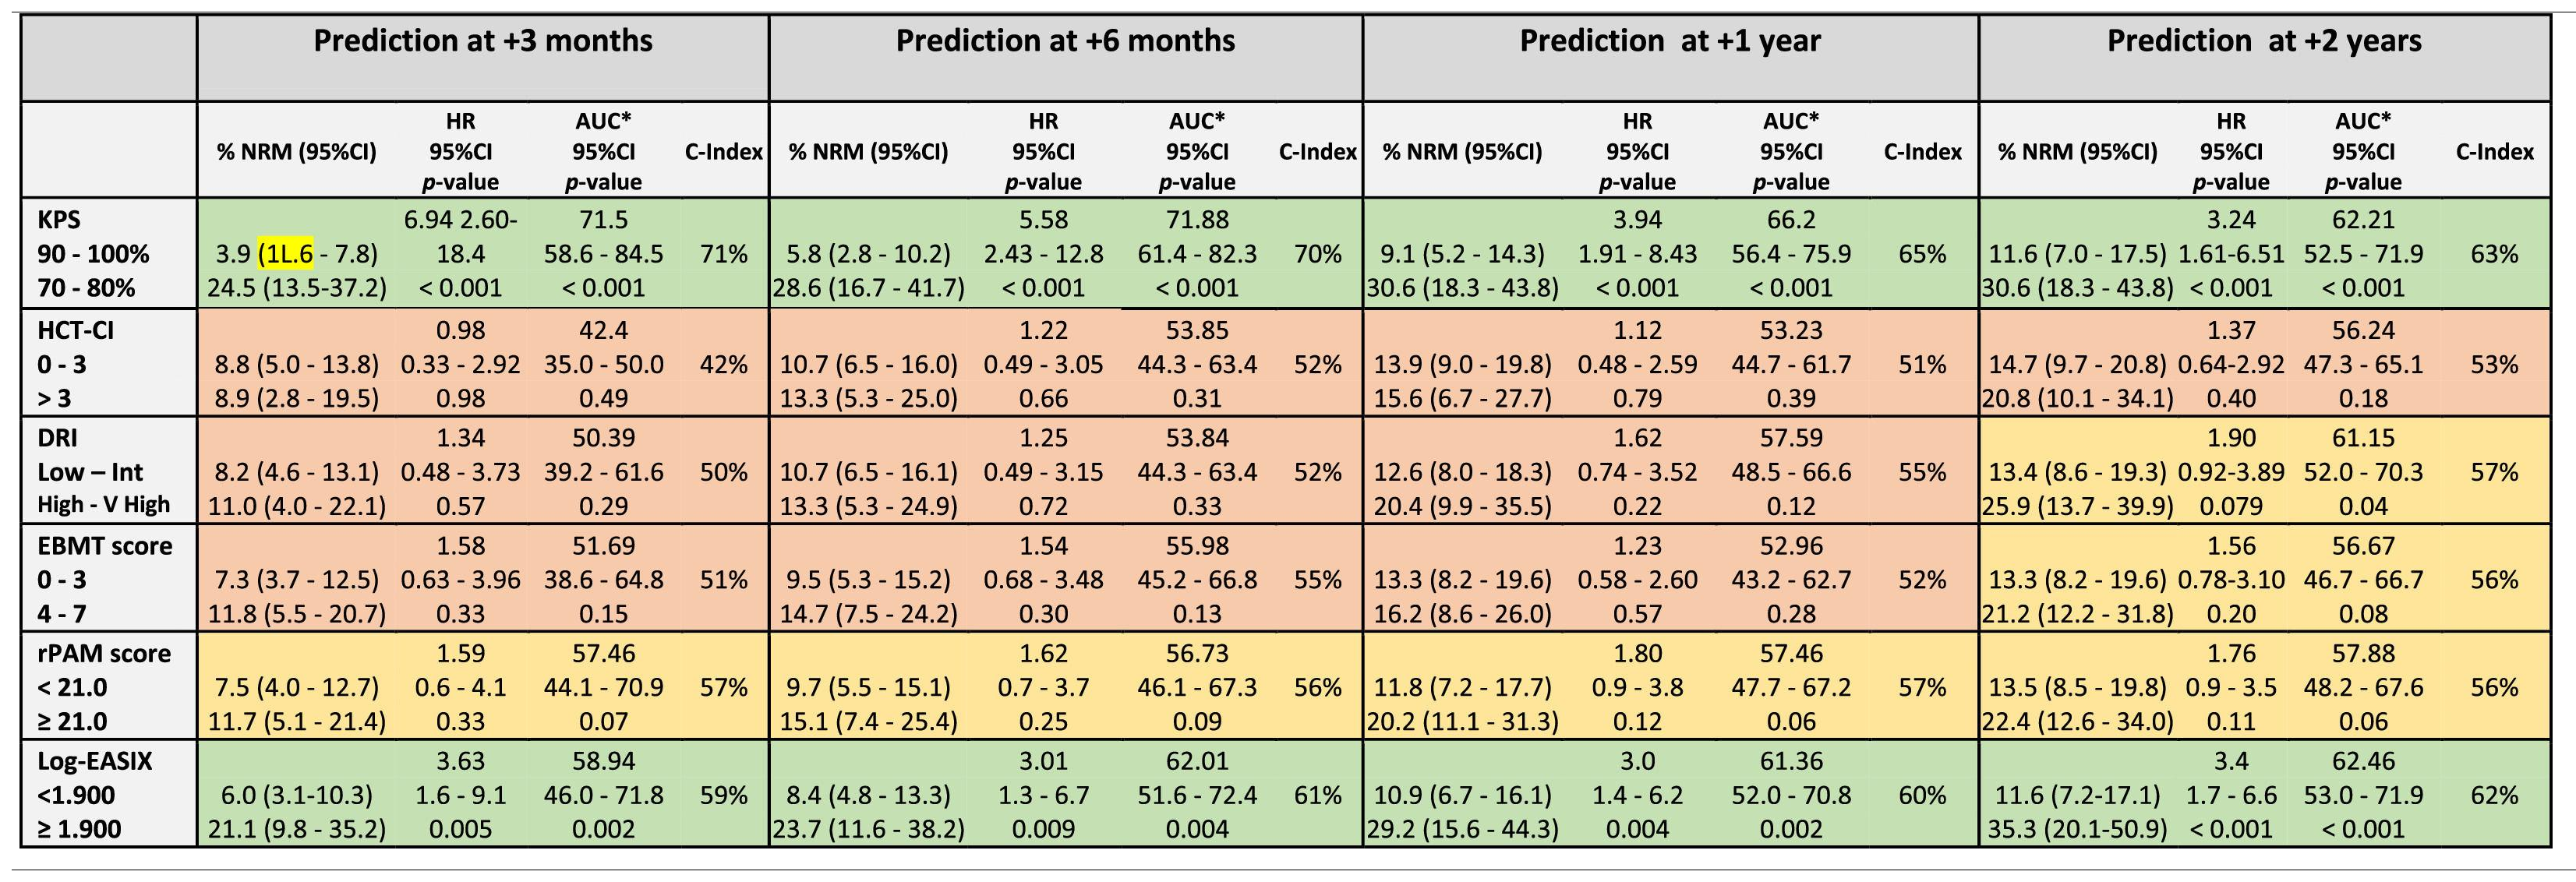
The KPS and EASIX maintained an appropriate predictive capacity of NRM during the four time points evaluated during the first 2 years after the allo-HCT and with values of the AUC-statistic higher than the cutoff value of 55 % (Table 5, Figure 2). The KPS was the most accurate prognostic index for the NRM, with an estimated median of AUC ranges > 60 % during the post-transplant period and with a peak of prediction at day +100 and +180 (AUC 71.8 % and 66.2 %, respectively). The rPAM showed an acceptable discrimination capacity at day +180 (AUC of 55.9 %) and at 2 years (56.6 % at 2 years) after the allo-HCT for the prediction of the NRM. In addition, the DRI, HCT-CI and EBMT score were not appropriate predictors for the NRM during the post-transplant period. These results were consistent with those obtained when using the cumulative incidence regression analysis as the criterion for the statistical significance and C-Index.
Prediction ability of the six indices for non-relapse mortality predicted at different time-points after allo-HCT.

Legend: The prediction ability of each score was analyzed in the entire cohort and independently. Each time period accounts for the sum of events documented from day 0 to day +100, day 180, day +365 and day +730. Green color: Good prediction (C-Index ≥ 58 %), Yellow color: Acceptable prediction (C-Index > 55 % - < 58 %), Red color: Inaccurate prediction (C-Index ≤ 55 %).
Secondary to its efficacy, the use of PTCy for GvHD prevention is expanding from the haplo-HCT to matched sibling and UD allo-HCT with notable success.22 This retrospective analysis validates the discrimination capacity for the OS prediction of the KPS, HCT-CI, DRI and EASIX in the PTCy-based allo-HCT and supports their use in clinical practice.
The KPS and HCT-CI maintained an appropriate discriminative ability for the OS prediction, supporting its use as prognostic predictors in the PTCy-containing allo-HCT. When patients were classified into two risk groups, according to the KPS, high-risk patients continued to be those with scores ≤ 80 %. This result correlated with the cutoff used in clinical practice and in different studies performed with cohorts of patients receiving other GvHD prophylaxis.3,23 In the case of the HCT-CI, the most accurate cutoff value for high-risk classification was found to be > 3 and those patients presented a 2-year OS and NRM expected probability of 49.3 % and 20.8 %, respectively. Notably, this cutoff differed in 1 point from the original cutoff proposed by Sorror et al. for the classification of patients into the highest risk group, which was defined as > 2.24 The prognostic utility of the HCT-CI has been progressively validated by different investigators simultaneously with the expansion of the allo-HCT.25,26 Nevertheless, the predictive ability of the HCT-CI for the PTCy-containing allo-HCT has not been explored in detail. This analysis suggests that high-risk patients, according to the HCT-CI, would be more appropriately classified if the cutoff used for discrimination be > 3. However, this result needs to be validated in an external cohort of patients transplanted using the PTCy-containing GVHD prophylaxis.
Interestingly, the KPS showed the highest discrimination capacity at day +100 (AUC: 73 %) and subsequently decreased to as low as 58.8 % at 2 years. In contrast, the HCT-CI discrimination ability for the OS increased from low to high during the post-transplant follow-up, with a peak of prediction at 2 years (AUC 61.8 %). Notably, the KPS prediction accuracy was higher during the early post-transplant period, when the patient fitness was probably still impacted by the underlying hematological disorder. However, and based on these results, comorbidities seemed to have more relevance in the patent long-term survivorship, as they persist in the individual during the post-transplant follow-up.
According to the DRI, high-risk patients had a higher risk of mortality, compared to low-risk patients. The DRI, developed only for the primary outcome of the OS evaluated at 2 years after the allo-HCT, is a validated tool to categorize groups of patients undergoing the allo-HCT by disease risk. This prognostic tool unifies a unique variable impact of disease risk and status before the allo-HCT, mainly for research purposes, stratifying patients in broad disease risk categories for retrospective or prospective studies.5 The prediction ability of the DRI for the OS has been validated by different investigators.27,28 Similar to the results reported in the original and other publications, the DRI was not found to be a predictor for the NRM in our analysis and the discriminative ability of the DRI for the OS prediction increased progressively during the post-transplant period with a peak of prediction at 2 years after the HCT. The result of this study supports that disease-related information prior to the allo-HCT remains to be relevant for the OS prediction in patients receiving the PTCy-based GvHD prophylaxis.
The EASIX is a biomarker-based laboratory formula and considered a surrogate parameter of endothelial activation.29 This index was first designed to predict mortality in patients with acute GvHD and, consecutively, the prognostic utility of this index evaluated before allo-HCT was validated for the prediction of the NRM and OS.8 This study shows that the EASIX was an accurate predictor for the OS and NRM in the allo-HCT using the PTCy-based GVHD prophylaxis. Notably, the predictive accuracy of the EASIX for the OS and NRM estimation persisted stable during the post-transplant period, even though this index was evaluated only once and based on the information provided in the bloodwork performed during the pre-transplant evaluation, as well as taking into consideration the low rates of the SOS, TMA and clinically relevant acute GvHD diagnosed in patients included in the study cohort. This result significantly increases the utility of this new index and enhances the relevancy of the endothelium in the estimation of the probability of presenting post-transplant complications in the allo-HCT using PTCy-containing GvHD prophylaxis. Higher EASIX scores have been associated with an increased risk of mortality. The optimal cutoff valuable for the patient risk classification has not been yet determined. Based on the results provided by this analysis, the best cutoff for the patient risk distribution into two independent groups was 3.90 (log2-EASIX: 1.90). Nevertheless, this value needs to be externally validated in an independent cohort of patients undergoing the allo-HCT and receiving PTCy for GVHD prevention.
Revised PAM and EBMT scores are two composite prognostic indices based on transplant-related factors, patient baseline information and disease-related information.6,7 The original PAM score was developed in 2006 based on clinical information provided by adults undergoing the allo-HCT between 1990 and 2002 and further refined and recalibrated in 2015 (revised PAM) after exploring its predictive ability at 2 years after the allo-HCT landmark in the cohort of patients transplanted between 2006 and 2009. The revised PAM score was validated for the prediction of the 2-year mortality after the allo-HCT in a cohort of patients transplanted between 2011 and 2015.25 In our study, the rPAM was shown to exhibit maximal predictive ability for the OS and NRM 1 year after the allo-HCT (1-year AUC: 58 % and 57 %, respectively) and decreased at the 2-year timepoint landmark after the allo-HCT (2-year AUC: 55 % and 56 %, respectively) (Figures 1 and 2), differing from what has been reported in previous analyses.25
The EBMT score was designed in 1998 to predict mortality in patients with chronic myeloid leukemia undergoing the allo-HCT, consecutively, extended for outcome prediction to a broad range of acquired hematological disorders.6 The prognostic capacity of the EBMT score has not been demonstrated in our study. Based on these results, the impact of the 5 clinical variables comprising the EBMT score was explored individually (Supplementary Table 1 and Supplementary Figure 3) and none of the explanatory variables included in the univariate model were found to be significant predictors for the OS. These results bolster the findings reported in the present analysis. Nevertheless, the results provided by the present analysis have to be interpreted carefully and need to be validated externally in a larger cohort of patients transplanted using the PTCy for GvHD prevention.
The specificity and sensitivity30,31 of each index were calculated for the estimation of the 2-year OS. The EASIX, HCT-CI, KPS and DRI specificities and negative predictive values were higher than 80 % and 75 %, respectively, therefore, suggesting that these prognostic tools had a capability to correctly assign a low probability of mortality to patients classified as low-risk patients by the index superior to 80 %. Interestingly, the estimated sensitivity of most of the selected prognostic tools was less than 40 %. This result suggests that only 40 % of patients classified in the high-risk group will die during the first two years after the allo-HCT. These results enhance how sensitivity and specificity of each score should be carefully considered when these indices are used for decision-making, especially for patients classified into the high-risk group, as more than 50 % of these patients would potentially survive after the allo-HCT.
The main limitations of the study were the retrospective nature of the analysis and the relatively limited sample size. Additionally, the study cohort was selected from a single institution, limiting the extrapolation of the conclusions provided by this analysis to other Allo-HCT Programs and needing an external validation of the results to further confirm the findings reported in this analysis.
ConclusionIn conclusion, this analysis explores the applicability and the predictive ability of the KPS, HCT-CI, DRI and EASIX for the OS prediction in a cohort of patients undergoing the allo-HCT, using the PTCy-containing GvHD prophylaxis from a single institution. Based on the findings of this analysis, the authors encourage other centers to undertake similar internal analyses to further confirm the results provided in the present analysis and to avoid under or over-risk estimations.
We thank our patients and the nursing and support staff in the Hematopoietic Cell Transplant Program at the Hospital Clinic de Barcelona.
Funding: There is no funding to declare.


