


The most common microcytic and hypochromic anemias are iron deficiency anemia and thalassemia trait. Several indices to discriminate iron deficiency anemia from thalassemia trait have been proposed as simple diagnostic tools. However, some of the best discriminative indices use parameters in the formulas that are only measured in modern counters and are not always available in small laboratories.
The development of an index with good diagnostic accuracy based only on parameters derived from the blood cell count obtained using simple counters would be useful in the clinical routine. Thus, the aim of this study was to develop and validate a discriminative index to differentiate iron deficiency anemia from thalassemia trait.
MethodsTo develop and to validate the new formula, blood count data from 106 (thalassemia trait: 23 and iron deficiency: 83) and 185 patients (thalassemia trait: 30 and iron deficiency: 155) were used, respectively. Iron deficiency, β-thalassemia trait and α-thalassemia trait were confirmed by gold standard tests (low serum ferritin for iron deficiency anemia, HbA2>3.5% for β-thalassemia trait and using molecular biology for the α-thalassemia trait).
ResultsThe sensitivity, specificity, efficiency, Youden's Index, area under receiver operating characteristic curve and Kappa coefficient of the new formula, called the Matos & Carvalho Index were 99.3%, 76.7%, 95.7%, 76.0, 0.95 and 0.83, respectively.
ConclusionThe performance of this index was excellent with the advantage of being solely dependent on the mean corpuscular hemoglobin concentration and red blood cell count obtained from simple automatic counters and thus may be of great value in underdeveloped and developing countries.
Anemia affects about 800 million children and women worldwide. The most common causes of anemia are iron deficiency anemia (IDA) and thalassemia trait (TT).1–3 According to World Health Organization (WHO) estimates in 2004, IDA resulted in 273,000 deaths and the loss of 19.7 million disability-adjusted life years, accounting for 1.3% of the global total, with 97% occurring in low- and middle-income countries.3,4
Differential diagnosis of microcytic anemias is of great clinical importance since prognosis and treatment are distinct. The first step to diagnose microcytic anemias is by the microscopic analysis of blood film and determination of red blood cell (RBC) indices using cell counters. Considering the great similarity between IDA and TT, complementary lab methods are needed besides the routine blood exam. Currently, diagnosis of IDA is obtained by evaluating the iron metabolism, including serum iron, total serum iron binding capacity and serum ferritin measurements. Diagnosis of the β-thalassemia trait (β-TT) is usually made by hemoglobin electrophoresis and HbA2 levels (>3.5%).5,6 On the other hand, diagnosis of the α-thalassemia trait (α-TT) is confirmed by investigating mutations in the α gene. Despite their great utility, gold standard tests for the diagnosis of these microcytic and hypochromic anemias involve time-consuming methodologies, high costs and are inaccessible to poorer populations.5–8
In an attempt to simplify the differential diagnosis between IDA and TT, several indices using blood cell count parameters have been suggested.9–16 The formula developed by Green & King {[(MCV2)×RDW]/(Hb×100) where MCV is mean corpuscular volume, RDW is RBC distribution width and Hb is hemoglobin} has, according to many studies, a good performance.16–18 However, this formula is dependent on the RDW, a parameter that is not provided by all automatic counters. Furthermore, the currently existing indexes reported in the literature have not been developed using molecular biology to diagnose α-thalassemia, which is necessary to exclude concomitant diseases.
The aim of this study was to develop and validate a new index that discriminates between IDA and TT employing very simple parameters that are provided by all automatic blood counters. This study used molecular techniques to diagnose TT and exclude the presence of this disorder in IDA patients.
MethodsPopulation evaluated to develop the new indexTwo groups of patients were selected to develop this index, namely over 18-year-old individuals with IDA or TT. For inclusion in the IDA group, patients had hemoglobin levels below 12g/dL for women and 13g/dL for men,19 MCV and mean corpuscular hemoglobin (MCH) below 80fL and 27pg for both genders, respectively,20 and ferritin<6ng/mL for women and 28ng/mL for men, thereby characterizing IDA. Exclusion criteria for the IDA group were the presence of malignancies and inflammatory/infectious diseases or presence of mutations associated with α-TT (3.7, 4.2, 20.5, MED, SEA, THAI, FIL and Hph). Patients with these mutations were excluded so that this group did not have individuals presenting the two diseases simultaneously.
For inclusion in the TT group, patients had the MCV below 80fL. β-TT carriers were confirmed by hemoglobin electrophoresis at pH 8.6 and HbA2 levels>3.5%.5 α-TT was confirmed by the presence of mutations. All patients with malignancies or inflammatory/infectious diseases based on clinical data and personal information obtained from medical records were excluded from this group, as were patients suffering from iron deficiency identified by measuring ferritin serum levels.
Sample collection, hematological and biochemical evaluationsPeripheral blood (5mL) was collected in tubes containing ethylenediaminetetraacetic acid (EDTA) at a final concentration of 1mg/mL. Blood cell count results were obtained using automatic cell counters (ABX Pentra DX-120, HoribaMedical DF® in IPSEMG and Sysmex® XE-2100 in Hospital Universitário). Hemoglobin electrophoresis was performed at pH 8.6 using a semi-automated system (Hydrasys® of Sebia®) and HbA2 was measured by the elution method using a cellulose acetate strip.5 In addition, these samples were used to investigate eight mutations that cause α-TT (3.7, 4.2, 20.5, MED, SEA, THAI, FIL and Hph). Another sample of the peripheral blood (5mL) was collected without anticoagulant to evaluate ferritin values. Serum ferritin levels were determined by Immulite® DPC® using the chemiluminescent immunoassay technique and Immulite 2000 DPC® kits (Diagnostic Products Corporation, Los Angeles, CA, USA) with reference values between 28 and 397ng/mL for men and between 6 and 159ng/mL for women.
Molecular analysisGenomic DNA was extracted from peripheral blood leukocytes using the Gentra Puregene Blood Kit (Qiagen®, Germany) according to the manufacturer's instructions. Investigation of the deletional mutations (3.7, 4.2, MED, 20.5, SEA, FIL and THAI) was performed by multiplex polymerase chain reaction (PCR) according to the methodology described by Tan et al.21 Oligonucleotides were synthesized by Promega® (Promega®, USA), whose sequences were also described by Tan et al.21 A control, the LIS1 gene located on chromosome 17, was used in the reaction to detect these mutations in order to verify the success of amplification. After amplification, the PCR product was subjected to electrophoresis on 1.5% agarose gel.
Development of the new indexA mathematical formula to discriminate between IDA and TT was developed with the support of a statistician of the Universidade Federal de Minas Gerais, Brazil, using values of the hematological parameters of 23 patients with β-TT and 83 patients with IDA confirmed using gold standard tests (HbA2>3.5% in β-TT and low serum ferritin in IDA).5
Both Fisher discriminant (linear and nonlinear) and receiver operating characteristic (ROC) curve analyses were employed to create this new index. Based on the largest area under the curve, the formula with the best performance was the one that took into account the RBC count and mean corpuscular hemoglobin concentration (MCHC) parameters.
The adjusted formula of the new index developed in this study is Matos & Carvalho Index (MCI)=(1.91×RBC)+(0.44×MCHC).
According to the ROC curve, the MCI presented a cut-off point with a value of 23.85 to discriminate between IDA and TT. If the index is <23.85, the patient is classified as an IDA patient, while values >23.85 classify the individual as a TT carrier.
Validation of the Matos & Carvalho IndexIn order to validate the MCI, a cross-sectional study was conducted from 2009 to 2011 in two hospitals (Hospital Governador Israel Pinheiro – IPSEMG and Hospital Universitário) in Belo Horizonte, Minas Gerais, Brazil. A total of 227 outpatients were included in this study. Classification of patients as having IDA or TT was carried out according to the aforementioned criteria. From 227 patients, 197 patients presented IDA and 30 patients were TT carriers. Of the 197 patients with IDA, 42 had mutations related to α-thalassemia and were excluded (Figure 1). Thus, the IDA group was composed of 155 patients. In the TT group, 24 patients had β-TT and the other six patients had α-TT (Figure 1).
Statistical analysis
Statistical analysis was performed using the GraphPad Prism 5.0 software (Graph-Pad Software Inc., La Jolla, CA). Normality of the CBC data was assessed using the Kolmogorov–Smirnoff test. Considering the nonparametric nature of all data sets, the Mann–Whitney test was used to investigate differences between the two groups. Differences were considered significant when the p-value<0.05.
The sensitivity, specificity, efficiency and Youden's Index were calculated to investigate the performance of the MCI to differentiate between IDA and TT. Besides the calculation of these parameters, the ROC curve of discriminant formulas was plotted and its area determined using GraphPad Prism 5.0. The largest area under the curve indicates the index most likely to correctly discriminate patients with one of these anemias.
The validity of the MCI was compared to the results from molecular techniques (α-TT), HbA2 measurement (β-TT) and ferritin measurement (IDA) as reference standards, respectively. In order to investigate the degree of agreement between the results, the Kappa coefficient was calculated using the software OpenEpi version 2.3.1. Interpretation of Kappa was according to the following scale: excellent 1.00–0.81; good 0.80–0.61; moderate 0.61–0.40; weak 0.40–0.21; and absence of agreement 0.20–0 when compared to the gold standards in the diagnosis of IDA and TT.22
Ethical statementThis study was approved by both the Ethics Committees of the Universidade Federal de Minas Gerais (protocol n° 344/09) and the Hospital Governador Israel Pinheiro (protocol n° 361/09) in Belo Horizonte, Brazil. Patients were informed of the objectives of the research and signed informed consent forms before blood sampling and data collection.
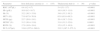
ResultsHematological parametersThe median and interquartile ranges of CBC parameters for the 185 patients (TT and IDA groups) enrolled in the validation of MCI were calculated. RBC, Hb, hematocrit and MCHC values for TT patients were significantly higher than those observed for IDA patients whereas MCV, MCH, RDW and the platelet count were significantly lower than those observed for IDA patients. Hematological data of the two study groups are shown in Table 1.
Hematological parameters of patients with iron deficiency anemia and thalassemia trait used to validate the Matos & Carvalho Index.
| Parameter | Iron deficiency anemia (n=155) | Thalassemia trait (n=30) | p-value |
|---|---|---|---|
| RBC (106/μL) | 4.4 (4.2–4.7) | 5.4 (5.1–5.7) | <0.0001 |
| Hb (g/dL) | 10.0 (9.3–10.7) | 10.9 (10.5–11.8) | <0.0001 |
| Ht (%) | 32.2 (30.3–33.8) | 34.6 (33.2–36.2) | <0.0001 |
| MCV (fL) | 73.0 (67.0–76.0) | 63.8 (61.6–68.5) | <0.0001 |
| MCH (pg) | 22.7 (20.8–24.1) | 20.4 (19.7–21.6) | <0.0001 |
| MCHC (%) | 31.2 (30.4–31.8) | 31.8 (31.2–32.6) | 0.0003 |
| RDW (%) | 17.9 (16.6–19.4) | 15.9 (15.3–16.9) | <0.0001 |
| PLT (103/μL) | 319.0 (257.0–390.0) | 233.5 (197.5–275.3) | <0.0001 |
RBC: red blood count; Hb: hemoglobin; Ht: hematocrit; MCV: mean corpuscular volume; MCH: mean corpuscular hemoglobin; MCHC: mean corpuscular hemoglobin concentration; RDW: red blood cell distribution width; PLT: platelet count.
The data are presented as medians and interquartile range.
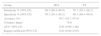
MCI values were calculated for all patients using CBC data. MCI correctly diagnosed 154 (99.3%) of the 155 patients with IDA and 23 (76.7%) of the 30 patients with TT. MCI performance was analyzed by calculating sensitivity [99.3; 95% confidence interval (95% CI): 96.4–99.9], specificity (76.7; 95% CI: 59.1–88.2), accuracy (95.7; 95% CI: 91.7–97.8), area under ROC curve (0.95; 95% CI: 0.90–1.00), Youden's Index (76.0) and the kappa coefficient (0.83; 95% CI: 0.68–0.97) (Table 2). Figure 2 shows the ROC curve for the MCI. This index showed high accuracy and has revealed excellent agreement with the gold standard diagnostic techniques as well as good clinical applicability as a method of screening.
Performance of Matos & Carvalho Index in the discrimination between iron deficiency anemia and thalassemia trait.
| Group | IDA | TT |
|---|---|---|
| Sensitivity % (95% CI) | 99.3 (96.4–99.9) | 76.7 (59.1–88.2) |
| Specificity % (95% CI) | 76.7 (59.1–88.2) | 99.3 (96.4–99.9) |
| Accuracy (%) | 95.7 (91.7–97.8) | |
| Youden's Index | 76.0 | |
| AUC (95% CI) | 0.95 (0.90–1.00) | |
| Kappa coefficient (95% CI) | 0.83 (0.68–0.97) | |
IDA: iron deficiency anemia; TT: thalassemia trait; 95% CI: 95% confidence interval; AUC: area under receiver operating characteristic curve.

In this study, a new index (MCI) was developed using detailed statistical analysis with the aim of accurately discriminating between IDA and TT. This formula produced excellent diagnostic accuracy and the parameters, such as sensitivity, efficiency, Youden's Index, and area under the ROC curve were quite high. MCI showed excellent agreement with the gold standard methods of diagnosis for these anemias, showing good applicability as a screening tool in the clinical practice. Furthermore, the MCI was developed using a molecular biology technique to diagnose α-thalassemia, which is necessary to exclude concomitant diseases. The indexes currently described in the literature were not developed using this technique.
An important result obtained for MCI is the high sensitivity to detect IDA (99.3%). As sensitivity is a parameter that indicates the proportion of individuals correctly identified with the disease, the high sensitivity of the MCI in the detection of IDA indicates that it is a good tool to identify this disorder. One may argue that a discriminative index that correctly diagnoses IDA would clinically be more valuable compared to those that correctly diagnose TT. This is because one month of iron supplementation to a patient mistakenly classified as having IDA who in fact has TT, causes less damage than the lack of this supplement to a patient with IDA who was mistakenly classified as a TT carrier. Iron and erythropoietin are required for the formation of hemoglobin.5 Furthermore, iron is a component required in critical cellular processes such as the transport and utilization of oxygen, production of adenosine triphosphate (ATP), DNA synthesis, metabolism of catecholamines, mitochondrial electron transport and other physiological processes.23–25 Thus, biological systems including the immune and neurological systems, are all affected by the lack of iron.23 For these reasons the lack of treatment for IDA would be very harmful to the individual.
Despite the moderate sensitivity for detecting patients with thalassemia, application of the MCI is still advantageous if there is suspicion of this disorder. In this case, the patient who presented a value of MCI >23.85 should be referred for confirmation by conventional methods. Nevertheless, in practical terms this is an advantage, because for this group, an investigation of iron levels can be considered a second option.
The MCI represents a breakthrough in discriminating between IDA and TT, with potential for wide application considering its advantage of being dependent only on the number of RBCs and the MCHC. It should be noted that these two parameters are obtainable from most simple cell counters, therefore sophisticated automatic counters are not required. Hence, the MCI can be applied in areas where advanced technologies are not available in clinical labs.
Despite the advantages and simplicity of the implementation of the MCI in the laboratory practice, there is a limitation of MCI and other discriminating formulas since they are not able to differentiate all cases of IDA from TT. In light of this, two situations can occur that deserve special attention: (i) the index indicated TT, but the patient had IDA and (ii) the application of the index indicated IDA, but the patient was a TT carrier. In the first case, patient follow-up is necessary and will indicate, over time, a significant reduction in circulating hemoglobin levels, prompting the physician to request investigative tests of iron metabolism. In the latter situation, patient follow-up is also needed which will show the need for medical procedures. In this case, the prescription of iron would not increase the hemoglobin level due to the genetic disorder. In cases of concomitant diseases, monitoring can also clarify the best medical approach. Therefore, MCI is a useful tool in guiding the physician regarding the initial conduct to be adopted; however, it does not eliminate the need of a follow-up that eventually may require confirmatory tests.
ConclusionThe MCI has an excellent performance and may be potentially useful for screening patients with microcytic anemias. The routine use of the MCI provided great diagnostic accuracy, and could contribute decisively to guide the choice of confirmatory laboratory tests leading to a correct diagnosis and treatment. This would result in a significant cost saving for the health system, especially advantageous in underdeveloped and developing countries with limited financial resources.
Conflicts of interestThe authors declare no conflicts of interest.


