
The aim of this study was to evaluate the effectiveness of mature red cell and reticulocyte parameters to identify three conditions: iron deficiency anemia, anemia of chronic disease, and anemia of chronic disease associated with absolute iron deficiency.
MethodsPeripheral blood cells from 117 adult patients with anemia were classified according to iron status, inflammation, and hemoglobinopathies as: iron deficiency anemia (n=42), anemia of chronic disease (n=28), anemia of chronic disease associated with iron deficiency anemia (n=22), and heterozygous β-thalassemia (n=25). The percentage of microcytic erythrocytes, hypochromic erythrocytes, and the levels of hemoglobin in both reticulocytes and mature red cells were determined. Receiver operating characteristic analysis was used to evaluate the accuracy of the parameters in differentiating anemia.
ResultsThere was no difference between the groups of iron deficiency and anemia of chronic disease associated with absolute iron deficiency for any of the parameters. The percentage of hypochromic erythrocytes was the best parameter to identify absolute iron deficiency in patients with anemia of chronic disease (area under curve=0.785; 95% confidence interval: 0.661–0.909 with sensitivity of 72.7%, and specificity of 70.4%; cut-off value 1.8%). The formula microcytic erythrocyte count minus hypochromic erythrocyte count was very accurate to differentiate iron deficiency anemia from heterozygous β-thalassemia (area under curve=0.977; 95% confidence interval: 0.950–1.005 with a sensitivity of 96.2%, and specificity of 92.7%; cut-off value 13.8).
ConclusionThe erythrocyte and reticulocyte indices are moderately good to identify absolute iron deficiency in patients with anemia of chronic disease.
New automated blood cell analyzers can provide information about individual cell characteristics, such as hemoglobin content of reticulocytes, hemoglobin content of mature erythrocytes, and percentages of microcytic erythrocytes and hypochromic cells. These parameters have been used in the diagnosis of iron deficiency anemia (IDA), β-thalassemia (β-Thal),1–3 and anemia of chronic disease (ACD).4,5 The differentiation between these three conditions is very important as the clinical approach is different in each particular diagnosis.
As reticulocytes have a normal life span of one or two days, information concerning the hemoglobin content of young red cells is a good indication of iron availability and an early marker of iron-deficiency erythropoiesis.6 Reticulocyte hemoglobin equivalent (Ret-He) reflects real-time information on the synthesis by young erythrocytes in bone marrow. Other available parameters are the percentage of red cells with Hb content equivalent to or less than 17pg (%HypoHe), and the percentage of red cells with a volume less than 60 fL (% MicroR),1 which corresponds to a sub-population of mature red cells exhibiting evidence of insufficient iron content.
A mathematical formula using %MicroR and %HypoHe (MHe) proposed by Urrechaga et al.7 tested discriminant indices in healthy individuals, β-Thal and IDA patients. A sensitivity of 97.4% and specificity of 97.1% was reported in differentiating β-Thal from mild IDA.
Anemia associated with chronic inflammation, infection or malignancy is the most common anemia in hospitalized patients. Although stainable iron is present in bone marrow, elevated levels of inflammatory cytokines interfere in erythropoiesis leading to a hyporegenerative anemia and defective iron incorporation into erythrocyte progenitors. Reduced concentrations of circulating iron and normal or increased iron stores characterize the state of functional iron deficiency.8
Anemia of inflammation can be associated with absolute iron deficiency (ACD combi) generally in patients with inflammatory disease and chronic blood loss. Differentiation between ACD and ACD combi is clinically important, but in the clinical practice, differentiation is difficult using conventional biomarkers such as ferritin concentration and transferrin saturation.9 The soluble transferrin receptor/log ferritin ratio may be useful in distinguishing ACD from ACD combi.10
The aim of this study was to analyze the effectiveness of new laboratory parameters related to mature red blood cells and reticulocytes to differentiate three conditions related to iron deficiency: IDA, ACD and ACD combi. Moreover, the performance of these parameters was tested to distinguish IDA from β-Thal, two common causes of microcytic anemia.
MethodsThis project was approved by the Ethics Committee of the Faculty of Medical Sciences, Universidade Estadual de Campinas (UNICAMP), São Paulo, Brazil. All samples were selected from routine collections and informed consent was waived.
Peripheral blood samples from 117 adult patients with anemia (Hb<12.0g/dL for women and Hb<14.0g/dL for men) were selected from routine workload. Blood analysis had been requested by general practitioners, in general to investigate anemia.
Patients were classified according to iron status analysis (commercial kits from Roche Diagnostics Germany): IDA when serum iron (SI) levels were <45mg/dL for men and <30mg/dL for women; percentage transferrin saturation (%TS) <15%; serum ferritin (SF) <30μg/L for men and <13μg/L for women.
Patients were classified as ACD when SI levels were normal or reduced (40–160mg/dL and 30–160mg/dL for men and women, respectively), %TS normal or decreased (30–50%), normal or high SF (30–400μg/L and 13–150μg/for men and women, respectively) and C-reactive protein (C-RP)>5mg/dL (Tina-Quant C-Reactive Protein, Roche Diagnostics, Germany).
Soluble transferrin receptor (sTfR) levels (Roche Diagnostics, Germany) were measured in all samples, and the sTfR/log ferritin ratio was used to identify iron deficiency in patients with ACD. Patients with ACD having a sTfR/log ferritin ratio>2.06 or sTfR>3.71μg/mL (cut-off values indicative of iron deficiency in our laboratory) were classified as ACD combi.
Twenty-six patients had the diagnosis of β-Thal according to the hemoglobin A2 level determined by high performance liquid chromatography (HPLC- Variant II – Hemoglobin Testing System, Bio-Rad Laboratories, Inc., CA, USA).
Patients with β-Thal associated with other kinds of anemia, patients with reticulocytosis or pancytopenia, individuals who had received transfusions within the previous three months, and patients on iron replacement therapy were excluded from the study.
A control group (CG) was compounded by healthy individuals with no clinical signs or symptoms of disease, including acute inflammatory/infectious conditions, normal hematologic findings, and C-RP<5mg/L. Healthy individuals were students or laboratory staff, all of whom donated blood samples on a voluntary basis.
Determination of erythrocyte and reticulocyte parameters was performed using the Sysmex XE-5000 automated hematological analyzer (Sysmex, Kobe, Japan), which provides the following parameters: Ret-He, %MicroR, hemoglobin content of erythrocytes obtained from the optical counting of red blood cells (RBC-He), and %HypoHe. The MHe index was calculated as: %MIcroR-%HypoHe.7
Mann–Whitney test was applied to compare groups. Receiver operator characteristic analysis (ROC) was used to evaluate the accuracy of the parameters to differentiate between types of anemia. The level of significance was set for a p-value <0.05. Data were analyzed using the SPSS statistics program for Windows (version 13.0. SPSS Inc. Chicago, IL, USA).
ResultsAccording to adopted criteria, individuals were classified as IDA (42 patients), β-Thal (25 individuals), ACD combi (22 patients), ACD (28 patients) and CG (54 individuals).
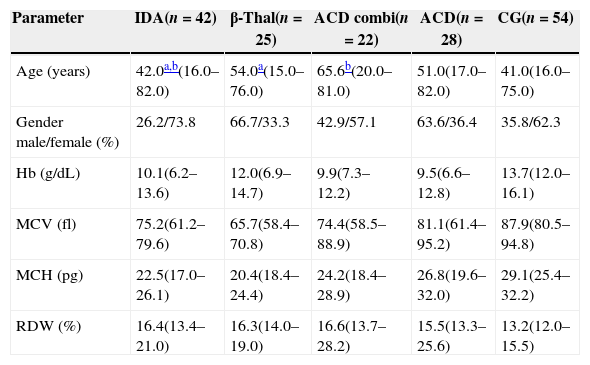
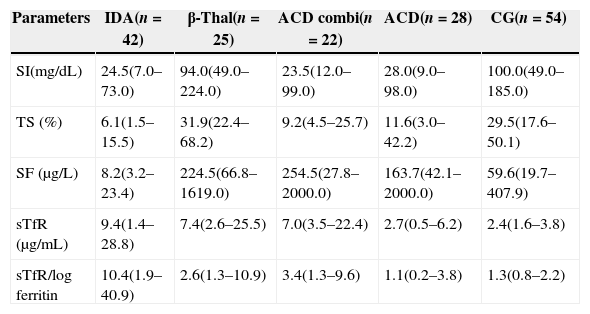
Table 1 describes the demographic characteristics and laboratorial data of the patients and the CG, and Table 2 shows the iron status measurements used to classify the patients in different groups.
Demographic characteristics and hematological data of patients and the control group.
| Parameter | IDA(n=42) | β-Thal(n=25) | ACD combi(n=22) | ACD(n=28) | CG(n=54) |
|---|---|---|---|---|---|
| Age (years) | 42.0a,b(16.0–82.0) | 54.0a(15.0–76.0) | 65.6b(20.0–81.0) | 51.0(17.0–82.0) | 41.0(16.0–75.0) |
| Gender male/female (%) | 26.2/73.8 | 66.7/33.3 | 42.9/57.1 | 63.6/36.4 | 35.8/62.3 |
| Hb (g/dL) | 10.1(6.2–13.6) | 12.0(6.9–14.7) | 9.9(7.3–12.2) | 9.5(6.6–12.8) | 13.7(12.0–16.1) |
| MCV (fl) | 75.2(61.2–79.6) | 65.7(58.4–70.8) | 74.4(58.5–88.9) | 81.1(61.4–95.2) | 87.9(80.5–94.8) |
| MCH (pg) | 22.5(17.0–26.1) | 20.4(18.4–24.4) | 24.2(18.4–28.9) | 26.8(19.6–32.0) | 29.1(25.4–32.2) |
| RDW (%) | 16.4(13.4–21.0) | 16.3(14.0–19.0) | 16.6(13.7–28.2) | 15.5(13.3–25.6) | 13.2(12.0–15.5) |
Values as medians, minimum and maximum.
IDA: iron deficiency anemia: β-Thal: heterozygous beta-thalassemia; ACD combi: anemia of chronic disease associated with absolute iron deficiency; ACD: anemia of chronic disease; CG: control group; Hb: hemoglobin; MCV: mean cell volume; MCH: mean cell hemoglobin; RDW: red cell distribution width.
Biochemical data.
| Parameters | IDA(n=42) | β-Thal(n=25) | ACD combi(n=22) | ACD(n=28) | CG(n=54) |
|---|---|---|---|---|---|
| SI(mg/dL) | 24.5(7.0–73.0) | 94.0(49.0–224.0) | 23.5(12.0–99.0) | 28.0(9.0–98.0) | 100.0(49.0–185.0) |
| TS (%) | 6.1(1.5–15.5) | 31.9(22.4–68.2) | 9.2(4.5–25.7) | 11.6(3.0–42.2) | 29.5(17.6–50.1) |
| SF (μg/L) | 8.2(3.2–23.4) | 224.5(66.8–1619.0) | 254.5(27.8–2000.0) | 163.7(42.1–2000.0) | 59.6(19.7–407.9) |
| sTfR (μg/mL) | 9.4(1.4–28.8) | 7.4(2.6–25.5) | 7.0(3.5–22.4) | 2.7(0.5–6.2) | 2.4(1.6–3.8) |
| sTfR/log ferritin | 10.4(1.9–40.9) | 2.6(1.3–10.9) | 3.4(1.3–9.6) | 1.1(0.2–3.8) | 1.3(0.8–2.2) |
Values as medians, minimum and maximum.
IDA: iron deficiency anemia: β-Thal: heterozygous beta-thalassemia; ACD combi: anemia of chronic disease associated with absolute iron deficiency; ACD: anemia of chronic disease; CG: control group; SI: serum iron, TS: transferrin saturation; SF: serum ferritin; sTfR: soluble transferrin receptor.
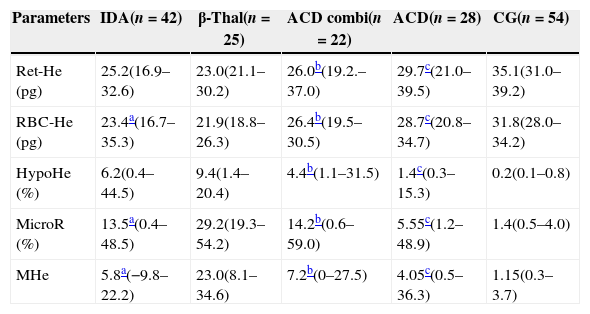
As expected the β-Thal group had the highest %MicroR (Table 3). The %HypoHe was higher in the β-Thal group compared to other groups except for IDA patients. However, as the microcytic cells were more abundant in the β-Thal group, when these two parameters were associated in the MHe index, this difference became more evident and statistically significant.
Reticulocyte and red cell indices for patients and the control group.
| Parameters | IDA(n=42) | β-Thal(n=25) | ACD combi(n=22) | ACD(n=28) | CG(n=54) |
|---|---|---|---|---|---|
| Ret-He (pg) | 25.2(16.9–32.6) | 23.0(21.1–30.2) | 26.0b(19.2.–37.0) | 29.7c(21.0–39.5) | 35.1(31.0–39.2) |
| RBC-He (pg) | 23.4a(16.7–35.3) | 21.9(18.8–26.3) | 26.4b(19.5–30.5) | 28.7c(20.8–34.7) | 31.8(28.0–34.2) |
| HypoHe (%) | 6.2(0.4–44.5) | 9.4(1.4–20.4) | 4.4b(1.1–31.5) | 1.4c(0.3–15.3) | 0.2(0.1–0.8) |
| MicroR (%) | 13.5a(0.4–48.5) | 29.2(19.3–54.2) | 14.2b(0.6–59.0) | 5.55c(1.2–48.9) | 1.4(0.5–4.0) |
| MHe | 5.8a(−9.8–22.2) | 23.0(8.1–34.6) | 7.2b(0–27.5) | 4.05c(0.5–36.3) | 1.15(0.3–3.7) |
Values as medians, minimum and maximum.
Mann–Whitney test was applied to compare groups.
IDA: iron deficiency anemia: β-Thal: heterozygous beta-thalassemia; ACD combi: anemia of chronic disease associated with absolute iron deficiency; ACD: anemia of chronic disease; CG: control group; Ret-He: reticulocyte hemoglobin content; RBC-He: red blood cell hemoglobin content; HypoHe: percentage of hypochromic erythrocytes; MicroR: percentage of hypochromic erythrocytes; MHe: MicroR-HypoHe index.
The Mann–Whitney test identified no difference between the IDA and ACD combi groups in respect to any parameter. When the ACD and ACD combi groups were compared, the RBC-He and Ret-He were significantly lower in ACD combi patients (p-value=0.016 and p-value=0.003, respectively). Furthermore, the %MicroR and %HypoHe were significantly higher in ACD combi patients, as was the MHe index (p-value=0.001, p-value=0.003 and p-value=0.014, respectively).
Although the ACD group had a sTFR/log ferritin ratio below the cut-off indicative of iron deficiency, the Ret-He and RBC-He values were significantly lower than the CG whereas the %HypoHe, %MicroR and MHe index were higher (p-value<0.001 for all comparisons).
The best test for differentiating IDA from β-Thal was the MHe index (area under curve [AUC]: 0.977; 95% confidence interval [95/% CI] 0.950–1.005). A cut-off of 13.8 was very sensitive (96.2%) and specific (92.7%) to identify IDA patients. The parameter %MicroR was effective (AUC 0.886: CI: 95% 0.810–0.963) to detect iron deficiency with sensitivity and specificity for values <25.0% of 84.6% and 78.0%, respectively.
The ROC curve for %HypoHe was the most effective to differentiate between ACD and ACD combi although with a moderate AUC (0.785: CI: 95% 0.661–0.909), sensitivity 72.7%, and specificity 71.4% (cut-off 1.8%).
The %HypoHe was the best parameter to distinguish between IDA and ACD (AUC: 0.835; 95% CI: 0.737–0.933). The sensitivity and specificity of a %HypoHe<2.45% to identify ACD were 75.4% and 70.4%, respectively. The results of the ROC analysis were lower for RBC-He (AUC: 0.809; 95% CI: 0.696–0.922), Ret-He (AUC: 0.780; 95% CI: 0.661–0.899), and %MicroR (AUC: 0.785; 95% CI: 0.662–0.908).
The capacity of the tests to discriminate IDA from ACD combi was not satisfactory and the AUC was less than 0.700 for all these parameters.
DiscussionThe diagnostic accuracy of reticulocyte parameters has been tested by many authors, especially to diagnose iron deficiency in patients submitted to dialysis.6,10,11 Measurement of the reticulocyte content is helpful in detecting early stages of iron deficiency prior to the development of anemia.6,12,13 A reduction in reticulocyte hemoglobin has been observed in other conditions besides iron deficiency, such as in hemoglobinopathies.14,15
The effectiveness of reticulocyte parameters to diagnose IDA and ACD was reported in other research.2,8,16 In a recent study with geriatric patients, the authors concluded that Ret-He is no better than classic indices, such as mean cell hemoglobin and mean cell hemoglobin concentration, in differentiating between IDA and ACD.5 Our results showed that, although the Ret-He value was lower in IDA than ACD, the accuracy of the test to distinguish both types of anemia was moderate, and less effective compared to %HypoHe. The potential of Ret-He was demonstrated in a study with patients with chronic rheumatic disease and anemia. The predictive value of RetHe was tested in response to oral iron therapy and, according to the authors, the findings support the role of Ret-He as a marker for iron responsiveness.17
Additional extended red blood cell parameters besides Ret-He have been tested, such as %MicroR, and %HypoHe, and indices generated by combining them.18 The results regarding the differentiation between IDA and β-Thal are promising, although the optimum cut-off varies according to the population studied and the criteria adopted to classify anemia.18,19 The MHe index was first proposed and tested by Urrechaga et al. 16 The performance of this index was better (sensitivity 98.0% and specificity 95.9) than other published indices. The authors suggest that samples with MHe values >11.5 can be chosen for further analysis to confirm the diagnosis of thalassemia; these data are coincident with our results. The MHe index was the best parameter to discriminate IDA from β-Thal, although the cut-off value used was different from the value described by Urrechaga et al.16 probably because patients were not stratified according to the severity of anemia.
As far as we know, no other reports exist about the efficiency of expanded erythrocyte parameters in identifying patients with anemia of inflammation associated with absolute iron deficiency. The clinical usefulness of the determination of %Hypo has long been recognized in differentiating between iron-deficient and iron-sufficient patients with chronic kidney disease receiving erythropoietin stimulating agents.20
The current study applied the sTfR/log ferritin ratio to identify iron deficiency in patients with ACD. Measurement of the sTfR is considered a good indicator of functional iron status, as it does not suffer any influence of systemic inflammation unlike the SI, transferrin, and ferritin levels.21,22 Thus, the transferrin receptor synthesis is stimulated when there is a reduction of functional iron as shown by the results of this study. Iron deficiency is characterized by an increase in sTfR levels and low ferritin values, while in anemia of inflammation, transferrin receptor levels are slightly affected whereas serum ferritin increases greatly.23 In the clinical practice this differentiation is important because iron supplementation is beneficial to ACD combi patients, but may be deleterious for ACD patients. According to the results of this study, even though the sensitivity and specificity were moderate, the best parameter for distinguishing ACD combi from ACD is %HypoHe, followed by MicroR. It is interesting to note that there was no difference between the IDA and ACD combi groups in any test, different to what was observed when ACD was compared with IDA. In fact, the absolute iron deficiency associated to ACD increases the number of microcytic and hypochromic red cells, causing cell features similar to IDA. ACD patients showed evidence of reduced iron availability for erythropoiesis, but the disturbance of the iron metabolism in functional iron deficiency was less remarkable than in the association of ACD with IDA.
In practical terms the incorporation of new cell indices can speed up the diagnosis of IDA, β-Thal and ACD, and consequently target more quickly and more precisely the subsequent confirmatory exams in order to introduce appropriate treatment. On the other hand, the difficulty in identifying absolute iron deficiency in patients with inflammatory conditions remains. Therefore, the challenge persists, and other studies are needed to identify a parameter with clinical decision value.
Conflicts of interestThe authors declare no conflicts of interest.


