


Immune checkpoints are regulators of the immune system response that allow self-tolerance. Molecules such as Programmed Cell Death Protein 1 (PD-1) and its Ligand (PD-L1) participate in the immune checkpoint by signaling co-inhibition of lymphocyte responses. In cancers, PD-L1 expression is associated with the immune evasion mechanism, which favors tumor growth. The use of anti-PD-1/PD-L1 drugs is already well described in solid tumors, but still not fully understood in hematologic malignancies. Myelodysplastic neoplasms (MDSs) are heterogeneous bone marrow disorders with an increased risk of progression to Acute Myeloid Leukemia (AML). The MDS affects hematopoietic stem cells and its pathogenesis is linked to genetic and epigenetic defects, in addition to immune dysregulation. The influence of the PD-L1 on the MDS remains unknown.
MethodsIn this study, we evaluated the mRNA expression of the PD-L1 in 53 patients with MDS, classified according to the WHO 2016 Classification.
ResultsPatients with dyserythropoiesis presented significantly higher PD-L1 expression than patients without dyserythropoiesis (p= 0.050). Patients classified as having MDS with an excess of blasts 2 (MDS-EB2) presented a significant upregulation in the mRNA expression of the PD-L1 compared to the MDS with an excess of blasts 1 (MDS-EB1) (p= 0.050). Furthermore, we detected three patients with very high levels of PD-L1 expression, being statistically classified as outliers.
ConclusionWe suggested that the high expression of the PD-L1 is associated with a worse prognosis in the MDS and functional studies are necessary to evaluate the possible use of anti-PD-L1 therapies for high-risk MDS, such as the MDS-EBs.
Myelodysplastic neoplasms (MDSs) are bone marrow cancers with significantly heterogeneous characteristics, accompanied by an increased risk of progression to acute myeloid leukemia (AML).1 The MDS pathogenesis is associated with genetic and epigenetic defects and immune dysregulation.2,3
The overexpression of immune-related genes in the MDS was linked to its pathogenesis in more than 50% of patients.4 Recent findings showed the role of immune alterations in the MDS, where immunological mechanisms can modulate the environment by favoring the expansion of malignant clones.5 The innate and adaptive immune systems are active in the MDS niche and participate in the abnormal hematopoiesis mechanisms. The immune system and the immune evasion mechanism can act in the cell death, proliferation, or suppression of hematopoiesis.6
The immune evasion occurs by the expressing of immune checkpoint molecules, such as the Protein Death 1 (PD-1) and Protein Death Ligand 1 (PD-L1). These molecules participate in the co-inhibition signaling of lymphocyte responses, preventing the cell death. Furthermore, the induction of the PD-L1 expression in tumor cells occurs in response to specific cytokines, such as the tumor necrosis factor alpha (TNF-α) and interferon gamma (IFN-γ).7 The immunotherapy with checkpoint inhibitors is already performed in several cancers, but the treatment success depends on the type of tumor and the patient's immune system.8–10
In this context, the measurement of PD-L1 expression levels emerged as a possible biomarker to screen patients more susceptible to anti-PD-L1 drugs.11,12 In the MDS, studies reported contradictory findings and the role of the PD-L1 in the development and progression of the disease remains to be elucidated.13,14 We aimed to evaluate if the PD-L1 gene expression would be linked to clinical and prognostic features of patients with myelodysplastic neoplasms.
Material and methodsPatients and methodsFifty-three patients with MDS were diagnosed at the Federal University of Ceará (UFC)/Center for Research and Drug Development (NPDM), according to the WHO 2016 Classification. Primary MDS patients were evaluated according to the Revised International Prognostic Scoring System (IPSS-R) (Table 1). Four bone marrow samples from healthy volunteers were used as the control group. This study was approved by the Ethics Committee of the UFC under number 69366217.6.0000.5054 and informed consent was obtained from all patients and controls.
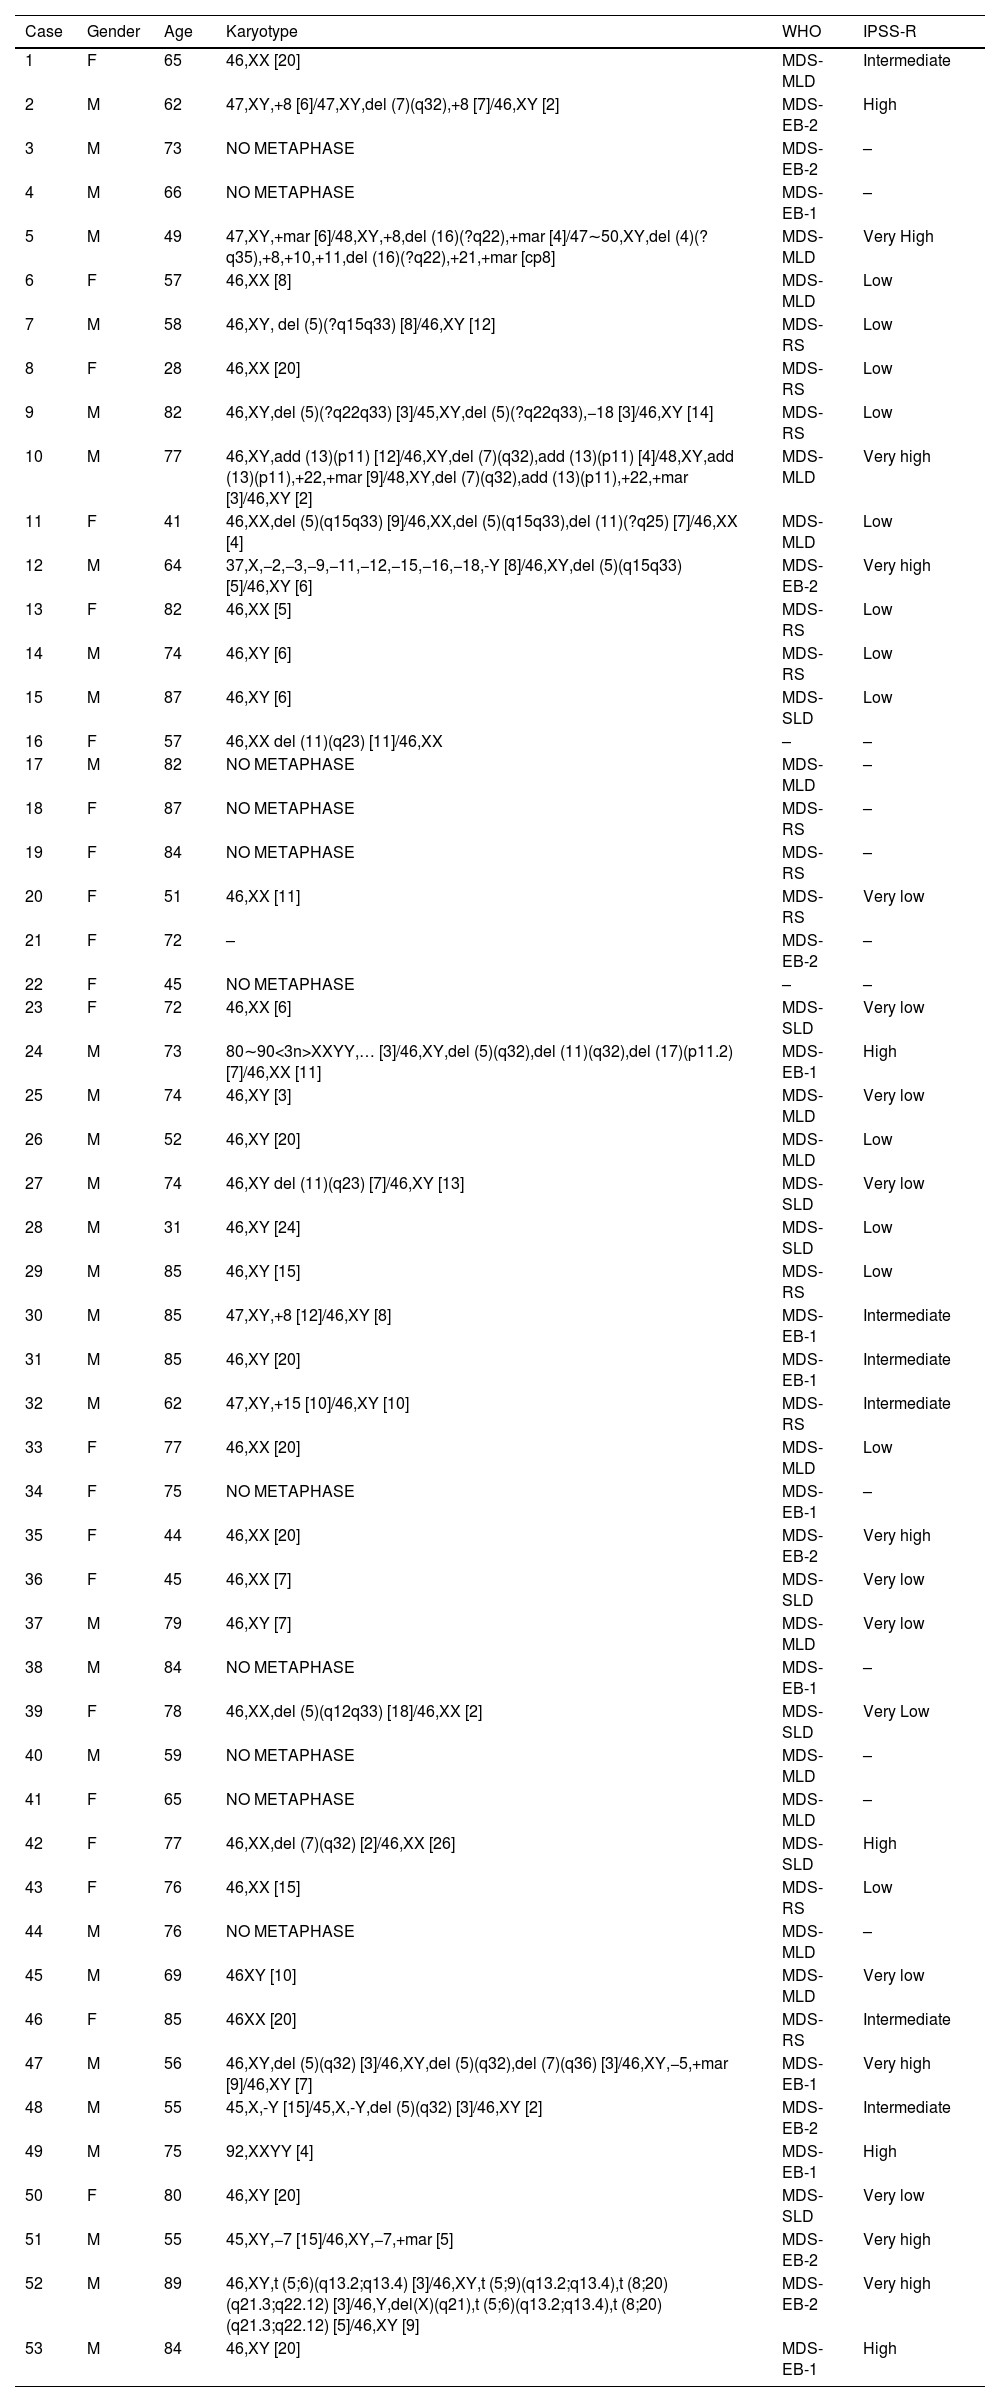
Clinical and laboratory characteristics of MDS patients.
| Case | Gender | Age | Karyotype | WHO | IPSS-R |
|---|---|---|---|---|---|
| 1 | F | 65 | 46,XX [20] | MDS-MLD | Intermediate |
| 2 | M | 62 | 47,XY,+8 [6]/47,XY,del (7)(q32),+8 [7]/46,XY [2] | MDS-EB-2 | High |
| 3 | M | 73 | NO METAPHASE | MDS-EB-2 | – |
| 4 | M | 66 | NO METAPHASE | MDS-EB-1 | – |
| 5 | M | 49 | 47,XY,+mar [6]/48,XY,+8,del (16)(?q22),+mar [4]/47∼50,XY,del (4)(?q35),+8,+10,+11,del (16)(?q22),+21,+mar [cp8] | MDS-MLD | Very High |
| 6 | F | 57 | 46,XX [8] | MDS-MLD | Low |
| 7 | M | 58 | 46,XY, del (5)(?q15q33) [8]/46,XY [12] | MDS-RS | Low |
| 8 | F | 28 | 46,XX [20] | MDS-RS | Low |
| 9 | M | 82 | 46,XY,del (5)(?q22q33) [3]/45,XY,del (5)(?q22q33),−18 [3]/46,XY [14] | MDS-RS | Low |
| 10 | M | 77 | 46,XY,add (13)(p11) [12]/46,XY,del (7)(q32),add (13)(p11) [4]/48,XY,add (13)(p11),+22,+mar [9]/48,XY,del (7)(q32),add (13)(p11),+22,+mar [3]/46,XY [2] | MDS-MLD | Very high |
| 11 | F | 41 | 46,XX,del (5)(q15q33) [9]/46,XX,del (5)(q15q33),del (11)(?q25) [7]/46,XX [4] | MDS-MLD | Low |
| 12 | M | 64 | 37,X,−2,−3,−9,−11,−12,−15,−16,−18,-Y [8]/46,XY,del (5)(q15q33) [5]/46,XY [6] | MDS-EB-2 | Very high |
| 13 | F | 82 | 46,XX [5] | MDS-RS | Low |
| 14 | M | 74 | 46,XY [6] | MDS-RS | Low |
| 15 | M | 87 | 46,XY [6] | MDS-SLD | Low |
| 16 | F | 57 | 46,XX del (11)(q23) [11]/46,XX | – | – |
| 17 | M | 82 | NO METAPHASE | MDS-MLD | – |
| 18 | F | 87 | NO METAPHASE | MDS-RS | – |
| 19 | F | 84 | NO METAPHASE | MDS-RS | – |
| 20 | F | 51 | 46,XX [11] | MDS-RS | Very low |
| 21 | F | 72 | – | MDS-EB-2 | – |
| 22 | F | 45 | NO METAPHASE | – | – |
| 23 | F | 72 | 46,XX [6] | MDS-SLD | Very low |
| 24 | M | 73 | 80∼90<3n>XXYY,… [3]/46,XY,del (5)(q32),del (11)(q32),del (17)(p11.2) [7]/46,XX [11] | MDS-EB-1 | High |
| 25 | M | 74 | 46,XY [3] | MDS-MLD | Very low |
| 26 | M | 52 | 46,XY [20] | MDS-MLD | Low |
| 27 | M | 74 | 46,XY del (11)(q23) [7]/46,XY [13] | MDS-SLD | Very low |
| 28 | M | 31 | 46,XY [24] | MDS-SLD | Low |
| 29 | M | 85 | 46,XY [15] | MDS-RS | Low |
| 30 | M | 85 | 47,XY,+8 [12]/46,XY [8] | MDS-EB-1 | Intermediate |
| 31 | M | 85 | 46,XY [20] | MDS-EB-1 | Intermediate |
| 32 | M | 62 | 47,XY,+15 [10]/46,XY [10] | MDS-RS | Intermediate |
| 33 | F | 77 | 46,XX [20] | MDS-MLD | Low |
| 34 | F | 75 | NO METAPHASE | MDS-EB-1 | – |
| 35 | F | 44 | 46,XX [20] | MDS-EB-2 | Very high |
| 36 | F | 45 | 46,XX [7] | MDS-SLD | Very low |
| 37 | M | 79 | 46,XY [7] | MDS-MLD | Very low |
| 38 | M | 84 | NO METAPHASE | MDS-EB-1 | – |
| 39 | F | 78 | 46,XX,del (5)(q12q33) [18]/46,XX [2] | MDS-SLD | Very Low |
| 40 | M | 59 | NO METAPHASE | MDS-MLD | – |
| 41 | F | 65 | NO METAPHASE | MDS-MLD | – |
| 42 | F | 77 | 46,XX,del (7)(q32) [2]/46,XX [26] | MDS-SLD | High |
| 43 | F | 76 | 46,XX [15] | MDS-RS | Low |
| 44 | M | 76 | NO METAPHASE | MDS-MLD | – |
| 45 | M | 69 | 46XY [10] | MDS-MLD | Very low |
| 46 | F | 85 | 46XX [20] | MDS-RS | Intermediate |
| 47 | M | 56 | 46,XY,del (5)(q32) [3]/46,XY,del (5)(q32),del (7)(q36) [3]/46,XY,−5,+mar [9]/46,XY [7] | MDS-EB-1 | Very high |
| 48 | M | 55 | 45,X,-Y [15]/45,X,-Y,del (5)(q32) [3]/46,XY [2] | MDS-EB-2 | Intermediate |
| 49 | M | 75 | 92,XXYY [4] | MDS-EB-1 | High |
| 50 | F | 80 | 46,XY [20] | MDS-SLD | Very low |
| 51 | M | 55 | 45,XY,−7 [15]/46,XY,−7,+mar [5] | MDS-EB-2 | Very high |
| 52 | M | 89 | 46,XY,t (5;6)(q13.2;q13.4) [3]/46,XY,t (5;9)(q13.2;q13.4),t (8;20)(q21.3;q22.12) [3]/46,Y,del(X)(q21),t (5;6)(q13.2;q13.4),t (8;20)(q21.3;q22.12) [5]/46,XY [9] | MDS-EB-2 | Very high |
| 53 | M | 84 | 46,XY [20] | MDS-EB-1 | High |
Abbreviations: M, Male; F, Female; WHO, World Health Organization; MDS-SLD, MDS with single lineage dysplasia; MDS-MLD, MDS with multilineage dysplasia; MDS-RS, MDS with ring sideroblasts; MDS-EB, MDS with excess blasts; IPSS-R, Revised International Prognosis Score System.
The conventional G-banding karyotyping was performed on mononuclear bone marrow cells in all cases. Briefly, cultures were established in the Roswell Park Memorial Institute RPMI 1640 medium (Gibco, Grand Island, NY, USA), containing 20% fetal calf serum. After a 24-h. incubation, colcemid was added to the cell culture to block the mitotic fuse (final concentration 0.05 μg/mL). After harvesting, the cells were exposed to a hypotonic KCl solution (0.068 mol/L) and fixed with the Carnoy's solution (acetic acid/methanol in a 1:3 proportion). Slides were prepared and submitted to G-banding. Whenever possible, at least 20 metaphases were analyzed using the CytoVision Automated Karyotyping System (Applied Imaging, San Jose, CA, USA) and described according to the International System for Human Cytogenetic Nomenclature 2016.
Total RNA extractionThe bone marrow mononuclear cells were separated after the lysis of red cells. Total RNA extractions from isolated mononuclear cells were performed with the TRIzol Reagent™ (Invitrogen, Carlsbad, CA, USA). The cDNA synthesis from the total RNA was performed with the High-Capacity cDNA Reverse Transcription kit (Applied Biosystems, San Jose, California, USA), according to the manufacturer's protocol. The cDNA samples were stored at −20 °C until further use.
Quantitative real‑time PCRQuantitative real-time PCR (qPCR) reactions were based on the TaqMan® methodology (Applied Biosystems, Carlsbad, CA, USA) and performed on a 7500 Fast System® (Applied Biosystems, Carlsbad, CA, USA). Pre-developed TaqMan gene expression assays for the PD-L1 (Hs00204257_m1), as well as the TaqMan Universal Master Mix II with UNG® (Applied Biosystems, Carlsbad, CA, USA), were used to quantify the mRNA expression. For each sample, the expression of target genes was normalized to the reference genes glyceraldehyde 3-phosphate dehydrogenase (GAPDH) and ubiquitin C (UBC). The reference genes were chosen according to a previously described method.15 Each sample was performed in duplicate. The expression ratios were calculated using the 2−ΔCq method16 from the Cq values provided by the 7500 Fast Real-Time PCR System software (Applied Biosystems, Inc., Foster City, CA, USA).
Statistical analysisThe data on the relative mRNA expression (ΔCq values − quantitative cycle) were expressed as mean/median and range (maximum and minimum) to determine the possible association between gene expressions and the variables. The normality was evaluated by the Shapiro–Wilk test, and the outliers were removed. When the normality was detected, the Student's t-test or one-way ANOVA with the Tukey/Games Howell post hoc test was used. The homogeneity of variance analysis for all variables was evaluated by the Levene's test. The variables that did not have a normal distribution were analyzed using the following nonparametric tests: the Mann–Whitney for the comparison of the median between two groups and the Kruskal-Wallis to compare the median in variables with three or more groups. The survival analysis was performed by the Kaplan-Meier method,17 using the Long Rank test as a post-test. The statistical analysis was performed using the software SPSS 21.0 (SPSS Inc., Chicago, IL, USA) and GraphPad Prism 8 (GraphPad Prism software, La Jolla, CA, USA). The probability level p-value < 0.05 was adopted.
ResultsPatientsAll 53 patients were diagnosed according to the 2016 WHO Classification (eight cases with single lineage dysplasia-MDS-SLD, 12 MDS with ring sideroblasts (MDS-RS), 15 MDS with multilineage dysplasia (MDS-MLD), 17 MDS with excess blasts (MDS-EB1/EB2). Most patients were male (58.5%), and the mean age was 68 years (range 28–89 years). Patients were classified according to the IPSS-R, with a predominance of low risk (31.7%). The cytogenetic evaluation was performed for all cases, of which twenty-two (42.3%) presented a normal karyotype, 19 (36.5%) showed an abnormal karyotype and 11 (21.2%) presented no metaphases. The summary of clinical and laboratory characteristics is presented in Table 1.
Gene expression profile (mRNA)PD-L1 expression is associated with dyserythropoiesis in MDSPatients who presented dyserythropoiesis showed a significantly higher PD-L1 expression (median 3.740 × 10−495%, CI 0.000434228:0.000796652 versus the median 1.762 × 10− 495%, CI 0.000085460:0.000579451) (p= 0.050;Figure 1) than patients without dyserythropoiesis.

Three patients were significantly among the outliers in the dyserythropoiesis analysis and other analyses. These patients were over 60 years old, with blasts in the bone marrow (8.5%, 12%, and 14%), hemoglobin levels below 8 g/dL, and dysplasias. Regarding the karyotype, one of them presented a complex karyotype and two, no metaphases. All patients were classified as MDS with excess blasts and, of utmost importance, died during the study.
The upregulation of programmed death-ligand 1 is associated with excess blasts in MDS classificationPatients classified as having an excess of blasts 2 (MDS-EB2) (10–19% of blasts in bone marrow), according to the World Health Organization, presented a significant upregulation in mRNA expression of the PD-L1, compared to an excess of blasts 1 (MDS-EB1) (5–9% of blasts in bone marrow; mean: 9.653 × 10⁻⁴ and 95%CI: 0.000177820:0.001752955 versus 2.944 × 10⁻⁴ and 95%CI 0.000144278:0.000444522) (p= 0.050;Figure 2).
Kaplan-Meier survival analysis compared to MDS-EB2 (10–19% of blasts).")
The survival analysis was performed by the Kaplan-Meier method17 using the Long Rank test as a post-test. The outlier patients (worst prognosis) had a median of 14 months with a 95%CI from 1 to 34.8, while the other patients in the study had a median of 44 months with a 95%CI from 32.3 to 55.6 and the log-rank test with p= 0.018 (Figure 3).
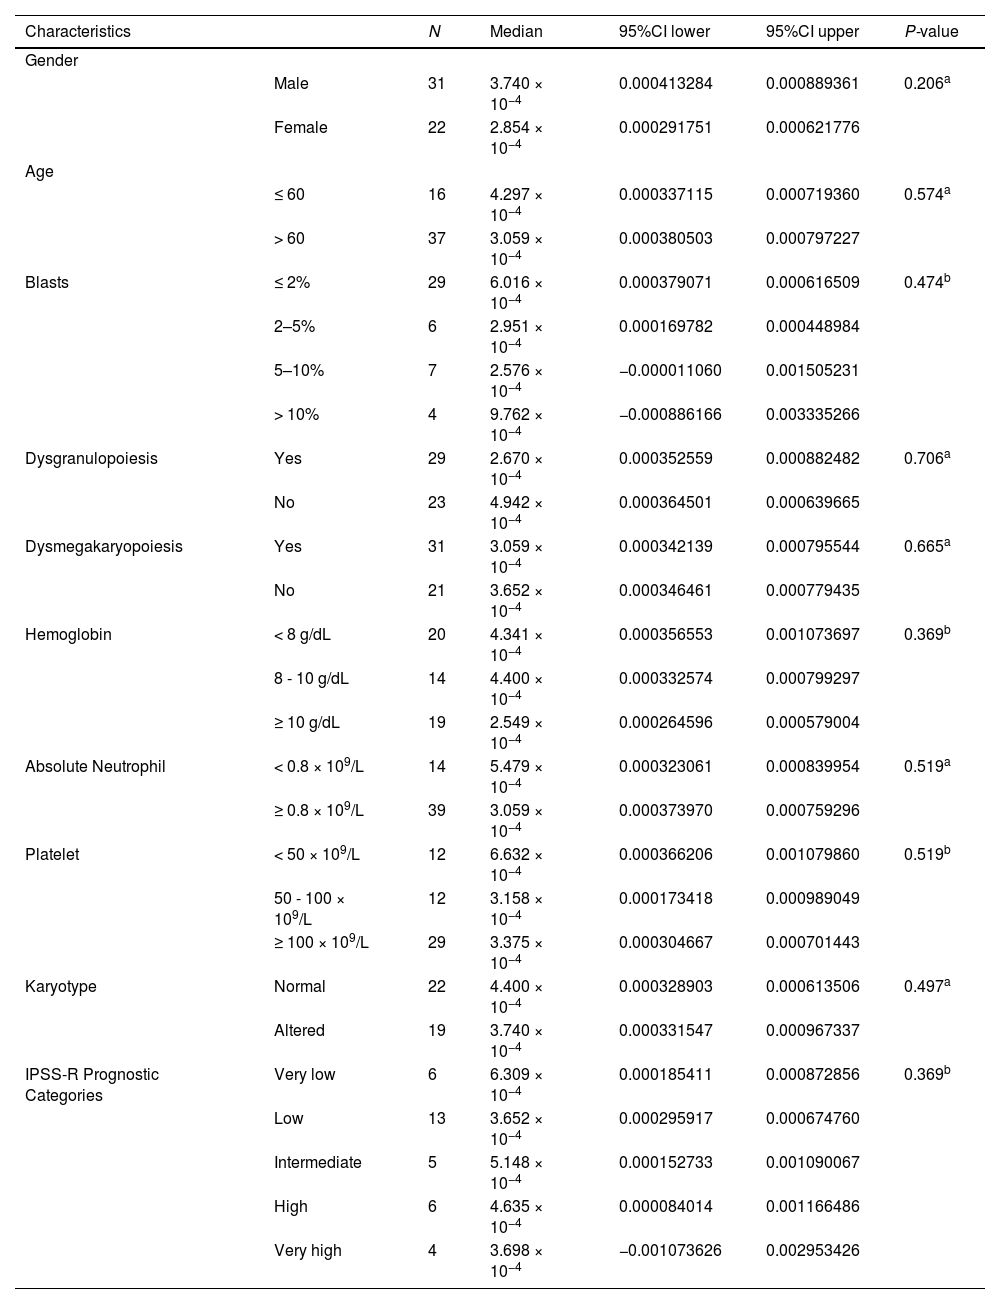
PD-L1 expression according to MDS clinical characteristics
We also evaluated other clinical variables. The statistical significance was not reached (Table 2).
PD-L1 expression according to MDS clinical characteristics.
| Characteristics | N | Median | 95%CI lower | 95%CI upper | P-value | |
|---|---|---|---|---|---|---|
| Gender | ||||||
| Male | 31 | 3.740 × 10⁻⁴ | 0.000413284 | 0.000889361 | 0.206a | |
| Female | 22 | 2.854 × 10⁻⁴ | 0.000291751 | 0.000621776 | ||
| Age | ||||||
| ≤ 60 | 16 | 4.297 × 10⁻⁴ | 0.000337115 | 0.000719360 | 0.574a | |
| > 60 | 37 | 3.059 × 10⁻⁴ | 0.000380503 | 0.000797227 | ||
| Blasts | ≤ 2% | 29 | 6.016 × 10⁻⁴ | 0.000379071 | 0.000616509 | 0.474b |
| 2–5% | 6 | 2.951 × 10⁻⁴ | 0.000169782 | 0.000448984 | ||
| 5–10% | 7 | 2.576 × 10⁻⁴ | −0.000011060 | 0.001505231 | ||
| > 10% | 4 | 9.762 × 10⁻⁴ | −0.000886166 | 0.003335266 | ||
| Dysgranulopoiesis | Yes | 29 | 2.670 × 10⁻⁴ | 0.000352559 | 0.000882482 | 0.706a |
| No | 23 | 4.942 × 10⁻⁴ | 0.000364501 | 0.000639665 | ||
| Dysmegakaryopoiesis | Yes | 31 | 3.059 × 10⁻⁴ | 0.000342139 | 0.000795544 | 0.665a |
| No | 21 | 3.652 × 10⁻⁴ | 0.000346461 | 0.000779435 | ||
| Hemoglobin | < 8 g/dL | 20 | 4.341 × 10⁻⁴ | 0.000356553 | 0.001073697 | 0.369b |
| 8 - 10 g/dL | 14 | 4.400 × 10⁻⁴ | 0.000332574 | 0.000799297 | ||
| ≥ 10 g/dL | 19 | 2.549 × 10⁻⁴ | 0.000264596 | 0.000579004 | ||
| Absolute Neutrophil | < 0.8 × 10⁹/L | 14 | 5.479 × 10⁻⁴ | 0.000323061 | 0.000839954 | 0.519a |
| ≥ 0.8 × 10⁹/L | 39 | 3.059 × 10⁻⁴ | 0.000373970 | 0.000759296 | ||
| Platelet | < 50 × 109/L | 12 | 6.632 × 10⁻⁴ | 0.000366206 | 0.001079860 | 0.519b |
| 50 - 100 × 109/L | 12 | 3.158 × 10⁻⁴ | 0.000173418 | 0.000989049 | ||
| ≥ 100 × 109/L | 29 | 3.375 × 10⁻⁴ | 0.000304667 | 0.000701443 | ||
| Karyotype | Normal | 22 | 4.400 × 10⁻⁴ | 0.000328903 | 0.000613506 | 0.497a |
| Altered | 19 | 3.740 × 10⁻⁴ | 0.000331547 | 0.000967337 | ||
| IPSS-R Prognostic Categories | Very low | 6 | 6.309 × 10⁻⁴ | 0.000185411 | 0.000872856 | 0.369b |
| Low | 13 | 3.652 × 10⁻⁴ | 0.000295917 | 0.000674760 | ||
| Intermediate | 5 | 5.148 × 10⁻⁴ | 0.000152733 | 0.001090067 | ||
| High | 6 | 4.635 × 10⁻⁴ | 0.000084014 | 0.001166486 | ||
| Very high | 4 | 3.698 × 10⁻⁴ | −0.001073626 | 0.002953426 | ||
Abbreviations: IPSS-R, Revised International Prognosis Score System.
The immune dysregulation began to be explored in recent decades as an essential component in the pathogenesis of the MDS.18,6 The MDS heterogeneity makes it difficult to determine an immunological profile that can be explored in immunotherapy studies. Several drugs targeting the PD-1/PD-L1 pathway have been tested in the MDS and the results are still contradictory.19–21 In this study, we sought to associate the PD-L1 gene expression levels with clinical and prognostic characteristics to contribute to the research directing patients to treatment with checkpoint inhibitor drugs.
The PD-L1 overexpression in bone marrow cells of MDS patients was directly linked to unfavorable prognostic markers, such as the dyserythropoiesis and the most advanced subtype according to the WHO 2016 Classification.22 The dyserythropoiesis occurs when there are 10% or more dysplastic erythroid cells in the bone marrow and affects about 80% of patients with MDS.23 Recent work by our group has suggested the hyperactivation of the toll-like receptor 3 (TLR-3) by endogenous retroviruses (ERVs) as the trigger of the dyserythropoiesis in MDS.24 In addition, the TLR-3-ERV axis has also been identified as an interferon response inducer through the interferon regulatory factor 3 (IRF3), IRF7 and nuclear factor kappa B (NF-kB). In cancers, NF-kB directly induces the expression of the PD-L1 through binding to its promoter and post-transcriptionally by indirect pathways.25 Thus, we speculate that this would be a line between dysplasias, ERVs and PD-L1.
Hypomethylating agents (HMAs) are the primary drugs used for high-risk MDS, such as the MDS-EB2 subtype. These drugs, including the 5-azacytidine (AZA) and 5-aza-2′deoxycytidine (DEC), act as inhibitors of DNA methyltransferase and lead to DNA demethylaton. The DNA demethylation restores the transcription of many silenced genes, including tumor suppressors.26 Evidence has already shown, however, that patients in treatment with HMAs have a loss of response after approximately two years of treatment.27,28 Chiappinelli et al. showed that PD-L1 levels are upregulated after using HMAs.29 An increase in PD-L1 levels after using HMAs is possibly associated with the tumor escape and loss of response to the treatment.30 Based on our findings, we hypothesize that these high-risk patients with higher levels of PD-L1 may be more resistant to HMA therapy and an alternative management could be an association between HMAs and PD-L1 checkpoint inhibitors.
Another recent study by Sallam et al. found that bone marrow stem cells from MDS patients with mutations in the TP53 gene had a higher expression of the PD-L1 than those with the wild-type TP53 gene.13 Mutations in the TP53 tumor suppressor gene confer a poor prognosis in the myelodysplastic syndrome. Even in patients with a good prognostic karyotype, such as the deletion in the long arm of chromosome 5 (5q-), a second mutation in the TP53 completely transforms the course of the disease, leading the patient to a high-risk condition with a lower survival.31 Different from the findings by Salman et al., which did not find significant differences between disease subtypes and the PD-L1 expression, our results showed a statistically significant increase in the MDS-EB2 versus MDS-EB1 subtypes and, despite the statistics, patients classified in the MDS-EB2 showed a higher expression of the PD-L1 than all other subtypes in our cohort.
A study performed on AML patients demonstrated that the loss of the p53 leads to the PD-L1 expression through the p53/miR34/PD-1 pathway.32 The p53 molecule induces the expression of the microRNA-34, inhibiting the expression of the PD-L1 by binding to the 3′UTR regulatory region of the gene.33 In MDS, we believe that, similar to AML, mutations in the TP53 that directly reflect the p53 protein deregulate the miR-34 pathway and increase the expression of the PD-L1. Unfortunately, our data lacks a mutational analysis of the TP53 gene and microRNA expression. Nevertheless, we believe that our data indicate that the PD-L1 expression is a biomarker of a worse prognosis in the MDS.
Regarding our predominant group of outliers, we had a complex karyotype result in one of the three. Williams et al. observed a higher rate of the PD-L1 expression in bone marrow blasts of AML patients with complex karyotypes.34 Chromosomal instability and defects in DNA repair pathways are involved in the pathogenesis of high-risk MDS, which often has an accumulation of mutations.35,36 Studies suggest that tumors with defects in DNA repair pathways present a higher expression of the PD-L1 due to the context of genomic instability that favors the generation of neoantigens and, consequently, activation of the INF and PD-L1.37,38 Possibly, targeting anti-PD-L1 therapies to patients with MDS who have cytogenetic abnormalities and a high mutational load, particularly in DNA repair pathways, are more susceptible to a positive therapeutic response.
ConclusionIn conclusion, we believe that the PD-L1 expression data presented here in our cohort were associated with worse prognosis markers, such as the dyserythropoiesis and its worst subtype, MDS-EB 2. We speculate that the increase in PD-L1 levels after using hypomethylating agents is one of the factors responsible for the loss of response to this treatment. An initial combination of HMAs with PD-L1 inhibitors should be tested in clinical trials. In the group of outliers, the idea remains that the high expression of the PD-L1 is a biomarker of a worse prognosis in MDS, but with great possibilities of targeting anti-PD-L1 therapy.
Ethical approvalAll procedures were approved by the Ethics Committee of the UFC (No. 69366217.6.0000.5054) and are in accordance with the 1964 Helsinki Declaration and its later amendments. Informed consent was obtained from all individual participants included in the study.
Author contributionsLRS, BFV, SMMM and RFP designed the study, provided patient materials and were responsible for collection and assembly of data. MAV, VSO, MMLM, RTGO and DPB performed the molecular procedures and analyzed the data. All authors drafted and edited the manuscript and have approved the final version of the manuscript before publication.


