


Acute leukemias (ALs) are aggressive diseases that lead to death without medical attention. We evaluated the association between delays in diagnosis and poor outcomes in AL by evaluating the symptom onset to treatment intervals in adults with newly diagnosed AL and their effect on an early death (ED).
MethodsWe assessed adults diagnosed with AL between 2015 and 2020 and evaluated baseline characteristics, the patient interval (PI), diagnostic interval (DI), treatment interval (TI) and the total time interval (TTI) to determine ED-associated factors.
Main resultsWe assessed 102 patients with acute lymphoblastic leukemia (ALL), 57 with acute myeloblastic leukemia (AML) and 29 with acute promyelocytic leukemia (APL). Median interval days were PI 14, DI 10, TI 4 and TTI 31.5. The TI and TTI intervals were lower in APL than in ALL and AML; TI 1 vs. 4 and 3 (p = 0.001) and TTI 21 vs. 31 and 35 (p = 0.016). The 30-day and 60-day EDs were 13.8% and 20.7%, mainly infections. ECOG > 2 (OR = 15.0) and PI < 7 days (OR = 4.06) were associated with 30-day ED; AML (OR = 2.69), high-risk (OR = 3.34), albumin < 3.5 g/dl (OR = 5) and platelets < 20 × 103/uL (OR = 2.71) with a 60-day ED.
ConclusionNone of the interval-delays were associated with an ED. Intervals seemed to be longer in patients without an ED, except for the TI, probably because of “the waiting time paradox.” Aggressive manifestations of disease may lead to shorter diagnostic intervals, but increased mortality.
Acute leukemias (ALs) are malignant hematological disorders with a high impact on the general population across the world. They are responsible for many cancer-related deaths and constitute a considerable healthcare cost burden.1-2
Prognostic factors in AL have changed due to risk-adapted treatment regimens, but in general, they depend on baseline characteristics, including, age, comorbidities, leukocyte count and genetic and molecular abnormalities, and show extensive disease heterogeneity.3-6
There is a well-described association between delays in diagnosis and poor outcomes in some solid tumors7; however, data gathered from those studies cannot be applied to hematological malignancies due to their rarity, insidious clinical presentation and the need for specific laboratory tests, resulting in difficult diagnostic pathways that usually require multiple primary care consultations.8
The AL has been associated with a shorter time to diagnosis, compared to other hematological malignancies,9-11 but its impact on an early death (ED) or long-term outcomes in adults has not been well-established. Recently, time of diagnosis to treatment has been explored in AML and showed no relation to survival12; however, a previously study has shown that delaying treatment does not seem harmful in older patients, but is detrimental in younger patients.13 Some studies on the pediatric population with AL did not show a significant association between delay intervals and an ED.14-16
The pathway leading to cancer diagnosis and initiating treatment has been historically longer in middle-income countries (MICs). Both are associated with advanced-stage disease and contribute to high mortality rates in these countries.17 Mexico, like other MICs, faces many challenges in caring for patients with cancer, including the turnaround time for getting all the results and the limited availability of such tests might delay the initiation of the treatment. The number of practicing physicians is lower than that recommended by The Organization for Economic Co-operation and Development; there is < 1 hematologist/100,000 people and the medical attention is centralized in big cities.18
This study was performed at an academic hematology center in Mexico City and evaluated the time intervals between the first symptoms to the initiation of the treatment in adults with newly diagnosed AL and the effect on the ED.
Patients and methodsPopulation studyWe evaluated all consecutive patients ≥ 18 years with newly diagnosed acute lymphoblastic leukemia (ALL), acute myeloid leukemia (AML) or acute promyelocytic leukemia (APL) by the WHO criteria19 from January 2015 to March 2020, in the Hematology Department of the Instituto Nacional de Ciencias Médicas y Nutrición in Mexico City. Patients treated at the same Institution with secondary leukemia caused by the primary disease, who refused any treatment or did not have a follow-up, were excluded.
Study designThis retrospective cohort study included data extracted from the electronic medical record, baseline characteristics, such as age, with the adolescent and young adult (AYA) being < 39 years, gender, body mass index (BMI), socioeconomic level classification (low versus not low),20 education, Charlson comorbidity index (CCI), Eastern Cooperative Oncology Group (ECOG) performance status (0–2 versus > 2), presence of comorbidities, complete blood count (CBC), blast count in bone marrow aspiration, liver function tests (LFTs), creatinine level (mg/dl), presence of symptoms, fever, infection, tumor lysis syndrome (TLS), according to the Cairo-Bishop criteria, and number of consultations after the first symptoms were recorded. The AML was classified as low-, intermediate-, or high-risk, according to the European Leukemia Net.4 The APL was classified as low-, intermediate-, or high-risk as per the Sanz criteria.5 The ALL was classified as high-risk, according to the presence of at least one of the following criteria: hyperleukocytosis (white blood cells 30 × 109/L for B-cell ALL or > 100 × 109/L for T-cell ALL), or a complex karyotype.6 The chemotherapy was classified as intensive (Hyper-CVAD,21 CALGB 10,40322, 7 + 3 (7-day continuous infusion of cytarabine 100 to 200 mg/m2 associated with an anthracycline on days 1 to 3) and AIDA regimens23), non-intensive (mini-Hyper-CVAD without the antibody-drug conjugate therapy,24 low-dose cytarabine (20 mg subcutaneous twice per day on days 1 to 10), azacytidine monotherapy (75 mg/m2 subcutaneous per day on days 1 to 7)) or palliative (support treatment only)), according to the medical decision and available institutional regimens. The support treatment included prophylactic antibiotics, according to the ASCO/IDSA guidelines25 and the use of granulocyte colony-stimulating factor during neutropenic fever after the induction scheme, according to the treating physician. We defined the following intervals (number of days): patient interval (PI), from the first symptom to the first medical consultation (including symptomatic patients only); diagnostic interval (DI), from the first medical consultation to the diagnosis (the day of the bone marrow aspiration); treatment interval (TI), from the diagnosis to treatment initiation (including patients who received chemotherapy, or in APL patients, the day of the administration of the all-trans retinoic acid); total time interval (TTI), from the first symptom to the treatment initiation. We evaluated the complete response (CR) after the induction treatment and estimated overall survival (OS) to define the response to the treatment. The CR was established in accordance with the Cheson criteria, that states the absence of extramedullary leukemia, the lack of peripheral blood blasts, a bone marrow blast percentage below 5%, a neutrophil count ≥ 1.5 × 10⁹/L, and platelets ≥ 100 × 109/L.26 The OS was the time interval between the diagnosis and the patient's death or the last day of the follow-up. Interval delays refer to periods over the interquartile range (IQR) of the median time expected. The ED was defined as that which occurred within 60 days of the diagnosis. We divided the ED into 30-day mortality and 60-day mortality to analyze the associated factors because both periods have been previously reported in the literature.
Statistical analysisStandard descriptive statistics were expressed as median and IQR or mean and standard deviation, according to the normality, or, when appropriate, absolute counts and percentages. Differential characteristics of groups of patients according to the leukemia type and interval delay were compared by statistical tests (the χ2 test for categorical variables, Student's t-test and the ANOVA test for parametric variables and the Mann–Whitney U test and Kruskal–Wallis test for non-parametric variables). We considered a p-value < 0.05 statistically significant. The Kaplan–Meier approach was chosen for the OS, using the log-rank test. We calculated the odds ratio (OR) and performed a logistic regression to identify factors associated with an increased risk for an ED, including variables that were statistically significant (p < 0.05) in the univariate analysis. All analyses were performed with the SPSS software (version 22).
ResultsBaseline characteristicsA total of 188 patients with newly diagnosed AL met the eligibility criteria and 96 (51%) of these were women, the median age was 37 years (IQR, 24–54) and 54.8% were AYA. The median BMI was 25.2 (IQR, 22.7–29.3) and 19.7% were obese (BMI > 30); 71 patients (37.8%) had at least one comorbidity; 12.2% had diabetes mellitus, 60.4% had a CCI < 3, and 95.7% (180 patients) had an ECOG of 0–2. Only 44.1% (83 patients) were residents of Mexico City; 20% (39 patients) had a university degree and 80.3% had a low socioeconomic level (LSL). Related symptoms were present in 97.3% of the patients. The patients consulted with a median of three physicians (IQR, 2–4) before consulting with a hematologist. The first medical contact was a primary care physician (63.2%) and the remaining went to the emergency room. There was no difference in the previous variables compared between AL subtypes.
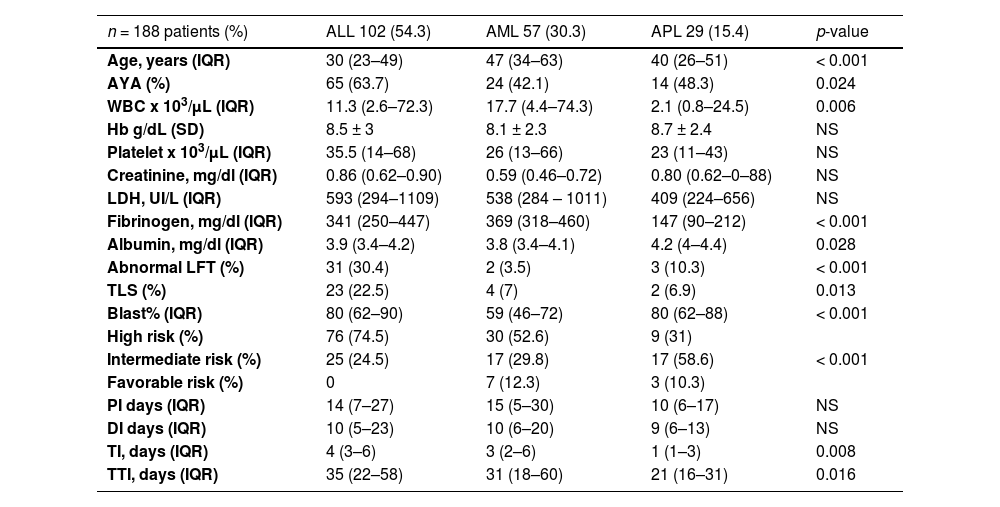
The more prevalent AL was ALL in 102 patients (54.3%), followed by AML, 57 patients (30.3%) and APL, 29 patients (15.4%). According to the previously mentioned criteria, of 184 patients, 61.2% were high-risk, 31.4%, standard/intermediate-risk and 5.3%, favorable-risk; 4 patients had no risk classification due to incomplete data. The blood test, clinical characteristics and the median interval times of the ALs are shown in Table 1 and Figure 1.
Clinical characteristics of acute leukemias.
ALL: acute lymphoblastic leukemia; AML: acute myeloblastic leukemia; APL: acute promyelocytic leukemia; IQR: interquartile range; AYA: adolescents and young adults; WBC: white blood count; LFT: liver function test; TLS: tumor lysis syndrome; TTI: total interval; TI: treatment interval; CTX: chemotherapy; WHO: World Health Organization; AKI: acute kidney injury; KDIGOs: kidney disease improving global outcomes; CR: complete response; OS: overall survival.
 of acute leukemias.")
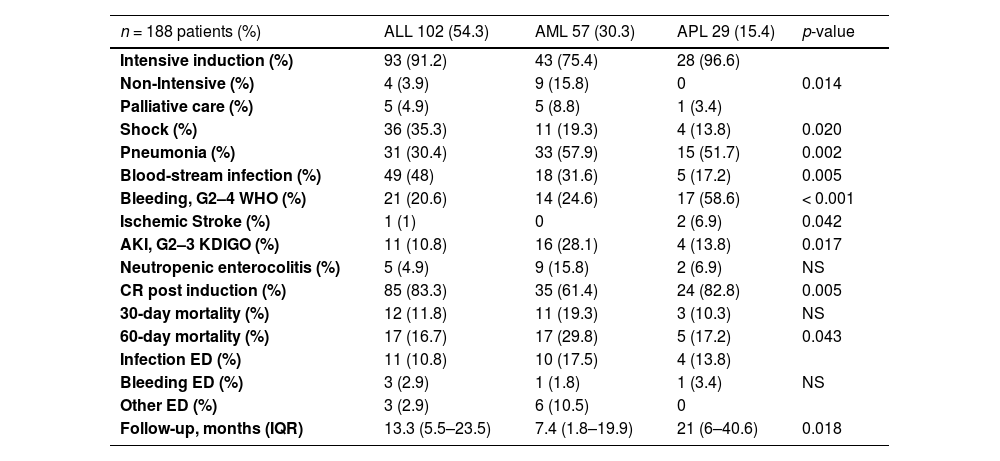
Intensive induction therapy, according to the institutional protocol, was offered to 164 patients (87.2%), non-intensive induction therapy to 13 patients (6.9%) and palliative care to 11 patients (5.9%) (Table 2). After the diagnosis, the median hospital stay was 34 days (IQR, 26–44). The induction complications: pneumonia in 42%, blood-stream infection, 38%, septic shock, 27%, acute complicated urinary tract infection, 23%, sinusitis, 17%, soft tissue infection (STI), 16%, Clostridioides difficile infection, 11%, neutropenic enterocolitis, 8%, odontogenic infection, 7%; hepatotoxicity 35% (G3 - 4 in 37 patients), bleeding, 33% (G3 - 4 in 31 patients), acute kidney injury, 22% (G3 in 13 patients), ischemic stroke, 1.5%, and; appendicitis, 5%. Forty-eight patients (25.5%) required intensive care and 34 (18%), invasive mechanical ventilation.
Outcomes and complications between acute leukemias.
ALL: acute lymphoblastic leukemia; AML: acute myeloblastic leukemia; APL: acute promyelocytic leukemia; WHO: World Health Organization, KDIGOs: kidney disease improving global outcomes; ED: early death; IQR: interquartile range.
The gram-negative bacilli (42.6%) and gram-positive cocci (8.5%) were identified in culture isolates. In total, 57 patients were suspected of having a fungal infection and, among these, 22 (12.5%) had a proven fungal infection. The previous complications that were different among the AL types are shown in Table 2.
The CR was achieved in 76.6% of the AL patients. An ED occurred in 39 patients (20.7%). The main causes of the ED were infection in 25 patients (64%), bleeding in 5 (12.8%) and other causes in 9 (23%). Most of them (66%) died in the first 30 days. At the time of the analysis, 51.5% of the cases had survived (ALL, 47.1%, AML, 43.9%, and APL, 82.8%; p=0.001), with a median follow-up of 12.9 months (IQR, 3.86 – 25.6) (Table 2). The median OS of each type of AL is shown in the Figure 2, with ALL at 19.5 months (95% CI 14.5–24.6), AML, 14 months (95% CI 2–26), and APL not reached.
Factors associated with early death
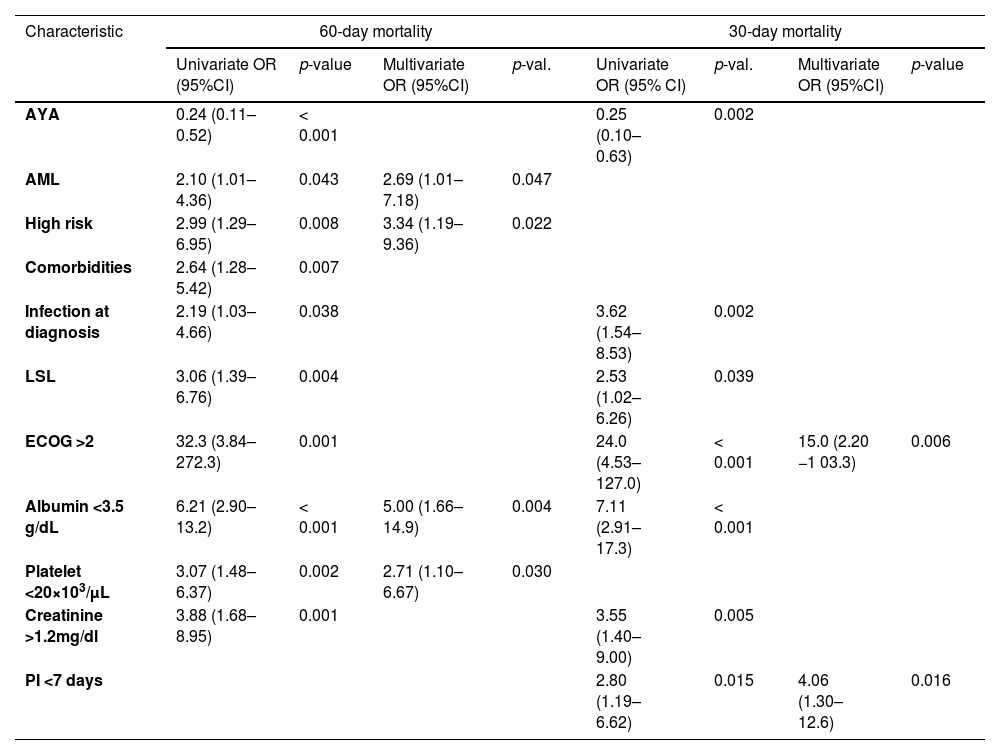
All the variables associated with an ED are shown in Table 3. In patients with an ED (n = 39, 20.7%), none of the intervals were statistically significant, compared to those who survived (n = 149, 79.3%). Among patients with an ED in the first 30 days (n = 26, 13.8%), compared to those who survived (n = 162, 86.2%), the PI was 7 days (IQR, 2–13) vs. 15 days (IQR, 7–28; p = 0.004), respectively.
Factors associated with early death in acute leukemia.
OR: odds ratio; CI: confidence interval; AYA: adolescent and young adults; AML: acute myeloblastic leukemia; LSL: low-socioeconomic level; PI: patient interval.
Forty-six patients (24.4%) met the criteria for the TTI delay (> 52 days). When compared to patients without the TTI delay criteria (n = 142, 75.6%), we found that the main associated factors in the univariate analysis that prevented the TTI delay were the first medical contact at the emergency room (p = 0.019) and the presence of fever at diagnosis (p = 0.042).
Thirty-nine patients (21.3%) had a PI delay (> 27 days), compared to those who did not (n = 149, 78.7%). An infection at diagnosis (p = 0.041), ICU at admission (p = 0.041) and a lower first 30-day mortality (p = 0.022) were statistically significant protective factors. Furthermore, patients with a PI delay had a longer DI (15 vs. 9 days; p = 0.012), lower hemoglobin levels (7.26 vs. 8.6 g/dl; p = 0.039), higher albumin levels (4.1 vs. 3.9 g/dl; p = 0.015), and a longer hospital stay (38 vs. 33 days; p = 0.039).
Forty-two patients (22.3%) had a DI delay (> 20 days), compared to those who did not (n = 146, 87.3%). The first medical contact at the emergency room (p = 0.024), neutropenic colitis (p = 0.032) and the STI (p = 0.001) were statistically significant protective factors. Furthermore, patients with a delayed DI had a lower BMI (24.1 vs. 25.9; p = 0.038), lower creatinine levels (0.74 vs. 0.86 mg/dl; p = 0.006) and longer TI (5 vs. 3 days; p = 0.002), compared to those who did not.
Twenty-five patients (14.1%) had a TI delay (> 6 days). None of the patients with APL were included in the group with the TI delay. Up to 46.2% of the patients who received a low-intensity chemotherapy scheme were in the TI delay group (p = 0.001). Patients with a TI delay had an increased association with a higher ECOG > 2 (p = 0.008) and septic shock (p = 0.014), compared to those who did not (n = 163, 86.9%). Furthermore, patients with a TI delay had lower hemoglobin levels (7.05 vs. 8.4; p = 0.012), lower LDH levels (330 vs. 565 UI/L; p = 0.026), a higher number of previous consultations (4 vs. 3; p = 0.025) and a shorter follow-up (227 vs. 442 days; p = 0.036), compared to those without a TI delay. When the OS of patients with and without a TI delay was analyzed by the Kaplan-Meier method, it was not statistically significant (log rank, p = 0.136).
None of the interval delays were associated with an ED.
DiscussionIn this study, we described the characteristics of a large young (54% AYA) and economically active population of patients with an AL who live outside of Mexico City. We found that the median interval times were: PI, 14 days (IQR, 6–27), DI, 10 days (IQR, 6–20), TI, 4 days (IQR, 2–6) and TTI, 31.5 days (IQR, 20–52).
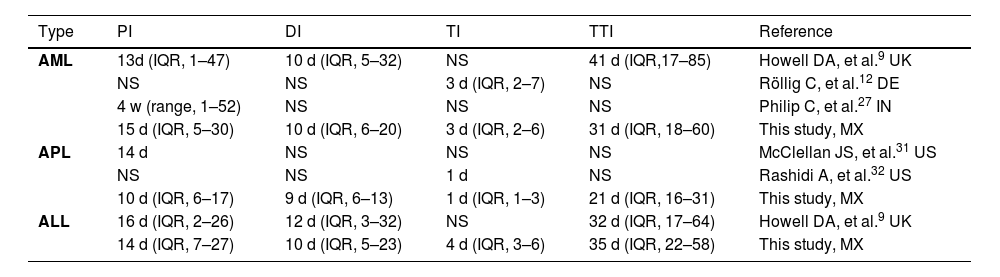
The median interval times (PI, DI, TI, TTI) reported in our study population were not different, compared to those in other studies, or even those in high-income countries (HICs), as shown in Table 4. However, some limitations of those studies hinder the data interpretation of their results and limit the comparison to our study. In a United Kingdom study, the data were collected by questionaries delivered several weeks after the diagnosis was made. Only patients who were not severely ill (and alive) could fill them out.9 In a study from India, only patients who received treatment (a third part) had a shorter PI.27
Previous published studies describing diagnosis and treatment intervals in adults with acute leukemia.
| Type | PI | DI | TI | TTI | Reference |
|---|---|---|---|---|---|
| AML | 13d (IQR, 1–47) | 10 d (IQR, 5–32) | NS | 41 d (IQR,17–85) | Howell DA, et al.9 UK |
| NS | NS | 3 d (IQR, 2–7) | NS | Röllig C, et al.12 DE | |
| 4 w (range, 1–52) | NS | NS | NS | Philip C, et al.27 IN | |
| 15 d (IQR, 5–30) | 10 d (IQR, 6–20) | 3 d (IQR, 2–6) | 31 d (IQR, 18–60) | This study, MX | |
| APL | 14 d | NS | NS | NS | McClellan JS, et al.31 US |
| NS | NS | 1 d | NS | Rashidi A, et al.32 US | |
| 10 d (IQR, 6–17) | 9 d (IQR, 6–13) | 1 d (IQR, 1–3) | 21 d (IQR, 16–31) | This study, MX | |
| ALL | 16 d (IQR, 2–26) | 12 d (IQR, 3–32) | NS | 32 d (IQR, 17–64) | Howell DA, et al.9 UK |
| 14 d (IQR, 7–27) | 10 d (IQR, 5–23) | 4 d (IQR, 3–6) | 35 d (IQR, 22–58) | This study, MX |
PI: Patient interval; DI: Diagnostic interval; TI: Treatment interval; TTI: Total interval; ALL: acute lymphoblastic leukemia; AML: acute myeloblastic leukemia; APL: acute promyelocytic leukemia; NS: Not specified, d: days, w: weeks.
Our study demonstrated that AL patients were younger and had a slight superiority of ALL to AML, compared to HIC patients.28 This is consistent with the epidemiology in Latin America and other developing countries.28-29 Unfortunately, more than 1 of 5 patients in our study presented with an ED, the majority due to infections, followed by bleeding complications, similar to the data reported around the world: AML in India, 24.7%,27 Brazil, 26%30; APL in the USA 17–26%,31-32 Brazil, 20%,33 and; ALL in Brazil, 17%.34
The variables at diagnosis associated with ED (60-day mortality) in the multivariate analysis were the presence of AML, a high-risk stratification, hypoalbuminemia and a low platelet count. However, we acknowledge that they may differ among leukemia subtypes. When the ED in the first 30 days was analyzed, the associated risk factors were an ECOG > 2 and a PI < 7 days. We found that a PI less than 7 days was a risk factor for an ED in the first 30 days (OR = 4.05, 95%CI 1.30–12.6; p = 0.016). This finding has been previously reported in a study from China, where the APL patients with an ED had a shorter interval from the onset of symptoms to the diagnosis.35 Delays in any of the time intervals were not a risk factor for the ED. However, all the intervals, except for the TI, seem to be longer in patients without an ED. In a pediatric population with cancer (including AL), Jin et al. found that a longer PI had a longer OS,36 probably because of “the waiting time paradox.” An aggressive manifestation of the disease may be easier to approach, leading to shorter diagnostic intervals, but also has an increased mortality.37 This finding was supported by our results because these patients had a higher frequency of severe manifestations, such as fever and infection at diagnosis, ICU admission and hypoalbuminemia. Other studies in AML,27,38 APL,32,35 and ALL16 have also reported no association between delays in treatment initiation and death. Surprisingly, we did not find an association between interval delays and age, gender or socioeconomic level, factors that have been previously associated with hematologic malignancies in adults.9,39
In our study population, with patients who are younger and present more ALL and APL and have a higher probability of survival, it could be wise to adopt a navigation patient model, a promising intervention that addresses cancer disparities and allows for a reduction in times, despite the challenges of a MIC, with the lack of infrastructure, human resources and funds,40 and with the goal of increasing survival as a result of decreasing complications.
Our study should be interpreted in the context of its limitations. First, due to the nature of the study design, there could had been bias in the data retrieval. However, since we consecutively analyzed the data of every patient with AL types diagnosed and treated at our hospital, this should be an issue. Finally, this information is from one center, although it is a reference center for hematologic diseases, we cannot effectively rule out partial population skewing.
Nevertheless, to our knowledge, this study is the first in an adult population with an AL using real-world data in a MIC setting that reports an insight on the intervals from the first symptom to the initiation of the treatment and its association with early outcomes. Furthermore, we have accounted for all possible confounders in the multivariable analysis to reduce bias to a minimum. We also thoughtfully described baseline characteristics of the AL patients and induction chemotherapy complications. In conclusion, in our adult Mexican population with newly diagnosed AL, interval delays did not impact early outcomes.
Ethics approvalThe protocol was approved by the local ethics committee (The Instituto Nacional de Ciencias Médicas y Nutrición Salvador Zubirán Research and Ethics Committees, reference number HEM-4063-22-22-1).
Financial declarationThe present study was partially financed by the Carlos Slim Foundation (Becas Impulso a la Investigación en Salud).
We thank all of the patients and their families, who trusted us and contributed to improve our knowledge on this disease, and Sergio Lozano–Rodríguez, M.D., for his critical review of the manuscript.


