

We read with great interest the article entitled “Trends in mortality of adult patients diagnosed with myeloid leukemia from 1994 to 2011 in southeastern Brazil” by Callera et al. published in the Revista Brasileira de Hematologia e Hemoterapia (2015;37(1):7–11),1 and we would like to make some comments.
The subject of the article is very important for clinical oncology and cancer surveillance as it presents a time series analysis showing a declining trend in mortality from myeloid leukemia in one area of the richest region of Brazil. It is understood that this decline is a result of the improving quality of access to health services with early diagnosis of the disease and clinical management. However, Brazil is the size of a continental and, therefore, we believe it is important to observe the trend of mortality due to myeloid leukemia in other regions of Brazil and the country as a whole.
In 2014, the Brazilian National Cancer Institute estimated the incidence of leukemia in Brazil to be around 5050 and 4320 new cases for men and women, respectively. Excluding non-melanoma skin tumors, leukemia is the fifth most common cancer in men in the Northern Region of the country (3.57/100,000) and in the Northeastern Region, it is the eighth most common (4.15/100,000). However, in the South (8.13/100,000), Southeast (5.42/100,000) and Midwest (4.14/100,000), it is ranked the tenth most common cancer. For women, it is the seventh most common cancer in the North (2.81/100,000), the eighth most common in the South (6.30/100,000) and in the Northeast (3.40/100,000), it is ranked the tenth most common malignancy. In the Southeast (4.50/100,000) and Midwest (3.41/100,000), it is the eleventh most frequent.2
This inconsistency has been observed worldwide. GLOBOCAN estimates the global prevalence of leukemia to be 4.7/100,000 inhabitants. The same report shows, however, that there are differences in the rates when comparing medium (3.8/100,000) and under (2.5/100,000) developed countries. With regard to mortality, the global estimate is 3.4/100,000 inhabitants, 3.2/100,000 for medium and 2.4/100,000 for under development countries.3
By using a methodology4 similar to Callera et al.,1 we identified important differences in different Brazilian regions. Myeloid leukemia mortality rates between 1980 and 2012 are different when stratified by gender. The rates in men are consistently higher [in 1987 in Brazil (24.65%), in 1988 in the Midwest (42.71%), in 1982 in the Northeast (40.78%), in 1985 in the North (71.79%) and, more recently, in 2003 in the Southeast (26.13%) and the South (34.67%)], which may point to important differences between the genders. In addition, the rates are consistently higher in the Southeast and South, regardless of gender, which shows regional differences in the impact of the disease (Figure 1).

Regarding the trend, there is a difference related to gender and region. For males, there was a significant increase in the incidence rates in Brazil between 1980 and 2005. After 2005, there was a statistically non-significant drop in the rates. In the Midwest, North and South, there were significant and linear increases for the entire period. For the Northeast, there were two periods of significant increases (at different degrees): 1980–1997 and 1997–2007. Since then, there has been no significant decrease. The Southeast has shown a significant reduction in rates from 2001, after a period of significant increases between 1980 and 2001.
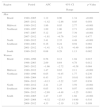
For women, Brazil has seen a statistically significant decline since 2003, although the rate increased between 1980 and 1996, and from 1996 to 2003, by different extents. The Northern region and Midwest have had significant linear increases in rates for the whole period, similar to males. The Northeast has shown a cyclic fluctuation, with a non-significant increase between 1980 and 1996, a significant increase between 1996 and 2004, and a non-significant decline between 2004 and 2012. The Southeast and South showed significant increases between 1980 and 2004, and 1980 and 2005. After that, a non-significant decrease was seen (Table 1).
Annual percentage change in the leukemia mortality rate adjusted for age by gender.
| Region | Period | APC | 95% CI | p-Value | |
|---|---|---|---|---|---|
| Range | |||||
| Men | |||||
| Brazil | 1980–2005 | 1.12 | 0.90 | 1.34 | <0.001 |
| 2005–2012 | −1.42 | −2.86 | 0.05 | 0.058 | |
| Midwest | 1980–2012 | 1.86 | 0.95 | 2.77 | <0.001 |
| Northeast | 1980–1997 | 1.89 | 1.06 | 2.71 | <0.001 |
| 1997–2007 | 5.12 | 2.95 | 7.39 | <0.001 | |
| 2007–2012 | −1.81 | −6.76 | 3.43 | 0.477 | |
| North | 1980–2012 | 3.41 | 2.35 | 4.48 | <0.001 |
| Southeast | 1980–2001 | 0.16 | 0.24 | 0.94 | 0.002 |
| 2001–2012 | −1.41 | −2.31 | −0.49 | 0.004 | |
| South | 1980–2012 | 0.68 | 0.29 | 1.13 | 0.002 |
| Women | |||||
| Brazil | 1980–1996 | 0.58 | 0.12 | 1.04 | 0.015 |
| 1996–2003 | 2.69 | 0.64 | 4.78 | 0.012 | |
| 2003–2012 | −1.66 | −2.72 | −0.58 | 0.004 | |
| Midwest | 1980–2012 | 1.47 | 0.82 | 2.11 | <0.001 |
| Northeast | 1980–1996 | 0.65 | −0.45 | 1.77 | 0.236 |
| 1996–2004 | 6.43 | 2.41 | 10.61 | 0.003 | |
| 2004–2012 | −0.13 | −3.22 | 3.07 | 0.936 | |
| North | 1980–2012 | 2.41 | 1.25 | 3.59 | <0.001 |
| Southeast | 1980–2004 | 0.65 | 0.34 | 0.97 | <0.001 |
| 2004–2012 | −2.88 | −4.48 | −1.25 | 0.001 | |
| South | 1980–2005 | 1.47 | 1.07 | 1.88 | <0.001 |
| 2005–2008 | −6.32 | −23.63 | 14.90 | 0.516 | |
| 2008–2012 | 4.33 | −2.19 | 11.29 | 0.189 | |
APC: annual percent change; 95% CI: 95% confidence interval.
Today, the prognosis for patients with leukemia is better than in previous years. Primary and secondary prevention strategies have provided increased survival rates for patients suffering from myeloid leukemia.5 Both incidence and mortality rates are difficult to interpret because leukemia is often diagnosed incidentally or while evaluating other conditions. Therefore, differences in medical care may be a substantial bias in respect to incidence data. Moreover, due to differences in access to treatment, there are considerable variations in survival rates worldwide, which may explain the differences in the rates in specific regions of Brazil.
There are also huge regional differences related to secondary prevention strategies, which are better in the South and Southeast, and worse in the North and Northeast. Nonetheless, some particularities ought to be considered when discussing risk factors. For example, there are places in the North where the soil has a natural source of radiation and Brazil has the highest rate of pesticide use in the world.
Finally, drops in mortality rates are associated with the improvement of the use of antibiotics, such as voriconazole, caspofungin and piperacillin/tazobactam, which have low toxicity (less renal and hepatic lesions).
In summary, we believe that a time trend analysis is a relevant tool to analyze health status. The decrease in leukemia in the Paraíba Valley, São Paulo, clearly shows the impact that the organization of services (for early diagnosis, appropriate treatment and reducing exposure to environmental agents) has on disease control. Considering the diversity of existing trends in Brazil, it is important to identify areas where the trend is still increasing in order to adapt public health strategies from where the trend is decreasing to achieve a positive result in the country as a whole.
Conflicts of interestThe authors declare no conflicts of interest.


