Sickle cell anemia is a monogenic disorder caused by a mutation in the β-hemoglobin gene, resulting in sickle hemoglobin that can polymerize. Presentation and clinical course have significant inter-individual variability and classifying these patients for severity is a challenge.
MethodsWe applied hierarchical clusters with 10 routine laboratory tests to understand if this grouping could be associated with clinical manifestations. We included 145 adult homozygous patients (SS) at an outpatient clinic in a retrospective study.
ResultsWe found five clusters by counting those that had been differentiated by unconjugated bilirubin, reticulocytes, LDH, leukocytes, lymphocytes and monocytes. When comparing groups to clinical findings, the clusters were different only for liver abnormality. Cluster 3 had the lower median of reticulocytes, LDH, leukocytes, lymphocytes and monocytes and a higher percentage of patients under treatment. Clusters 4 and 5 had higher frequencies of liver impairment and higher medians of reticulocytes, LDH, leukocytes, lymphocytes and monocytes. Hemolysis and inflammation seemed to influence the grouping.
ConclusionIn our study, cluster analysis showed five groups that exhibited different degrees of inflammation and hemolysis. When comparing clinical data, the result was different only for the criteria of liver abnormality.
Sickle cell anemia (SCA) is a monogenic disorder caused by a mutation in the β-hemoglobin gene (HBB), glu6val, resulting in abnormal hemoglobin (HbS) that can polymerize.1 The most common genotype is the homozygous HbS. Despite an identical HbS genotype, the clinical presentation is heterogeneous and classifying these patients is difficult, especially because the disease does not have a specific severity marker. Predicting the clinical phenotype could offer better treatment and prognosis.2
The SCA is a public health problem due to the high costs of hospitalization and comorbidities.3 It is particularly true in Brazil, where a Unified Health System finances the costs and where preventive measures could significantly reduce the disease's economic burden. Data from the World Health Organization estimates that 275,000 newborns around the world are diagnosed with sickle cell disease each year,4 being around 1000 newborns/year in Brazil,5 where neonatal screening has been obligatory since 2001.6
This is a systemic disorder, associated with acute episodes and chronic conditions, with progressive organ damage7 and with only one drug, hydroxyurea, approved for use in Brazil. Low-cost biomarkers could help developing countries with patient risk stratification and follow-up.
Hierarchical clustering is a multivariate statistical technique that could be helpful in grouping SCA patients. This is an algorithm to group similar characteristics, revealing subgroups with heterogeneous data. It is one of the most used clustering techniques in bioinformatics and it has been already used for many clinical purposes,8–10 including diagnosis and artificial intelligence development.11 The result or the classifications can be pictured as hierarchical trees, the dendrograms. To form the clusters, this method uses the similarities or dissimilarities, also called distance (Euclidean distance, squared Euclidean distance, city-block distance, power distance, etc.). There are different techniques used, for example, single linkage, complete linkage, average, centroid, and Ward´s method; however, comparative studies showed that Ward´s seems to be better than the others.12
Du et al., 201813 proposed a system-type approach to discover profiles of multiple, common biomarkers that correlate with morbidity and mortality for sickle cell disease. Based on this, we designed a study with cluster analysis in a sample of 145 HbSS patients using 10 routine, low-cost laboratory tests.
Materials and methodsBiomarker inclusion and dataClinical data and laboratory tests were collected in steady-state (at least 3 months without crisis) and at an outpatient clinic, retrospectively, from 2008 to 2018. To eliminate the bias of different genotypes, we only included the homozygous SS, totalizing 145 adults. Since cluster analysis requires complete data on all patients, we excluded 13 patients. Laboratory tests were included based on availability, cost and routine use. All of the tests were quantitative variables: counting hemoglobin, leukocytes, lymphocytes and monocytes and unconjugated bilirubin, creatinine, ferritin, lactate dehydrogenase (LDH), uric acid and reticulocytes.
Hierarchical clustering and statisticsWe applied hierarchical clustering with the squared Euclidean distance and Ward´s method (SPSS 22.0). As a result, we found five final clusters, represented in the dendrogram (Figure 1). Age and biomarkers' median values were compared by performing a non-parametric test, the Kruskal-Wallis, followed by the post hoc Dunn multiple comparisons test. The Chi-Square test was performed for clinical data association. A p-value less than 0.05 was statistically significant.
Dendrogram of homozygous SS patients. Ward´s Method.
The figure shows the five final clusters, represented by numbers 1 to 5. Clusters in the same branch are more similar and the shorter the branch, the greater the similarity. The dendrogram shows two major branches: A, with clusters 1, 2 and 3 and B, with 4 and 5.
To define clinical data, we used:
- 1.
Liver abnormality: conjugated bilirubin greater than 0.6 (median obtained in a previous analysis, [14, based on15]) or palpable liver on physical examination or liver abnormality in ultrasound or tomography;
- 2.
Nephropathy: albuminuria (higher than 30 mg in an isolated sample or a 24h proteinuria higher than 150mg) or an elevated creatinine level (higher than the reference value- Table 1);
Table 1.Biomarker median values in our total sample (n = 145).
LDH, Lactate dehydrogenase; M, male; F, female.
- 3.
Osteonecrosis at any site, confirmed by a radiological examination (radiography or nuclear magnetic resonance);
- 4.
Sickle cell acute pain: at least one episode of acute pain crisis in life, refractory to the use of simple analgesics, such as acetaminophen or dipyrone, with medical care assistance;
- 5.
Acute chest syndrome (ACS) characterized in medical records as pain, fever, desaturation and change in the radiological exam, at least one episode throughout life;
- 6.
Thrombotic manifestations: included peripheral venous thrombosis (PVT), pulmonary thromboembolism (PE) or cerebral venous thrombosis (CVT), at least one episode in life;
- 7.
Leg ulcer: previous or active, with or without hydroxyurea use;
- 8.
Stroke: ischemic or hemorrhagic, confirmed by computed tomography or magnetic resonance.
We included patients with absent treatment, under hydroxyurea use (according to a Brazilian protocol: a minimal dose of 15 mg/kg up to the maximum tolerated dose) and receiving chronic manual blood transfusion.16
Ethical statementThe Ethics Committee (CAAE 70891517.9.0000.5505) approved this study and all participants provided written informed consent.
ResultsThe median age of participants was 33 years and subjects ranged in age from 19 to 76 years. Only 3.8% (5) were over 60 years. Women represented most (57.9%) of the patients. The majority (57.2%) were in treatment with hydroxyurea (HU) and 17.2% were in chronic transfusion. Of the 25.6% (37) without treatment, 21.6% (8) have had a treatment prescription (blood transfusion or hydroxyurea), but there was no therapeutic adherence.
The occurrence of clinical manifestations was 78.6% for painful episode, 53.8% for ACS, 40.7% for nephropathy, 27.6% for osteonecrosis, 22.8% for chronic hepatic disease, 20.0% for leg ulcers, 19.3 % for stroke and 9.0% for embolic manifestations. Despite not having included this data, at least one episode of priapism occurred in 44.3% of the men. Table 1 shows the biomarker median values in our sample.
As mentioned, cluster analysis included 132 patients. This tool determined five clusters based on ten circulating biomarkers (Figure 1). Table 2 shows this distribution and biomarker medians in each one.
Age and biomarkers medians in each cluster (n=132).
LDH – lactate dehydrogenase. Kruskal-Wallis test. Data are presented as the median (interquartile range, P25 - P75 percentile). Each letter represents a specific cluster, where: a = cluster 1, b = cluster 2, c = cluster 3, d = cluster 4 and e = cluster 5. (Dunn's test; differences with p < 0.05).
Age, hemoglobin, ferritin, creatinine and uric acid showed no difference among the groups. There was a statistical difference for the following variables: leukocytes, lymphocytes and monocytes counts, reticulocytes, LDH and unconjugated bilirubin. Cluster 3 presented the lowest medians, when considering all these variables. When considering only reticulocytes, cluster 3 (median = 123,0) was different from clusters 1, 2, 4 and 5. Cluster 1 (median = 180,0) was also different from the others. Cluster 2 (median = 237,0) was different from 1, 3 and 5. Cluster 4 (median= 327,0) was different from 1 and 3 and cluster 5 was different from 1, 2 and 3. When taking into account the LDH, cluster 3 differed from clusters 4 and 5. Unconjugated bilirubin showed differences from cluster 3 to clusters 1, 2 and 4. Leukocyte analyses showed that cluster 1 was different from clusters 4 and 5, while cluster 3 differed from clusters 2, 4 and 5. For the lymphocyte count, cluster 3 was different from clusters 2, 4 and 5. Monocyte count analyses showed that cluster 1 differed from cluster 5 and cluster 3 differed from clusters 4 and 5.
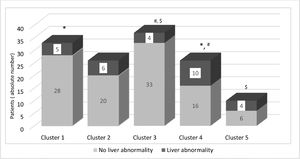
To evaluate if the groups were different for clinical manifestations, we performed a Chi-Square test, as shown in Table 3. As a result, the only statistical significance was found in liver abnormality. To show these differences, Figure 2 presents the distribution of liver impairment among the five groups. Curiously, clusters 4 and 5, which presented the highest frequencies of liver abnormality (38.5% and 40%, respectively), are also the groups with the highest counts of reticulocytes, LDH, leukocytes, lymphocytes and monocytes. Moreover, as shown in Figure 1, they are in the same major branch in the hierarchical cluster (represented as B). A point to be highlighted is that these two clusters also have a lower frequency of patients in treatment.
Distribution of gender, treatment and clinical manifestations by clusters (n = 132).
Values in a row with the same superscript letters are significantly different, p < 0.05 (Chi-Square test).
HU, Hydroxyurea; ACS, Acute Chest Syndrome.
The SCA is responsible for severe comorbidities1 and premature deaths.17 Despite having a known molecular basis, it possibly involves other pathophysiologic mechanisms, such as inflammation18 and thrombosis.19 Phenotypic variability is common and the current literature lacks clinical stratification data, impairing the reproducibility of basic studies or even equivalence in clinical trials.20 Thus, the development of tools, as grouping with hierarchical clusters, can contribute to a better knowledge of the disease.
As the quality of assistance has improved, patients are living longer, with an enhanced life expectancy. In the sixties, the disease was a childhood problem. In the following decade, life expectancy was 14 years with few patients living up to 30 years.21 In the eighties, prophylactic therapy with oral penicillin decreased the morbidity and mortality associated with pneumococcal septicemia.22 In 1994, a prospective study from 1978 to 1988 reported a life expectancy of 42 years for males and 48 years for females, a decrease of about 25 to 30 years, when compared to the control consisting of African Americans.17 Two decades later, another study (1999 - 2009) reproduced similar results.23
Our cohort consisted of patients with a median age of 33 years, with only three patients over 60, considered elderly in developing countries, suggesting a lower life expectancy. Moreover, most patients were receiving treatment (HU or chronic transfusion), reflecting more severe patients in our sample.
As expected, the clinical presentation was variable. The most frequent manifestation was pain, at least one episode of which occurred, with medical assistance, in 78.6% of the cases. According to the literature, pain is the main cause of emergency care and hospitalization24 and could occur in 60% of patients.25 In our cohort, 53.8% of patients had at least one acute chest syndrome, which corroborates the literature.26,27 Renal involvement was present in 40.7% of patients. Nephropathy is one of the most common chronic comorbidities and causes of death in sickle cell disease (SCD),28 albuminuria can be present in up to 68% of SCD adults29and renal manifestations are frequent even in children with SCD (17-27%).30 Osteonecrosis was present in 27.6% of patients, data similar to other studies.31
Liver disease is the result of multiple insults and pathophysiological mechanisms, such as virus infection, sickling and iron overload.32 The hepatobiliary system can be involved in 10 - 40% of SCD patients, although the concept of chronic liver disease is not clearly defined and can include iron overload, viral hepatitis, cholelithiasis and cholangiopathy.33 Direct bilirubin ≥ 0.4 mg/dL was independently associated with mortality in an SCD cohort.15 In a previous analysis, our group obtained a conjugated bilirubin median of 0.6 mg/dL, which was higher than that found in Feld et al.14,15 Applying the criteria of conjugated bilirubin higher than 0.6, palpable liver on physical examination or liver abnormality in ultrasound or tomography, the liver abnormality was present in 22.8% of patients.
The leg ulcer is associated with hemolysis and can be present in thalassemia34 or spherocytosis.35 In our cohort, 20% of patients presented a leg ulcer (active or previous history). The frequency of leg ulcers varies in the literature and is affected by geographic distribution, occurring in 75% of SCA patients in Jamaica, but only in 8 - 10% in North America.36 We found a higher number of strokes, when compared to a prevalence of 7.8% in a pediatric Jamaican study,37 8.4% in children in Nigeria38 and 4% in the Cooperative Study of Sickle Cell Disease.39
Finally, at least one thrombotic event occurred in 9% of the cases in our sample. There are few studies in this area and the risk of thrombotic events in sickle cell patients appears greater than in the general population. Thrombotic manifestations are probably somewhat neglected, with inadequate prophylaxis.40 One clinical finding that was not included in the cluster analysis was priapism, occurring in at least one episode lifelong, present in 44.3% of men. This is in agreement with a previous study,41 which found a prevalence of 42%.
Considering the difficulty in classifying these patients clinically and the hypothesis that the analysis of multiple biomarkers could simultaneously offer better signatures than individual levels,42 we included 132 SCA patients in the hierarchical cluster analysis. Age was similar in all clusters. Variables (leukocytes count, lymphocytes, monocytes, reticulocytes, LDH and unconjugated bilirubin) were statistically different, confirming that the distribution was not by chance. Clearly, inflammation and hemolysis markers were important for the hierarchical cluster construction. The hierarchical analysis presented different hemolysis degrees, as found by Du et al.13 Leukocyte counts were also different among the groups. In a cohort in the Congo, an elevated baseline leukocyte count was associated with the SCA severity, suggesting that leukocytes could play a major role in the phenotypic severity of the disease, as these cells are involved in cytokine release, chronic inflammation and infection.43
Finally, to understand whether the clinical findings were associated with these clusters, they were also compared to clinical manifestations. Hepatic laboratory tests were not used in our cluster differentiation, even though the groups were different only in this clinical aspect (cluster 3 from 4 and 5 and 1 from 4). Cluster 3 (91.9%) was also different from 4 (61.5%) and 5 (60%), when comparing the percentage of patients with and without treatment, despite not being influenced by the type of treatment. The absence of treatment, high levels of inflammation and hemolysis seemed to predispose the patient to liver impairment.
The literature is not clear regarding the classification of sickle cell liver disease and this may be a bias in our study, since patients were not submitted to biopsy to demonstrate liver impairment and we do not use albumin or the prothrombin time as a routine test. Another limitation is that we could not include classical modulators of the disease in the clusters, such as fetal hemoglobin or alfa-thalassemia, because they are not routine tests. Furthermore, the small sample size (132 SS patients) may decrease the power of the statistical tests in showing important biological differences. Treatment was less frequent in clusters 4 and 5; however, we did not include the duration of treatment, which could influence the clinical presentation. Moreover, this is not a prospective study and a follow-up could be an opportunity to verify the development of comorbidities and mortality risk within the clusters. Nevertheless, we are the first study to test cluster analysis in an adult HbSS cohort, as the previous ones13 included only children (mean age of 15.3 years).
A widely, accessible and validated method to measure disease severity does not currently exist. It is important to detect outpatients with a worse prognosis to prevent complications and increase life expectancy. Unfortunately, SCA is still a neglected disease and affordable treatment and morbidity prevention have progressed slowly during the past years. New tools can contribute to a better understanding of this disease and its complications. Hierarchical clusters can be a tool for classifying SCA patients in an easy, accessible and important manner. It is reproducible, useful to outpatients and inexpensive.
ConclusionCluster analysis using 10 common routine laboratory tests detected five different subgroups. Biomarkers of hemolysis and inflammation appeared to be the factors that most influenced this grouping. When comparing the groups with clinical manifestations, only the criteria of liver abnormality showed a statistical difference.
FundingThis work was supported by the CAPES -Finance Code 001 and CNPq 162577/2015-0 and 166526/2013-4 (Authors’ Fellowship) processes.
The authors acknowledge Prof. Gianni Mara Silva dos Santos for the cluster analysis support.


