


Secondary myeloid neoplasms comprise a group of diseases arising after chemotherapy, radiation, immunosuppressive therapy or from aplastic anemia. Few studies have addressed prognostic factors in these neoplasms.
MethodForty-two patients diagnosed from 1987 to 2008 with secondary myeloid neoplasms were retrospectively evaluated concerning clinical, biochemical, peripheral blood, bone marrow aspirate, biopsy, and immunohistochemistry and cytogenetic features at diagnosis as prognostic factors. The International Prognostic Scoring System was applied. Statistical analysis employed the Kaplan–Meier method, log-rank and Fisher's exact test.
ResultsTwenty-three patients (54.8%) were male and the median age was 53.5 years (range: 4–88 years) at diagnosis of secondary myeloid neoplasms. Previous diseases included hematologic malignancies, solid tumors, aplastic anemia, autoimmune diseases and conditions requiring solid organ transplantations. One third of patients (33%) were submitted to chemotherapy alone, 2% to radiotherapy, 26% to both modalities and 28% to immunosuppressive agents. Five patients (11.9%) had undergone autologous hematopoietic stem cell transplantation. The median latency between the primary disease and secondary myeloid neoplasms was 85 months (range: 23–221 months). Eight patients were submitted to allogeneic hematopoietic stem cell transplantation to treat secondary myeloid neoplasms. Important changes in bone marrow were detected mainly by biopsy, immunohistochemistry and cytogenetics. The presence of clusters of CD117+ cells and p53+ cells were associated with low survival. p53 was associated to a higher risk according to the International Prognostic Scoring System. High prevalence of clonal abnormalities (84.3%) and thrombocytopenia (78.6%) were independent factors for poor survival.
ConclusionThis study demonstrated that cytogenetics, bone marrow biopsy and immunohistochemistry are very important prognostic tools in secondary myeloid neoplasms.
Secondary myeloid neoplasms (s-MN) comprise a group of diseases arising as late complications after chemotherapy and radiation and are associated with risk factors such as congenital disorders and acquired bone marrow (BM) failure.1–4
The most studied of these s-MN are related to chemotherapy and radiotherapy. The rate of these diseases is increasing as the survival of patients with cancer improves. Patients submitted to autologous hematopoietic stem cell transplantation (HSCT) with intensive chemotherapy and total body irradiation (TBI), a type of complimentary therapy, have demonstrated a potential of developing secondary myeloid disorders.5 The 2008 World Health Organization (WHO) classification adopted the term therapy-related myeloid neoplasms (t-MN) for cases of myeloid malignancies after chemotherapy/radiotherapy (CH/RT) that fulfill morphological criteria including myelodysplastic syndromes (MDS), acute myeloid leukemia (AML) and myeloproliferative neoplasms (MPN). Alkylating drugs/radiation and topoisomerase II inhibitor agents are implicated in these disorders. The characteristics of t-MN in the majority of cases include anemia with macrocytosis, dysplastic changes in neutrophils and basophilia. BM fibrosis, three lineage dysplasia, ring sideroblasts and abnormal karyotypes are seen in the majority of cases, with almost 50% of cases having less than 5% of BM blasts. The clinical course is typically progressive and resistant to conventional therapies.6
Long-surviving patients treated with immunosuppressive therapy, such as aplastic anemia (AA), autoimmune disease and recipients of solid organ grafts have an increased risk of developing s-MN.7–9 Furthermore, the concomitant use of immunosuppressive agents with hematopoietic growth factors has been associated with s-MDS.10 To date, little is known about s-MN after using immunosuppressive therapy. There are few data in the literature concerning morphologic and outcome studies. However, cytogenetic abnormalities are an important marker in this subgroup with anomalies usually involving chromosomes 6 and 8 and in particular monosomy 7.11
Genetic diseases such as Fanconi anemia, dyskeratosis congenita, Diamond-Blackfan anemia, Shwachman-Diamond syndrome and some forms of severe congenital neutropenia have an increased propensity for myeloid neoplasms.12 Furthermore, studies about host factors such as common polymorphisms in drug metabolizing enzymes and biological markers of drug- and radiation-induced genetic damage may be useful in identifying patients at risk of therapy-related complications and secondary malignancies.13,14
Data concerning overall survival (OS) and prognosis of patients with s-MN remain poor. Allogeneic HSCT seems to be the only curative therapy for all subgroups included in s-MN.15
Cytogenetic status plays an important role in determining the outcome of these patients. Outcome for primary disease, platelet count, hemoglobin level, age, total protein level, C-reactive protein level and unfavorable karyotype have been described as prognostic factors in some studies.16–18 Despite the importance of BM studies in pathological processes of secondary disease, few investigations have been conducted concerning BM biopsies and immunohistochemistry. Orazi et al.19 analyzed 14 patients with previous diseases including Hodgkin's lymphoma, Non-Hodgkin lymphoma, breast cancer, plasma cell myeloma and skin carcinoma that evolved to therapy-related MDS. Data from BM biopsies, such as abnormal localization of immature precursors, marrow fibrosis, and overexpression of CD34+ cells have been associated with poor prognosis. In addition, p53 protein overexpression can be frequently observed, particularly in cases associated with severe ineffective hematopoiesis.20
ObjectiveThe aim of this study was to analyze clinical, biochemical, morphological (peripheral blood, BM aspirate and biopsy) and cytogenetic characteristics as prognostic factors in patients with s-MN diagnosed and treated at a single center.
MethodsOf 428 patients with MDS in the database of HC-FMUSP, a public hospital in São Paulo, Brazil, 42 patients (10%) with s-MN after the use of chemotherapy, radiotherapy (for hematological or solid tumors) or immunosuppressive therapy (for AA, solid transplantation and autoimmune diseases) from 1987 to 2008 were retrospectively studied. This study was conducted in accordance with the Declaration of Helsinki and approved by the Ethics Committee of the institution. Medical charts were evaluated for clinical characteristics and laboratory data at diagnosis (Tables 1 and 2). BM aspirates were reviewed according to morphological criteria of the WHO 2008 criteria. BM biopsies were reviewed for cellularity, an estimated blast percentage, fibrosis and dyspoiesis. Immunohistochemistry was carried out for myeloperoxidase, Glycophorin A, CD61, FVIII, CD20, CD3, CD138, CD34, CD117 and p53 protein expressions. The latter was defined as 0 to 3+ and considered positive if any expression was detected (Table 2). Cytogenetics was performed at diagnosis using standard G-banding21 and karyotypes were classified as normal, abnormal, complex (≥ 3 abnormalities) or monosomy 7.22 The International Prognostic Scoring System (IPSS) for primary MDS23 was calculated. The IPSS has already been validated for therapy-induced MDS.24
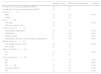
Univariate analysis for prognostic factors on overall survival of patients with secondary myeloid neoplasms – clinical data.
| Number of cases | Median survival (months) | p-Value | |
|---|---|---|---|
| Overall survival censoring allogeneic HSCT | 42 | 5.7 | |
| Overall survival not censoring allogeneic HSCT | 42 | 6 | |
| Gender (n=42) | |||
| Male | 23 | 5.9 | 0.974 |
| Female | 19 | 5.1 | |
| Age (n=42) | |||
| <50 years | 18 | 8.7 | 0.135 |
| ≥50 years (range 4–88) | 24 | 3.6 | |
| Primary disease (n=42) | |||
| Hematologic malignancies | 19 | 3.5 | 0.018 |
| Solid tumors | 6 | 3.6 | 0.833 |
| Aplastic anemia | 11 | 20.7 | 0.041 |
| Autoimmune disorders and solid organ transplantations | 6 | 12.2 | 0.651 |
| Median latency (n=41) | |||
| <85 months (range 23–221) | 20 | 3.6 | 0.264 |
| ≥85 months | 21 | 9.2 | |
| Allogeneic HSCT (n=42) | |||
| No | 34 | 5.7 | 0.007 |
| Yes | 8 | 40 | |
| Previous therapy (n=39) | |||
| CH | 14 | 5.9 | 0.879 |
| RT | 1 | 3.6 | 0.599 |
| CH+RT | 11 | 2.5 | 0.749 |
| Autologous HSCT | 5 | 5.9 | 0.309 |
| IST | 12 | 7.1 | 0.764 |
CH: chemotherapy; HSCT: hematopoietic stem-cell transplantation; IST: immunosuppressive therapy; RT: radiotherapy.
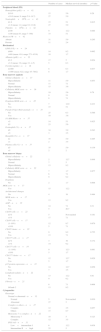
Univariate analysis for prognostic factors on overall survival of patients with secondary myeloid neoplasms – laboratory data.
| Number of cases | Median survival (months) | p-Value | |
|---|---|---|---|
| Peripheral blood (PB) | |||
| Hemoglobin (g/dL) – n=42 | |||
| ≥10.0 | 15 | 5.6 | 0.29 |
| <10.0 (mean: 9, range 5.8–14.7) | 27 | 5.9 | |
| Neutrophils×109/L – n=42 | |||
| ≥1.8 | 15 | 5.1 | 0.615 |
| <1.8 (mean: 1.2, range 0.2–10.8) | 27 | 5.9 | |
| Platelets×109/L – n=42 | |||
| ≥100 | 9 | 12.2 | 0.084 |
| <100 (mean:43, range 7–368) | 33 | 5.1 | |
| Blasts in PB – n=42 | |||
| Absent | 31 | 5.9 | 0.295 |
| Present | 11 | 2.4 | |
| Biochemical | |||
| LDH (U/L) – n=24 | |||
| ≤480 | 14 | 9.2 | 0.002 |
| >480 (mean: 414, range 271–4310) | 10 | 1.7 | |
| Albumin (g/dL) – n=22 | |||
| ≥3.2 | 17 | 5 | 0.624 |
| <3.2 (mean: 3.6, range 2.1–4.5) | 5 | 6.3 | |
| Ferritin (ng/mL) – n=16 | |||
| ≤1000 | 8 | 6.3 | 0.037 |
| >1000 (mean: 822, range 45–7842) | 8 | 1.7 | |
| Bone marrow aspirate | |||
| Global cellularity – n=37 | |||
| Hipocellularity | 11 | 5.9 | 0.853 |
| Normal | 11 | 7.1 | |
| Hipercellularity | 15 | 3.6 | |
| Cellularity MGK serie – n=36 | |||
| Hipocellularity | 19 | 5.6 | 0.79 |
| Normal | 9 | 5.1 | |
| Hipercellularity | 8 | 7.1 | |
| Dysplasia MGK serie – n=22 | |||
| No | 7 | 12.9 | 0.233 |
| Yes | 15 | 5.1 | |
| Pseudo-Pelger-Huët anomaly – n=35 | |||
| No | 25 | 6.3 | 0.586 |
| Yes | 10 | 3.6 | |
| (%) BM Blasts – n=37 | |||
| <5 | 14 | 5.1 | 0.825 |
| ≥5 | 23 | 5.6 | |
| Eosinophils (%) – n=37 | |||
| ≤5 | 34 | 5.9 | 0.243 |
| >5 | 3 | 3.5 | |
| Basophils (%) – n=37 | |||
| ≤1 | 35 | 5.9 | 0.495 |
| >1 | 2 | 3.5 | |
| Plasma cells (%) – n=37 | |||
| ≤5 | 35 | 5.9 | 0.139 |
| >5 | 2 | 2 | |
| Bone marrow biopsy | |||
| Global cellularity – n=22 | |||
| Hipocellularity | 2 | 12.7 | 0.948 |
| Normal | 7 | 5 | |
| Hipercellularity | 13 | 9.2 | |
| Cellularity MGK serie – n=22 | |||
| Hipocellularity | 7 | 1.7 | 0.977 |
| Normal | 6 | 7.1 | |
| Hipercellularity | 9 | 9.2 | |
| Dysplasia | |||
| No | 2 | 1.7 | 0.608 |
| MGK serie – n=17 | |||
| Yes | 15 | 12.2 | |
| Architectural changes | |||
| No | 4 | 19 | 0.464 |
| MGK serie – n=17 | |||
| Yes | 13 | 9.2 | |
| ALIP – n=19 | |||
| No | 14 | 7.1 | 0.31 |
| Yes | 5 | 20.7 | |
| CD34+cells – n=22 | |||
| ≤1% | 5 | Not reached | 0.181 |
| >1% | 17 | 7.1 | |
| CD34+cells – n=17 | |||
| (1–10%) | 12 | 8.7 | 0.676 |
| >10% | 5 | 7.1 | |
| CD34+cluster – n=22 | |||
| No | 9 | 9.2 | 0.755 |
| Yes | 13 | 7.1 | |
| CD117+cells – n=17 | |||
| ≤1% | 3 | 19 | 0.172 |
| >1% | 14 | 9.2 | |
| CD117+cells – n=14 | |||
| (1–10%) | 9 | 12.3 | 0.081 |
| >10% | 5 | 1.7 | |
| CD117+cluster – n=17 | |||
| No | 12 | 12.7 | 0.029 |
| Yes | 5 | 1.7 | |
| p53 protein expression – n=21 | |||
| No | 14 | 12.7 | 0.056 |
| Yes | 7 | 3.5 | |
| Lymphoid nodules – n=22 | |||
| No | 13 | 12.2 | 0.81 |
| Yes | 9 | 9.2 | |
| Fibrosis – n=21 | |||
| 8 | 7.1 | 0.608 | |
| ≥Grade 2 | 13 | 9.2 | |
| Cytogenetics | |||
| Karyotype | |||
| Normal vs abnormal – n=32 | |||
| Normal | 5 | Not reached | 0.030 |
| Abnormal | 27 | 5 | |
| Complex vs others – n=27 | |||
| Complex | 12 | 3.5 | 0.057 |
| Others | 15 | 8.7 | |
| Monosomy 7 vs complex – n=22 | |||
| Monosomy 7 | 10 | 5 | 0.123 |
| Complex | 12 | 3.5 | |
| IPSS risk – n=31 | |||
| Low+intermediate I | 6 | 12.2 | 0.038 |
| Intermediate II+high | 25 | 5 | |
ALIP: abnormal localization immature precursor; LDH: lactate-dehydrogenase; MGK: megakaryocytic.
The data were analyzed using version 16.0 of the Statistical Package for the Social Sciences (SPSS) computer program. Statistical analysis for OS used the Kaplan–Meier product limit method, censoring the time of allogeneic HSCT, and log-rank test for comparing the OS between subgroups. The significant variables in univariate analysis (except for histological factors and biochemistry data because of the small number of samples) were submitted to the binary logistic regression test. Fisher's exact test was used for associations between categorical variables such as p53 and abnormal cytogenetics, blast cells and CD34+ and CD117+ cells.
ResultsTwenty-three patients (54.8%) were male, with a median age of 53.5 years (range: 4–88 years) at the diagnosis of s-MN. Hematologic malignancies, solid tumors, AA, autoimmune diseases and recipients of solid organ transplantations were identified as previous conditions related to the disease. For previous therapy, 33% of patients had been submitted to chemotherapy alone, 2% to radiotherapy, 26% to both modalities and 28% to immunosuppressive agents. Five patients (11.9%) had undergone autologous HSCT. The patient characteristics are shown in Table 1 and further information about clinical data are available in a previous publication.22 The median latency between the primary disease and s-MN was 85 months (range: 23–221 months). Eight patients underwent allogeneic HSCT to treat s-MN (Table 1).
Peripheral blood analysis was performed in all cases and showed anemia, neutropenia and thrombocytopenia in more than 60% of the cases; more than 25% presented blast cells. Serum lactate dehydrogenase was increased in 41%, ferritin >1000ng/mL in 50% and albumin <3.2g/dL in 22.7% of the available cases (Table 2).
BM aspirates were available in 37 cases, with 38% of patients presenting blasts under 5%, 43% of patients with blasts between 5–19% and 19% of the cases with 20% of blasts or more. Two patients presented characteristics of MDS/myeloproliferative syndrome, one chronic myelomonocytic leukemia and one with thrombocytosis. Increases in eosinophil, basophil and plasma cell counts were detected in few cases, and >15% of ring sideroblasts in only 14.3% (Table 2).
Twenty-two BM biopsies analyzed with a median length of 1.4cm (range: 0.6–3.7cm) revealed global hypocellularity in 9.1%. Hypobulated megakaryocytic was the most relevant finding concerning dysplasia; increased fibrosis was detected in 62%, abnormal localization of immature precursors in 23.8%, lymphoid nodules in 40.9%, CD34+ and CD117+ cells were detected in more than 75% of the cases and elevated p53 protein expression in 33.3%. CD117, but not CD34, was often positive in the cytoplasm of megakaryocytes (Table 2).
Of 42 patients, 38 samples were available for cytogenetic analysis with six cases having no cell growth. Analysis was conclusive in 32 cases. Clonal abnormalities were observed in 84.4% of cases. A high prevalence of unbalanced abnormalities (96.3%) was observed and only one case presented with t(3;21)(q26;q22) as a single anomaly. The results of karyotype and fluorescence in situ hybridization (FISH) studies have already been published.22
In univariate analysis, hematologic malignancies, low platelet count, high serum lactate dehydrogenase and ferritin levels, detection of CD117 clusters, p53+, abnormal cytogenetics, Intermediate-II and high risk IPSS groups were found to be associated with poor survival. No parameter studied from BM aspirate had impact on survival (Table 2). Hematologic malignancies as a previous disease, low platelet count, abnormal karyotype (Table 2) and patients who had not undergone allogeneic HSCT were independent factors that predicted poorer survival in this sample. Figure 1 shows OS curves according to the most relevant prognostic findings in s-MN.
: Overall survival censoring allogeneic HSCT. (A2): Previous disease. (A3); Previous disease. (A4): Allogeneic HSCT for therapy. (A5): Serum LDH. (A6): Serum Ferritin. (A7): Platelets. (A8): CD34+ cells. (A9): CD117+ cluster. (A10): p53 protein expression. (A11): Karyotype. (A12): IPSS-Risk.")
Kaplan–Meier survival curves for secondary MN patients by significant poor prognostic factors.
(A1): Overall survival censoring allogeneic HSCT. (A2): Previous disease. (A3); Previous disease. (A4): Allogeneic HSCT for therapy. (A5): Serum LDH. (A6): Serum Ferritin. (A7): Platelets. (A8): CD34+ cells. (A9): CD117+ cluster. (A10): p53 protein expression. (A11): Karyotype. (A12): IPSS-Risk.
The binary logistic regression test, applied to 32 patients with complete clinical, peripheral blood, BM aspirate and cytogenetic parameters, showed that clonal abnormalities (p-value=0.012) and platelet counts <100×109/L (p-value=0.028) were independent factors for poor survival. Fisher's exact test showed no correlations between p53 and abnormal cytogenetics (p-value=0.092), p53 and CD34+ cells (p-value=0.554), p53 and CD117+ cells (p-value=0.176); blast cells and CD34+ cells (p-value=0.674), blast cell and CD34+ cell clusters (p-value=0.583), blast cells and CD117+ cells (p-value=0.604), and blast cell and CD117+ cell clusters (p-value=0.126).
DiscussionNowadays the number of s-MN has become increasingly important. This increase is mainly related to an expanded use of high-dose chemotherapy/radiotherapy. The risk of developing s-MN after immunosuppressive therapy seems important as well since several cases have been reported so far in the literature.7–11 This is a retrospective study with a small and heterogeneous sample; it reflects consecutive cases of s-MN over a period of 21 years diagnosed and treated in a single center.
This study included patients submitted to different previous therapies (CH/RT and immunosuppressive therapy); the findings of this study are consistent with the clinical picture seen in patients with t-MN. The frequency of s-MN in this study was 10% of cases in the MDS database, with a median age of 53 years. The most common previous disease was plasma cell myeloma treated with melphalan (21.4%), and there were three patients with follicular lymphoma treated with fludarabine associated with cyclophosphamide, reinforcing the theory that this association increases the risk of developing t-MN as suggested in a previous study.25 Breast cancer was the most frequent solid tumor (50% – 4/8) consistent with published data that has reported an increased rate of s-MN in this group of survivors probably as a consequence of an effective therapy.26,27
The median OS for all patients was six months, basically the same observed in other series of patients with t-MN that reported four and eight months.15,28 There was a significant difference between patients who were submitted to allogeneic HSCT (40 months) and those who were not (5.7 months) (p-value=0.007). This is in agreement with published data and showed the crucial importance of this modality of therapy.
The findings of this study suggest that BM aspirates provide limited results, probably due to aspirate dilution, and did not contribute to the prognosis of these patients. The percentage of blasts in BM aspirate was not significantly associated with survival. This result might be explained by the poor quality of the sample material and the percentage of blasts may be underestimated, since the value was not representative in one third of cases.
Individuals with previous AA seem to be a different subset of patients, showing peculiar characteristics as in this sample a longer median period of latency and higher prevalence of monosomy 7 were seen. An interesting discussion point is whether these patients had this cytogenetic abnormality before treatment or not.
The importance of integrated data analysis was demonstrated in this study with five patients, whose evaluations of BM aspirates were not available. Of these, two had complex karyotypes. The remaining three patients presented remarkable dysplasia in at least granulocyte and megakaryocyte lineages, fibrosis (Grade 2–3) and CD34+ or CD117+ cells (1–10%) revealed in BM biopsies and immunohistochemistry. The importance of BM immunohistochemistry should be stressed in respect to the p53 protein expression (Figure 2) and CD117/CD34 blast evaluations to identify the presence of aggregates of positive cells (Figures 3 and 4).
, previous disease: breast tumor.")
, previous disease: follicular lymphoma.")
, previous disease: severe aplastic anemia.")
BM biopsies showed hypobulated megakaryocytes as the most relevant finding concerning dysplasia (Figure 5). CD117+ clusters and p53 expression had an impact on the survival of patients with median survival of only 1.7 and 3.5 months, respectively. OS curves for patients with CD34+versus CD34− cells, did not reach statistical significance, probably because of the small number of patients. The correlation between p53+ and abnormal cytogenetics did not reach statistical significance probably due to small number of cases. Alterations of p53+ have been found in association with aggressive disease,18 and larger series of cases are necessary to confirm our observation of CD117 clusters as a prognostic marker for this condition.
, previous renal transplant.")
The importance of cytogenetic analysis in diagnosis and prognosis of myeloid neoplasms is well documented. The results of this study are consistent with the literature29,30 and showed that normal cytogenetics was associated to better survival (p-value=0.03) and abnormal karyotype was an independent risk factor for poor survival (p-value=0.012).
In addition, independent factors in multivariate analysis for poor survival included thrombocytopenia, abnormal karyotype and absence of allogeneic HSCT as therapy. Hypoproteinemia was not a poor prognostic factor in this investigation, as shown in a previous Japanese study.18
ConclusionIn summary, factors associated in univariate analysis with poor survival included previous oncohematological diseases, thrombocytopenia, elevated lactate dehydrogenase and ferritin levels, CD117+ clusters, p53+, abnormal karyotype, IPSS risk (intermediate II and high subgroups) and the absence of allogeneic HSCT as therapy. Despite the fact that IPSS was not designed for secondary MDS, it seems to be useful in this situation, mainly in respect to thrombocytopenia and abnormal karyotypes, parameters with high prevalence in MDS (79% and 84% of patients respectively in this study).
Prevention of this late complication of primary treatment programs must be continuously re-evaluated. Further studies with a larger number of cases of s-MN should be conducted to improve the understanding of the pathophysiologic mechanisms of the disease and the determination of biomarkers, in order to diagnose and treat this aggressive disease.
Conflict of interestThe authors declare no conflicts of interest.


