


As coronavirus disease-2019 (COVID-19) spread worldwide and social restrictions were intensified, difficulties in blood supply were expected to result in a shortage of blood donors, logistic issues and a change in blood consumption. Consequences could be detrimental to the meeting of the blood supply demand, especially in a decentralized blood bank in the State of São Paulo responsible for providing blood to more than 100 hospitals, mostly of the public health system. Aiming to minimize negative effects and focusing on maintenance of the blood supply, a different approach was discussed and adopted.
Materials and methodsBriefly, strategies were related to monitoring and promoting measures to achieve a positive RBC unit balance. Thus, the number of donors, transfusions, RBC unit inventory, RBC unit loss and RBC units within up to 5 days from the expiration date were evaluated.
ResultsSeveral strategies were adopted to ensure sufficient availability of RBC units: blood donation was improved with social media and extra blood collections, a restrictive transfusion protocol was implemented, a new logistic process to use RBC units closer to the expiration date was established and non-isogroup transfusions were avoided.
ConclusionAltogether, described strategies were crucial to optimize blood storage during the pandemic. Investing in monitoring and logistics contributed to a positive RBC unit balance and conserving these strategies could be useful.
The coronavirus disease-2019 (COVID-19), caused by the novel coronavirus (nCoV), also known as “SARS-CoV-2”, spread globally over the course of a few months. The first case was officially reported in Brazil on February 26, 2020, in the State of São Paulo. After 4 months, 1,274,974 cases and 55,961 deaths were registered, and Brazil reached the second position in the ranking of all the countries in the world.1 Aiming to fight against the spread of SARS-CoV-2, social restrictions were applied worldwide, directly affecting the blood community.2–5 Thereby, a decrease in blood donations in Brazil was expected and strategies to maintain blood supply started to be immediately discussed. Adoption of a crisis plan to prevent blood shortage and maintenance of sufficient inventories to support transfusion-dependent patients and emergencies was crucial.
According to the latest available data report from the Brazilian Health Surveillance Agency, in 2018, 3,311,220 blood collections were performed in Brazil.6 Colsan (Associação Beneficente de Coleta de Sangue), a nonprofit organization located in São Paulo, contributed with 4.77% (158,044/year, i.e., 13,170/month) of blood collections during 2018. Colsan is an important player in the support for transfusion in the State of São Paulo, providing blood to more than 15 cities and 100 hospitals, most of them being public health system units.
Colsan is comprised of 11 collection sites distributed among 6 cities in the State of São Paulo. As a consequence of the SARS-CoV-2 pandemic, 3 collection sites located inside hospitals, in areas in which donor safety could not be ensured, were closed as soon as the quarantine order was issued on March 23. Blood inventories are strategically located in 4 cities, supporting the local needs, but the main inventory is located in the City of São Paulo, functioning 24h/day and being responsible for emergency support. In addition, Colsan delivers blood and manages 53 transfusion sites inside hospitals throughout the State. The decentralized structure includes distances up to 120 miles from sites where a local supply is required to provide fast support in emergency situations. Thus, the logistics is always a challenge and a sufficient number of blood units is required to securely assist all client hospitals.
The outbreak of SARS-CoV-2 hinders the blood storage management at a complex and decentralized blood bank and possible scenarios were speculated on to ensure a sufficient blood supply to attend to transfusion requests. To share our experience, this report describes strategies adopted to measure the efficiency in maintaining blood supply, including monitoring blood donations/transfusions, and to implement daily analysis of red blood cell units up to 5 days from expiring, being willing to relocate them for immediate use. With these strategies, Colsan is handling the crisis and learning new tools to optimize storage.
MethodologyThis is a retrospective analysis of the red blood cell (RBC) unit balance from a period of almost 3 months during the COVID-19 pandemic. Blood bank parameters, such as blood collection, number of transfusions and RBC units, both those expiring and the inventory, were monitored and plotted to drive measures and their impact, focused on strategies to maintain the blood supply. Analyses were performed of the period between March 23 and June 15. To clarify analyses, blood donation, RBC inventory and RBC transfusion data included information from early 2020.
The number of blood donors is routinely monitored at Colsan. The weekly sum was calculated and compared with the weekly sums from the same period in 2018 and 2019. To compare with the pre-pandemic data, the 2020 weekly sum was calculated from March 1. Strategies to ensure blood donation was implemented throughout the evaluated period.
Since Colsan does not have an integrated informatics solution, each of the 53 transfusion sites under Colsan management started to send a report twice a month containing the number of transfused RBC units. The number of transfused units was monitored during this period and compared with the average of transfused RBC units 6 months before the pandemic.
Additionally, the RBC inventories at 4 main blood distribution sites were monitored daily. The week average was calculated and used to monitor the total availability of RBC units during the pandemic. To compare with the pre-pandemic data, the 2020 weekly sums were calculated from the first week in January.
To evaluate the weekly loss of RBC units, transfusion and blood distribution sites sent the sums of the expired blood units. Furthermore, during the pandemic, we started monitoring the RBC units up to 5 days from the expiration date. To accomplish this, all 53 transfusion sites sent the daily numbers of RBC units within 5, 4, 3, 2 and 1 days from the expiration date. The information was detailed regarding the ABO and Rh of the units, as it was centrally compiled to provide a daily map of the next units due to expire. The weekly average of RBC units within up to 5 days from the expiration date was calculated.
Throughout the analyzed period, several strategies were adopted to avoid blood shortage. As soon as the difficulties were faced and, in light of the pandemic situation, measures were taken to increase blood donation, reduce blood need and improve the use of RBC units close to their expiration date.
ResultsMeasures in blood donationBlood donations during the evaluated period showed a reduction on specific weeks, when compared to 2018 and 2019. During the pandemic period, from a total of 12 weeks analyzed (March 23 – June 15), blood donation was reduced in 2020 compared to 2018 and 2019 during 8 weeks. While 37,064 and 37,619 blood collections were performed in 2018 and 2019, respectively, 30,136 blood units were collected in the same period this year. During this period, Colsan faced a reduction of approximately 7,000 blood collections (approximately 19%). In Figure 1, blood units collected from the same period during 2018, 2019 and 2020 are compared with, and related to, the number of confirmed COVID-19 cases. Compared to the pre-pandemic blood collection data, we observed that the weekly mean of the 3 first weeks in March was 3,219 blood donations and the weekly mean of the 12 weeks analyzed during the pandemic was 2,511. The pre-pandemic 2020 weekly mean (3,219) was similar to the 2018 and 2019 weekly means of the 12 weeks analyzed, being 3,135 and 3,098, respectively.
 Arrows above figure represent weeks with extra collections. Arrows bellow figure represent beginning of social isolation and use of social media.")
2018, 2019 and 2020 blood donation weekly sums. Number of confirmed COVID-19 cases according to official government website. (1) Arrows above figure represent weeks with extra collections. Arrows bellow figure represent beginning of social isolation and use of social media.
Regarding blood collection, several strategies were adopted. The Colsan recruitment team invested in campaigns focusing on specific populations and extra blood collections were performed at sites different from those we had previously established, such as soccer stadiums. Aiming to avoid blood shortage, 9 days with extra blood collections were scheduled during the evaluated period, including 6 days with blood collections in soccer stadiums. In total, these extra blood collections contributed with 828 collected blood units. Additionally, Colsan joined social media (@colsanoficial) on May 5 and started posting information about blood donation and our inventory, increasing advertisement and, consequently, visibility. Despite the increment of COVID-19 cases and social restrictions to raise population isolation, the government anticipated some holidays. Even though this strategy was not uniform among all the cities in the State of São Paulo, Colsan decided to maintain blood collection sites open and invested in campaigns. This decision resulted in one of the greatest weeks in blood collection during the pandemic (3rd week in May).
Monitoring transfusion eventsConsidering the effect of social isolation on blood donations, the RBC transfusion was monitored twice a month to drive our strategies. During the 6 months prior to the pandemic, the daily average of transfused RBC units per site was 5.64, which was similar to the average of the first 15 days in March (5.77). To face the difficulties that would emerge with blood donation reduction, Colsan immediately adopted a restrictive position on blood supply at hospitals where we are located. To achieve this end, we recommended the suspension of elective surgeries and launched a restrictive protocol. Corroborating with this strategy, the government decreed the suspension of elective surgeries, which most certainly contributed to the reduction in the number of transfused units. After June 1, the government resumed elective procedures in the public health system and the increase in blood consumption was consolidated, reaching pre-pandemic levels.
As the number of COVID-19 cases was increasing and governments were adopting health strategies to improve COVID-19 assistance in hospitals, the RBC units transfused started to decrease in the second half of March (4.79 RBC units transfused per day per transfusion site) and reached even smaller means from April 16 to May 15, being 4.61 and 4.65, respectively. The total RBC units transfused are plotted with the dashed line in Figure 2A and it can be observed that from June 1 to June 15, the RBC transfusion (5.36) was similar to that previous to the pandemic, showing that the hospitals had resumed their routines.

RBC balance. 2A. Blood units collected, distribution sites inventory and transfused RBC units. RBC inventory and transfused RBC units are linked to main axis and units collected are linked to secondary axis. The gray box represents the period when elective surgeries were suspended. 2B. RBC loss and weekly average of RBC units within up to 5 days to expiration date. The arrow represents the beginning of relocation of RBC units.
The RBC inventories are monitored daily at 4 blood distribution sites. To follow the consequences of the blood donation and distribution strategies adopted, we plotted the weekly average of RBC storage, regardless of the ABO/Rh typing (continuous line in Figure 2A). We observed that from first week in May, the Colsan inventory started to decrease steadily. Compared to the April average of 5,050 available RBC units in the total inventory of the distribution sites, the decrease in blood donations reflected on the RBC availability, even with the reduction in transfusion, the average in May decreasing to 3,370 and in June, to 2,798. Availability of RBC units at distribution sites was drastically reduced, reaching quantities 40% smaller.
Considering that the discrepancy between RBC inventory and RBC transfusion is mainly attributed to RBC loss, we compiled the weekly sum of RBC loss at 4 distribution and 53 transfusion sites. The continuous line in Figure 2B represents the RBC loss. We observed that from the weeks of March 4 to May 1, RBC loss approached 300 units/week, but with a peak in the week in April 4 (577 RBC units). After the 3rd week in May, the RBC loss drastically decreased, reaching 65 and 52 units in the 1st and 2nd weeks in June, respectively.
Measures to avoid RBC shortagePredicting the RBC supply difficulties, Colsan started to monitor RBC units within up to 5 days from their expiration date at all distribution and transfusion sites as soon as the pandemic had been declared. The weekly average of RBC units within up to 5 days of their expiration date is represented in Figure 2B by a dotted line. When the availability of RBC units was impaired, mainly after the 1st week in May, when we realized that inventories were decreasing and transfusions were increasing, distribution sites intensified a new strategy that we named the relocation of RBC units among the transfusion sites. The transfusion sites were oriented to contact distribution sites upon receiving a transfusion request, specially O Rh positive RBC units and all ABO Rh negative RBC units. The requests were analyzed and, when possible, a close-to-expiring RBC unit was forwarded for immediate use, avoiding the use of a recently collected unit. With this strategy, Colsan invested in logistics and could ensure the use of RBC units from the end of the storage cycle, instead of RBC units in initial or mid-term storage, expanding the RBC unit storage duration. We observed that, while the demand for transfusions was decreasing, the number of RBC units close to their expiration date was increasing from the 4th week in March to the 1st week in May. After the 2nd week in May, the quantity of RBC units close to their expiration date drastically decreased, reaching the weekly average of 109 units in the 2nd week in June, a quantity more than 6 times smaller than the weekly average observed in the peak in the 1st week in May. In Figure 2B, we can observe the effect of RBC units relocation that was systematically performed after May 10. As the relocation was occurring, the weekly average of RBC units within up to 5 days of their expiration date decreased from 674 in the 1st week in May to 109 in the 2nd week in June. Furthermore, since the relocation started, the use of RBC units was optimized and the RBC units loss was also reduced from 334 in the 1st week in May to 52 in the 2nd week in June. As the inventory was also decreasing during this period, we conclude that the balance between blood donation and transfusion was still affected and that blood supply was possible because Colsan invested in logistic to implement the RBC units relocation strategy.
In addition to the relocation, a few days after the implementation, distribution sites had to shrink transfusion sites inventories. Given that distribution sites inventory decreased and assuming that investment in logistics would be necessary, Colsan opted to reduce the RBC units distribution and intensified the relocation to avoid RBC units loss. The reduction in blood supply and relocation were responsible for the decrease in RBC loss that reached a rate 84% smaller in the 2nd week in June.
Analyzing RBC unit loss and dynamic of O Rh positive and all ABO Rh negative RBC relocation, we noticed that the O units supply, as expected, was the main difficulty. Thus, we performed a training program to avoid non-isogroup transfusion of O RBC units and increased distribution of non-O units to the transfusion sites. Consequently, distribution sites inventory changed profiles, as we can observe in Figure 3A and 3B. The difference between O and non-O RBC units changed when this strategy was implemented, either when analyzing Rh positive or Rh negative. During first half of the analyzed period, the difference between non-O and O units was 1,390 and 30, considering Rh positive and Rh negative, respectively. However, the difference changed to 841 and -17 for Rh positive and Rh negative, respectively, during the second half of the analyzed period. Regarding Rh negative, the profile changed until switching the pattern completely, the O units being more abundant.
Discussion
Herein we demonstrated how simple management modifications helped in meeting the transfusion requests. Even with a limited informatics solution, we established uncomplicated processes that resulted in effective strategies to preserve blood supply during a crisis scenario. Challenges were generally transposed with solutions that could be summarized in monitoring and logistics focused on the maintenance of the RBC balance.
During the evaluated period, Colsan's main goal was the maintenance of blood supply and monitoring the abovementioned data was crucial in driving new strategies to ensure a positive RBC balance. To achieve our objective, extra blood collections and campaigns in social media were performed to encourage population to donate blood. On the other hand, to diminish blood demand, the suspension of elective surgeries was recommended and a restrictive protocol with partner hospitals was launched. Additionally, Colsan implemented the relocation of RBC units close to expiring among transfusion sites. In other words, when an RBC type O+/- or any blood group Rh- transfusion event was required, distribution sites searched for an older RBC (close to expiring) and relocated this unit to immediately attend to the transfusion request.
As RBC inventory is orchestrated by the balance between availability and consumption and both blood donation and transfusion were reduced, we evaluated whether the inventory had been affected. Throughout the pandemic period, even with the reduction in transfusion, the RBC inventory could not be sustained. The number of available RBC units decreased by almost 40%. Difficulties in the RBC supply increased when the transfusion needs started being restored to the regular levels in the 3rd week in May, the inventory still being impaired.
To understand the whole blood cycle and monitor the adopted strategies, the total RBC expiration loss was monitored. We observed a regular loss during the first half of the period analyzed. However, blood donation was not enough to sustain the RBC unit inventories and, as transfusions started to increase, new strategies to maintain the supply were crucial. The effect of this new scenario was possible to demonstrate when we analyzed the RBC unit loss, as it was regularly around 300 units and started to decrease after the 2nd week in May. As Colsan is a decentralized blood bank, it is important to highlight that this complexity resulted in an unacceptable RBC unit loss, which needed to be managed. All 53 transfusion sites are required to manage a planned inventory to attend to the hospitals in which they are sheltered. This planned local inventory must be continuously updated as the hospital profile changes. As blood input decreased due to impaired blood donation and blood output increased when transfusion procedures were resumed, the RBC unit inventories were systematically reduced and, consequently, the RBC units loss diminished drastically after the 3rd week in May. The RBC units loss reached 16% of the regular RBC loss in the 2nd week in June.
In the week of April 4, the RBC units loss achieved a peak (weekly loss of 577 RBC units). Probably, this peak occurred due to a good blood collection during the period between early March and the 3 first weeks of April, associated with the reduction in RBC unit transfusion that started in March and became more intense in April.
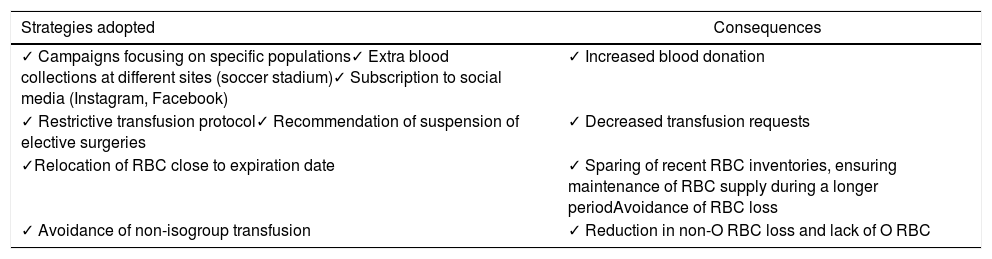
Altogether, monitoring blood collection, transfusion, inventories and loss control allowed Colsan to follow the RBC units balance during the pandemic and strategies adopted were crucial to maintain blood supply, even facing difficulties in RBC availability, the main strategies adopted being described in Table 1. When analyzing a blood bank with the complexity of Colsan, we observe the impact of decentralization on the blood supply. Even when reduced, the centralization of inventories is an option, but the availability of RBC units at transfusion sites needs to be considered and the risks and benefits have to be measured to avoid detriment to the fulfillment of transfusion requests. Permanent implementation of strategies learnt from the pandemic should be considered, as they significantly contributed to optimize RBC units storage. Although it is not the aim of this report, it is important to highlight that committed human resources were fundamental in the adoption of the strategies proposed herein.
Sum of strategies adopted during the pandemic and their consequences in RBC balance.
Costa CB performed the research; Cortez AJP designed the research study; Adão DD and Almeida CM provided and compiled the data; Taguchi EM, Oliveira I, Santos JFO, Rosa APR and Tokunaga JTS provided the data; Arnoni CP and Latini FRL analyzed the data and Latini FRL wrote the paper. The authors thank all the professionals that directly or indirectly contributed to the maintenance of the blood supply.


