


Umbilical cord blood (UCB) is an alternative source of hematopoietic stem cells for allogeneic hematopoietic stem cell transplantation in the absence of a compatible donor. The UCB transplantation has a lower incidence of chronic graft versus host disease (GvHD), but is associated with slower engraftment and slower immune reconstitution, compared to other sources. Dendritic cells (DCs) and Natural Killer cells (NKs) play a central role in the development of GvHD and the graft versus leukemia (GvL) effect, as well as in the control of infectious complications.
MethodWe quantified by multiparametric flow cytometry monocytes, lymphocytes, NK cells, and DCs, including their subsets, in UCB samples from 54 healthy newborns and peripheral blood (PB) from 25 healthy adult volunteers.
ResultsIn the UCB samples, there were higher counts of NK cells 56bright16− (median 0.024 × 10⁹/L), compared to the PB samples (0.012 × 10⁹/L, p < 0.0001), NK 56dim16bright (median 0.446 × 10⁹/L vs. 0.259 × 10⁹/L for PB samples, p = 0.001) and plasmacytoid dendritic cells (pDCs, median 0.008 × 10⁹/L for UCB samples vs. 0.006 × 10⁹/L for PB samples, p = 0.03). Moreover, non-classic monocyte counts were lower in UCB than in PB (median 0.024 × 10⁹/L vs. 0.051 × 10⁹/L, respectively, p < 0.0001).
ConclusionIn conclusion, there were higher counts of NK cells and pDCs and lower counts of non-classic monocytes in UCB than in PB from healthy individuals. These findings might explain the lower incidence and severity of chronic GvHD, although maintaining the GvL effect, in UCB transplant recipients, compared to other stem cell sources.
In the last few years, allogeneic hematopoietic stem cell transplantation (HSCT) has improved clinical outcomes, with less transplant-related mortality (TRM) and better overall survival (OS).1 Despite the advance in the knowledge of immune reconstitution in HSCT, there are still gaps in this field, such as the mechanisms of immunotolerance, graft-versus-host-disease (GvHD) or graft-versus-leukemia (GvL) effect.2
The umbilical cord blood (UCB) transplant was performed for the first time in 1988.3 The UCB transplant is associated with delayed engraftment, increased risk of infections, greater engraftment failure and worse TRM, compared to bone marrow (BM) and peripheral blood (PB) sources.4 However, the UCB transplant usually causes less acute GvHD (aGvHD) and chronic GvHD (cGvHD) with similar rates of leukemia-free survival.5 This could be explained by distinctive patterns of immune reconstitution according to the graft source,6 regardless of the conditioning regimen.7
Dendritic cells (DCs) are antigen-presenting cells, making the connection between innate and adaptive immunity,8 as well as coordinating the immune system through activation and stimulation of T and B cells, the tolerance by removal of self-reactive T cells 9 and the linkage with regulatory T cells.10 So, the DCs play a key role in the immune system control. In the PB, the DCs are present in two subsets: myeloid (or conventional) DCs (mDCs) and plasmacytoid DCs (pDCs). The pDCs (CD123+CD11c) produce interferon (IFN) I and are implicated in the viral immune response, immune tolerance and memory. At the same time, mDCs (CD123-CD11c+) are responsible for a proinflammatory effect. Each DC subset is flexible in vivo and its responses vary according to factors, such as its activation state, the nature of the stimulus received and the inflammatory microenvironment.11 In the immune recovery after the HSCT, the DCs play a relevant role in the aGvHD, cGvHD, GvL and host response to infections,12 while a poor DC reconstitution is associated with an increased risk of relapse and poor survival.13,14
The NKT cells (NKTs) are T cells that express NK receptors, including NK 1.1 (CD161c) and semi-invariant CD1d-restricted αβ T-cell receptors (TCRs). There are two types of NKTs: the type I NKT (or iNKT), that expresses the Vα24-Jα18, and the type II NKT that expresses TCRs other than the Vα24-Jα18.15
Natural killer cells (NKs) are components of the innate immune system, eliminating tumor and infected cells, promoting cellular lysis in the absence of the HLA class I receptor. The NK cells are categorized as the NK 56dim16bright (90% of NKs in PB), with a predominant cytotoxic effect through the release of granzyme B and perforin, and the NK 56bright16−, related to the interferon gamma (INF-γ) and tumor necrosis factor α (TNF-α) secretion.16 The NKs are the first cells to recover after the HSCT and strongly contribute to the GvL effect, possibly due to the killer-cell immunoglobulin-like receptor (KIR) mismatch.17 It has been shown that low counts of the NK 56bright16− after the HSCT are associated with a lower survival rate 18 and that KIR mismatches improve survival.19
To better understand the mechanisms involved in different outcomes in the HSCT using UCB or PB, we compared the composition of immune-related cells in these two HSC sources (monocytes, B lymphocytes, T cells, NK cells and DCs and their subsets) in samples of UCB and PB.
MethodsPopulation and designThis was a descriptive study. Samples of 54 UCB and 25 PB were collected between September 2015 and July 2017. UCB samples from healthy newborns, with a minimum gestational age of 35 weeks, were collected at the Cellular Therapy Center of the Hospital Sírio Libanês (before freezing). The UCB from neonates with any antenatal risk factors were excluded. The PB samples were collected from healthy adult blood donors at the Hospital São Paulo / UNIFESP Blood Center. The blood donors and pregnant women who agreed to donate the UCB (both ≥ 18 years old), without any documented chronic illness or infectious disease, entered the study. The blood donor volunteers who had received blood transfusion in the last 3 months were excluded.
The study was approved by the local ethics committee of the participating centers and all volunteers (blood donors and mothers) gave their informed consent before entering the study, in accordance with the Declaration of Helsinki.
Cell identification and count by flow cytometryFresh EDTA-anticoagulated PB or UCB samples were processed in up to 24 hours after collection. The total number of nucleated cells from the UCB was quantified by the Coulter AcT Diff 2® (Beckman Coulter, Brea, USA) and the PB cells, by the Cell Dyn Ruby® (Abbott, Illinois, USA), and the erythroblasts were quantified by microscopy to correct the leukocyte count. Leukocytes and subsets were analyzed by flow cytometry.
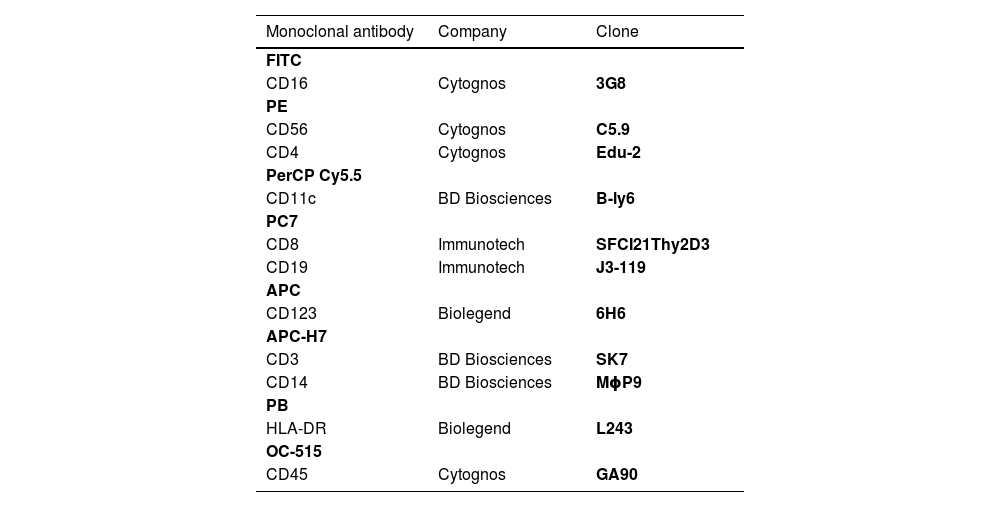
Cells were stained using an 8-color monoclonal antibodies panel (Table 1): CD16 FITC / CD56+CD4 PE / CD11c PerCP Cy5.5 / CD8+CD19 PC7 / CD123 APC / CD3+CD14 APC-H7/ HLA-DR Pac Blue/ CD45 OC-515, by the stain-lyse-wash method. The reagents were purchased from: Cytognos, Salamanca (CD16, CD56, CD4, CD45), BDB, San Jose, CA (CD11c, CD3, CD14), Immunotech Brea (CD8), Immunotech Marseille (CD19) and Biolegend, San Diego (HLA-DR, CD123). Data acquisiton: 500,000 events for each sample tube were performed using the FACSCANTOII flow cytometer (BDB- San Jose, CA) and the FACsDIVA® software (BDB- San Jose, CA) and the Infinicity® software (Cytognos, SL) was used for data analysis. The NK cells (CD3-, CD19-, CD14- and CD56+), were classified as NK 56bright16− or NK 56dim16bright. Monocytes (CD45+, CD11c+ and HLA-DR+) were classified as: classic (CD14++CD16-), intermediate (CD14++CD16+) and non-classic (CD14dimCD16++). Dendritic cells (HLA-DR++, CD3-, CD19-, CD14- and CD56-) were classified as pDC (CD123+/ CD11c-) and mDC (CD123-/ CD11c++) (Figure 1–3).
Monoclonal antibodies used.
. They are further divided into two subpopulations: NK CD56++/CD16- and NK CD56+/CD16+.")
Dot plot graphs of flow cytometry analyses showing gating strategy to natural killer cell identification. NK cells have small size and complexity, strong CD45, are negative for CD3 and HLA-DR and have positive CD56 (A–E). They are further divided into two subpopulations: NK CD56++/CD16- and NK CD56+/CD16+.
. They were further divided into classic (CD14+CD16-), intermediate (CD14+CD16+) and non-classic (CD14low/CD16+) (F).")
Dot plot graphs of flow cytometry analyses showing gating strategy to monocyte identification. Monocytes have higher size and complexity than lymphocytes, CD45+, CD14+, strong HLA-DR and CD11c (A–E). They were further divided into classic (CD14+CD16-), intermediate (CD14+CD16+) and non-classic (CD14low/CD16+) (F).
The descriptive statistical analysis was reported by using percentages (categorical variables) and ranges and medians (continuous variables). Comparisons between UCB and PB were performed using the Mann-Whitney test. A p-value of < .05 was considered significant. The SPSS version 21.0 (SPSS Inc., Chicago, IL) was used for all statistical analyses.
ResultsClinical characteristicsSeventy-nine samples (54 UCB and 25 PB) were obtained. The UCB samples were collected from newborns with a median gestational age of 40 weeks (range: 36 to 43 weeks) and birth weight of 3.263kg (range: 2.530 to 4.005kg). Twenty-nine (54%) newborns were male. Vaginal delivery was more commonly used (74%) than the cesarean section (26%). The PB sample donor median age was 33 years old (range 18 to 66 years old) and 15 (60%) were male.
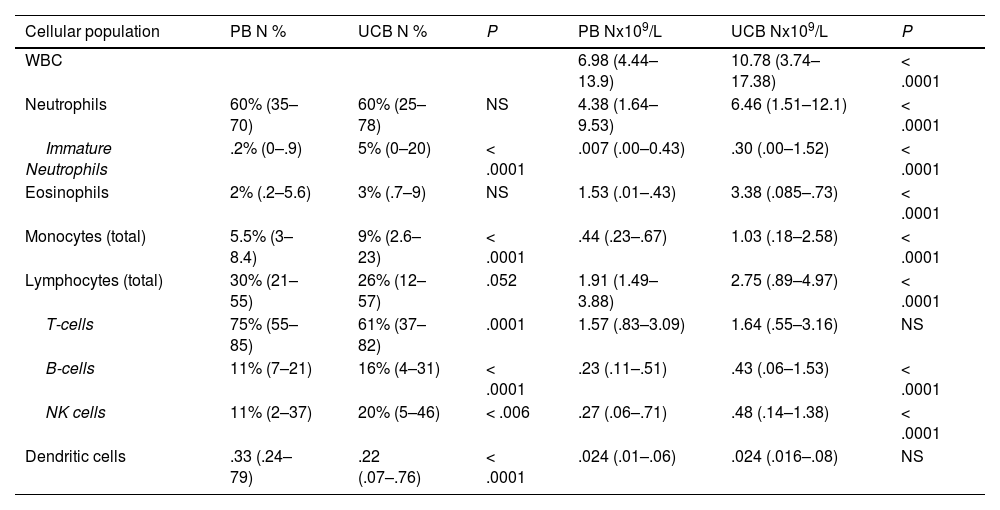
Absolute counts of WBCs and subpopulationsThe total white blood cell (WBC) count was higher in the UCB than in the PB (10.782 × 10⁹ vs. 6.980 × 10⁹, p < 0.0001). The total number of cells from most lineages (neutrophils, eosinophils, monocytes and B cells) were higher in the UCB, while total T cells, NK cells and total DCs were similar in both groups (Table 2). Among subpopulations, many differences were noted: non-classic monocytes, double positive CD4+CD8+ T cells and double negative CD4-CD8- T cells were in higher counts in the PB than in the UCB (0.051 × 10⁹ vs. 0.024 × 10⁹, p < 0.0001; 0.005 × 10⁹ vs. 0.001 × 10⁹, p < 0.0001; 0.054 × 10⁹ vs. 0.039 × 10⁹, p = 0.005, respectively). However, the pDCs were in lower counts in the PB than in the UCB (0.006 × 10⁹ vs. 0.008 × 10⁹, p = 0.03, Table 3). No significant statistical difference was observed in mDC counts between the groups.
Relative distribution and absolute counts of total leukocytes, neutrophils, eosinophils, monocytes, lymphocytes (T-cells, B cells and NK cells) and dendritic cells in peripheral blood and umbilical cord blood samples.
PB Peripheral blood, UCB Umbilical cord blood, WBC white blood count, pDCs plasmacytoid dendritic cells, mDCs myeloid dendritic cells.
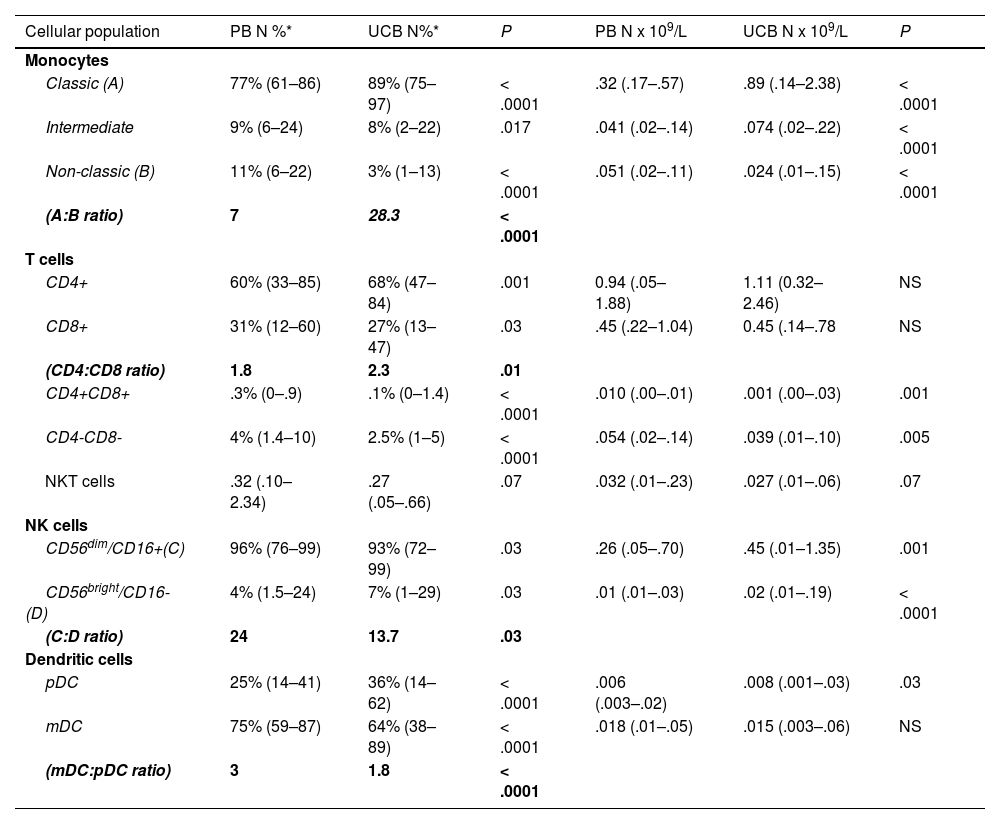
Relative distribution, absolute counts and ratios of monocytes, T-cells, NK cells and dendritic cells subpopulation.
PB Peripheral blood, UCB Umbilical cord blood, pDCs plasmacytoid dendritic cells, mDCs myeloid dendritic cells.
The proportion of B cells and NK cells were higher in the UCB samples when compared to the PB samples (16% vs. 11%, p < 0.0001; 20% vs. 11%, p < 0.006, respectively).
In terms of relative frequencies of subpopulations, classic monocytes were the predominant subset, being present in a higher count in the UCB vs. the PB (89% vs. 77%, p < 0.006 × 10⁹), respectively. The classic monocytes:non-classic monocytes ratio was 28.3 in the UCB and 7.0 in the PB (p < 0.0001).
The T cells CD4+ were more prevalent than the T cells CD8+ in both the PB and the UCB (CD4: CD8 ratio 1.8 and 2.3, respectively), while the T cells CD8+ were more frequent in the PB (31%) than in the UCB (27%, p = 0.03).
The NK cells 56dim16bright counts were the predominant subset in both samples (96% and 93%, PB and UCB, respectively). The ratio between the subtypes (NK cell NK 56dim16bright: NK 56bright16−) was lower in the UCB (13.7) vs. the PB (24, p = 0.03). NK 56dim16bright proportions of the pDC in the UCB, compared to the PB from normal adults
The mDCs were the predominant subtype in both the PB and UCB, being 3 times the number of pDCs in the PB and 1.8 times the number of pDCs in the UCB. However, there was no difference in mDC absolute counts between the two groups. The pDC proportion was 25% in the PB and 36% in the UCB (p < 0.0001). The mDC:pDC ratio was 3.0 in the PB vs.1.8 in the UCB (p < 0.0001).
The CD4:CD8 ratio was higher in the UCB (2.3) than in the PB (1.8, p = 0.01), and the NK cell NK 56dim16bright:NK 56bright16− ratio was lower in the UCB (13.7) vs. the PB (24, p = 0.03). The intermediate monocytes:non-classic monocytes ratio was 28.3 in the UCB and 7.0 in the PB (p < 0.0001) (Figure 4).
Discussion
In the present study, we compared concentrations (cells per liter) and frequencies (%) of WBCs and subsets in the UCB and PB from healthy individuals and observed higher counts and frequencies of the NK 56bright16− NK cells and pDCs and lower counts and frequencies of non-classic monocytes in the UCB.
To the best of our knowledge, this is the first study that compared subsets of the NK (NK 56dim16bright and NK 56bright16−) between the UCB and PB. The NK 56bright16− is a more immature NK cell, presenting a more humoral immune response profile, secreting the INF-γ, TNF-α, IL-10, IL-13 and granulocyte-macrophage colony-stimulating factor, rather than the direct cytotoxic effect of the NK 56dim16bright. They usually do not present KIR receptors and present higher expressions of the heterodimer CD94/NKG2A (major inhibitor receptor), which confers a lower alloreactivity than their more mature NK 56dim16bright counterpart.20 Therefore, there are higher counts and higher frequencies of NK 56bright16− NK cells and plasmacytoid dendritic cells in the UCB than in the PB.
Of interest, the monocyte maturation was clearly more evident in the PB than in the UCB samples. The PB showed high proportions of the late phases of monocyte differentiation, such as intermediate and non-classic monocytes, which was also observed by some previous studies.21 These populations represent a shift towards higher antigen-presenting activity and they are considered as monocyte-derived DCs 22 and are also being related to autoimmune diseases, such as rheumatoid arthritis and Crohn's disease.23
We found higher counts of pDCs in the UCB than in the PB, corroborating the findings of Prabhu SB et al. 21; the pDC produces the IFN type I, which is related to antiviral response, immune tolerance and anti-tumor immunity through secretion of the type-I IFN and TNF-α.24 Moreover, our group previously demonstrated that grafts with a high pDC content lead to a lower aGVHD and lower mortality risk after the HSCT.18
The GvHD is a reaction caused in part by donor alloreactive T CD8+ and T cell depletion (in vivo or ex vivo), which is a common strategy to mitigate this complication.25,26 Here we demonstrated a higher concentration of the T CD8+ in the PB, compared to the UCB, as has been shown in previous studies.27–29
All these findings in the PB: more mature monocytes, a higher concentration of T CD8+ and lower counts of pDC and NK 56bright16−, compared to the UCB, might explain the higher incidence of the cGvHD when the PB is used as a stem cell source for the HSCT.30 Conversely, the more tolerogenic profile observed in the UCB, compared to the PB, could explain the lower risk of the cGvHD with similar relapse rates as evidence of the sustained GvL effect.5,31,32
Our study has limitations, such as small sample size and the use of PB samples without the stimulation of granulocyte colony-stimulating factors, as commonly used for the HSCT, which could change the cells counts and frequencies.
ConclusionIn conclusion, we observed higher counts of NK 56bright16− cells and pDCs and lower counts of non-classic monocytes in the UCB, compared to the PB from healthy individuals. Even though the PB analyzed in this study was not obtained through apheresis, our findings could suggest that the UCB cell profile is more tolerogenic than the PB and this finding might explain the lower incidence and severity of the cGVHD in UCB recipients, compared to other stem cell sources, although maintaining the GVL effect. Future research is needed for a better understanding of immune reconstitution in the HSCT and to explain the differences regarding immune reconstitution and the GvHD risk, the GvL effect and other clinical outcomes in the HSCT among different stem cell sources.
Authorship statementM.C.R.B., V.C.M, M.V.G. and C.A.R. designed the research, performed research, analyzed data and wrote the paper; V.C.M, M.V.G. and C.A.R. performed statistical analysis; A. M. J. and C. A. A provided cord blood samples, M.C.R.B., M.Y. and M.V.G. performed flow cytometry analysis, critical review and revised the manuscript. All authors drafted and approved the manuscript and agreed with its submission.
Financial Disclosure StatementThe authors have nothing to disclose.
M.C.R.B. was supported by the Coordenação de Aperfeiçoamento de Pessoal de Nível Superior (CAPES, No. 001). V.C.M. was supported by the Conselho Nacional de Desenvolvimento Científico e Tecnológico (CNPq Process No. 141575/2018-2).


