


Reticulocytes are immature red blood cells containing RNA remnants. Their population kinetics has been documented under various in vivo and in vitro conditions, including after storage of red blood cells in blood banks. The purpose of this study was to describe the influence of blood bank storage on the kinetics of reticulocyte disappearance by in vitro culturing.
MethodSamples of reticulocyte-enriched fractions (Percoll density-gradient) were obtained over different storage times from six red blood cell units stored in additive solution-1 (AS-1). Reticulocyte fractions were then cultured in enriched media at 37°C and analyzed by flow cytometry with thiazole orange taking into account hemolysis.
ResultsDensity-gradient enriched reticulocyte fractions were obtain from standard red blood cell units with <1% of reticulocytes. An exponential drop of reticulocytes was observed in cultures. The time taken for reticulocyte disappearance in cultures was shorter with increased blood bank storage time (144±46h at 0.5 weeks of storage and 15±14h in the sixth week). High fluorescence reticulocytes disappeared completely in 42.5±8.5h, medium fluorescence reticulocytes in 73.4±20.8h and low fluorescence reticulocytes in 269.9±98.8h in red blood cell units stored for half a week. These times significantly decreased in red blood cell units stored for more time.
ConclusionIn vitro reticulocyte disappearance was significantly faster after prolonged storage of red blood cell units at 4°C. The in vitro half-life at 0.5 weeks of storage was not significantly different from the values reported for fresh venous blood, but after the sixth week of storage, the half-lives were shorter. The possible explanation is that blood bank storage does not cause irreversible damage to the human reticulocyte maturational machinery.
In mammals, reticulocytes are immature red blood cells (RBCs) containing RNA remnants. Maturation to discocytes depends on energy and occurs during progressive stages in which RNA content decreases, protein synthesis becomes complete and the plasma membrane and cytoskeleton become remodeled.1 The entire in vivo process takes place in about three days in bone marrow followed by one to two days in the peripheral blood2 and is dependent on erythropoietic stress.3,4In vitro, under culture conditions, reticulocyte maturation is characterized mainly by: (1) decreasing number of RNA-containing RBCs (total reticulocyte count); (2) progressive decrease of corpuscular RNA content; and (3) reductions in cell size.1,4,5 Reticulocytes can be classified according to RNA content into subtypes reflecting successive stages during maturation: high fluorescence reticulocytes (LFR) mature to medium fluorescence reticulocytes (MFR) and these to low fluorescence reticulocytes (LFR).6,7 The rate of in vitro reticulocyte maturation depends on the temperature5 and medium composition. The normal time for reticulocyte disappearance in culture conditions increases as incubation temperature drops5; reticulocyte disappearance changes according to the medium composition with a half-life of 4.8±1.9h during agitated incubation at 37°C in phosphate buffer solution with added glucose4 in contrast to 20–29h in enriched culture medium.8
The reticulocyte counts in whole blood and RBC units drop progressively but do not disappear completely during standard blood bank storage5,9 and reticulocytes can be detected in the recipients’ circulation up to 24–48h post-transfusion.10 A previous study characterized the pattern of total reticulocytes and reticulocyte subtypes in RBC units stored in additive solution-1 (AS-1: Adsol®) under blood bank conditions for up to six weeks, suggesting that they continue to mature slowly during refrigerated storage.9 Blood bank storage implies not only a low temperature (4°C) but also other conditions called the ‘storage lesion’, including but not limited to extracellular fluid acidification. Re-establishing physiological conditions (temperature and pH), as occurs during culture conditions, may reflect in the restoration of the kinetics of cell metabolism or not. This study aimed to describe the influence of previous blood bank storage on the kinetics of reticulocyte disappearance during in vitro culturing.
MethodRed blood cell units and samplingThis study was approved by the institutional ethics committee and followed current protocols for research involving humans and the handling of biological samples (Declaration of Helsinki). Non-leukoreduced whole blood units were obtained from six healthy volunteer blood donors using triple CPD-Adsol® bags (Optipac, Fenwall, Baxter S.A., Lake Zurich, IL, USA). Whole blood units were spun at high speed (4000RPM, equivalent to 4100×g for 10min at 22°C) in a Beckman J6B centrifuge with rotor JS-5.2 (Beckman Coulter Inc., Palo Alto, CA, USA). Top and bottom technology was used for automatic fractionation (Optipress II, Fenwall, Baxter S.A., Deerfield, IL, USA). The resulting buffy coat-depleted RBC units in AS-1 were stored in standard blood bank conditions for six weeks. RBC units entered the study 72–96h (0.5 weeks) after collection due to the implementation of routine screening for infectious diseases, according to local regulations for blood processing. For the experiments, 10mL aliquots of each unit were obtained after 0.5, 2, 4 and 6 weeks of storage using an aseptic technique.
Reticulocyte cultureConsidering that the reticulocyte count in blood bank RBC units is lower than in peripheral blood and the number decreases further during refrigerated storage as we have previously reported,9 a reticulocyte-enrichment procedure was designed to obtain culture inoculums with a reticulocyte count not below that usually expected in peripheral venous blood. Thus, before inoculation in culture bottles, reticulocyte-enriched fractions were obtained from RBC unit aliquots using Percoll density gradient separation (Sigma–Aldrich, St. Louis, MO, USA). Samples obtained from the RBC units were diluted 1:1 in a buffered solution containing 9mM Na2HPO4, 1.3mM NaH2PO4, 140mM NaCl, 5.5mM glucose and 0.8g/L bovine albumin at pH 7.40. Diluted samples were incubated at room temperature (25±2°C) for 30min. Continuous density gradients were prepared using 36.4% and 62.53% (v/v) Percoll solutions in 154mM NaCl. Subsequently, 6mL of each Percoll solution were dispensed in a gradient former (Bio-Rad Gradient Former Model 385, Catalog # 165-2000, Bio-Rad Laboratories, Hercules, CA, USA). Gradients were prepared in 15mL polypropylene centrifuge tubes (Falcon, Becton Dickinson Company, San Jose, CA, USA) and were stabilized by centrifuging at 900×g (2500RPM) for 5min in a 45° fixed-angled rotor centrifuge (Sorvall Biofugue Prime R, with a Highconic® rotor #75007588, Sorvall, Newtown, CT, USA). Six hundred microliters of diluted sample was added to each gradient and spun at 900×g (2500RPM) for 20min at room temperature. Percoll density marker beads (Sigma–Aldrich, St. Louis, MO, USA) were used to determine the density of continuous gradients. Flow cytometry with thiazole orange (Retic-Count, Becton Dickinson Company, San Jose, CA, USA) was used to measure the total reticulocyte count and reticulocyte subtype concentrations before and after separation as described below. The yield of the reticulocyte-enrichment procedure is presented in the Results Section.
Culture bottles were inoculated with a reticulocyte-enriched concentrated aliquot from each RBC unit obtained at the different sampling times. The enriched culture medium was based on RPMI-1640 with the addition of 23mM HEPES, 9mM inosine 5-monophosphate, 5mM adenosine, 4mM glutamine, 22mM NaHCO3, 100IU/mL penicillin, 100μg/mL streptomycin and 0.25μg/mL amphotericin B (all chemicals were obtained from Sigma–Aldrich, St. Louis, MO, USA). Osmolarity was adjusted to 295mOsm/kg and pH to 7.3 before sterile filtration. NaHCO3 was added as an extra buffer to keep pH stable at 5% pCO2 in the incubator. The pH was 7.45 after pCO2 equilibrium. To prevent cell adhesion, culture bottles were pre-incubated at 37°C for 30min with autologous plasma to achieve 20% (v/v) final concentration. Each concentrated aliquot was used for inoculation of a set of culture bottles that were incubated at 37°C in 5% CO2 atmosphere. Total RBC concentration in the bottles was 3.0±0.2×10⁹cells/L. After incubation at 1- to 4-h intervals, one bottle was taken from each set for reticulocyte analysis.
Cell survival was monitored by measuring free hemoglobin released to the culture medium by spectrophotometry (HemoCue low Hb, HemoCue, Ängelholm, Sweden). RBC counts were determined by impedance cytometry and total hemoglobin by the sodium lauryl sulphate method in an automated hematology analyzer (Sysmex-R480, Sysmex America Inc., Mundelein, IL, USA). Percentage hemolysis was calculated as free hemoglobin percentage regarding total hemoglobin.
Reticulocyte analysisReticulocyte percentage was determined by flow cytometry using thiazole orange staining. Two microliters of samples were added to 1mL of thiazole orange solution (Retic-COUNT, Becton Dickinson Company, San Jose, CA, USA). The mixture was stirred and incubated at 37°C in the dark for 30min. An unstained control was simultaneously prepared for each sample and analyzed by adding 2μL of the sample to 1mL of phosphate buffer solution and 0.1% sodium azide (w/v). Fluorescence intensity was measured at 530nm in a flow cytometer (FACSCalibur, Becton Dickinson Company, San Jose, CA, USA). Acquisition parameters were set using reticulocyte controls in whole blood (BD ReticCount Control, Becton Dickinson Company, San Jose, CA, USA); the results agreed with those expected by the manufacturer. Precision profile changes according to reticulocyte concentration had 28.2%, 1.8% and 13.3% variation coefficients (VC%) for 0.2%, 1.2% and 2.5% reticulocyte percentages, respectively. Determination coefficient (R2) test–retest was 0.99. The performance of the technique was thus close to that of fully-automated, clinical hematology analyzers (7.6–54.6% VC).11 One hundred thousand events were acquired for each sample at 1000events/s. The gate for RBCs was set from light scatter cytograms and fluorescence distribution scatterplots were analyzed using CellQuest Pro software (Becton Dickinson Company, San Jose, CA, USA) excluding auto-fluorescent cells. Reticulocytes were classified according to the intensity of their fluorescence as high (HFR), medium (MFR) and low fluorescence (LFR) subtypes (Figure 1).12 Light scatter and fluorescence intensity were plotted to analyze reticulocyte subtype size and fluorescence changes during culturing.13 For estimates of kinetics, reticulocyte counts expressed as percentage of total red cells were used, as were the absolute reticulocyte counts calculated from percentages and RBC counts.
, medium (MFR) and high fluorescence (HFR).12 FL1: fluorescence intensity; FSC: forward light scattering.")
Reticulocyte analysis by flow cytometry using thiazole orange of a red blood cell unit stored for 0.5 weeks in AS-1. Fluorescence scatterplot from the red blood cell gate after excluding autofluorescent cells. Total reticulocytes were classified into subtypes having low (LFR), medium (MFR) and high fluorescence (HFR).12 FL1: fluorescence intensity; FSC: forward light scattering.
The results are expressed as means±1 standard deviation (SD). The calculated sample size was six RBC units for observing a difference in 0.1±0.05% in reticulocyte percentage or 10.0±4.6×10⁹/L in reticulocyte counts, considering a power of 0.8, a 0.05 α level and comparing four time points during storage (0.5, 2, 4 and 6 weeks). The Friedman test was used to determine significance; the Statistical Package for the Social Sciences software (IBM SPSS) v23.0 was used for statistical analysis.
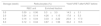
ResultsReticulocyte-enrichment procedure yieldThe Percoll densities were 1.070–1.088g/mL and densities of reticulocyte-enriched fractions were 1.0826–1.0844g/mL when fresh blood samples were used. With the enrichment procedure, fractions of from 3.7% to 5.3% reticulocytes were obtained for culture inoculum (Table 1) depending on the reticulocyte content in the RBC units at different blood bank storage periods.
Reticulocyte-enrichment by continuous Percoll density gradient using red blood cell units stored in additive solution 1 (AS-1).
| Storage (week) | Reticulocytes (%) | Yield %RET after%RET before | |
|---|---|---|---|
| RBC unit | Enriched fraction | ||
| 0.5 | 0.39±0.06 | 5.3±3.5 | 14.3±3.1 |
| 2.0 | 0.24±0.14 | 4.26±1.15 | 17.8±5.3 |
| 4.0 | 0.16±0.04 | 3.33±2.22 | 20.8±17.3 |
| 6.0 | 0.12±0.04 | 3.67±1.96 | 30.2±19.5 |
RBC: red blood cell; %RET: total reticulocytes percentage.
Reticulocytes are expressed as the percentage of total RBCs; the results are presented as the mean±1 standard deviation of six independent assays.
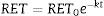
The reticulocyte count became significantly and progressively lower during culturing while percentage hemolysis was low (0.2±0.2%); in all assays the percentage of hemolysis was less than the drop in the reticulocyte percentage. Figure 2 shows the patterns of total reticulocyte counts and reticulocyte subtypes during culturing for samples obtained from RBC units with different storage times in AS-1 after subtracting hemolysis. These graphical representations of data showed that the disappearance of reticulocytes cultured in vitro was a negative exponential function. The corresponding equation is:

Reticulocytes enriched from red blood cell units stored in AS-1 had a reducing pattern in culture. HFR: high fluorescence reticulocytes; MFR: medium fluorescence reticulocytes; LFR: low fluorescence reticulocytes. The results are presented as the mean±1 standard deviation of six independent assays.
This equation expresses the number of reticulocytes surviving as a function of time with RET0 being the initial number of reticulocytes, e the basis for the Naperian logarithms and RET the number of reticulocytes present at any time t during the culture period; k is the reticulocyte maturation constant for each aliquot. Expressed in logarithmic form, Eq. (1) is as follows (Figure 3A):

 Fit of Naperian logarithm of reticulocyte concentration measured as cells×106/μL (Ln#RET) vs. time. The figure gives an example of a reticulocyte sample obtained from a red blood cell unit after 0.5 weeks of blood bank storage. The linear regression model of the Naperian logarithm of reticulocyte count (Ln#RET) compared to time fitted the data for all the samples analyzed (R2=0.77–0.96: p-value=0.0001). (B) The time for disappearance in culture conditions also may be calculated by analyzing size and shape changes. Forward (FSC) and side (SSC) light scattering signals of reticulocytes (RET) decrease progressively until they become equivalent to those of mature red blood cells (RBC) with the time for disappearance corresponding to the moment at which the SSC RET/RBC and FSC RET/RBC ratios are equivalent to 1.0. Results obtained by this method correlated with those calculated by the method based on fluorescence (reticulocyte count) (R2=1.0; p-value <0.001).")
(A) Fit of Naperian logarithm of reticulocyte concentration measured as cells×106/μL (Ln#RET) vs. time. The figure gives an example of a reticulocyte sample obtained from a red blood cell unit after 0.5 weeks of blood bank storage. The linear regression model of the Naperian logarithm of reticulocyte count (Ln#RET) compared to time fitted the data for all the samples analyzed (R2=0.77–0.96: p-value=0.0001). (B) The time for disappearance in culture conditions also may be calculated by analyzing size and shape changes. Forward (FSC) and side (SSC) light scattering signals of reticulocytes (RET) decrease progressively until they become equivalent to those of mature red blood cells (RBC) with the time for disappearance corresponding to the moment at which the SSC RET/RBC and FSC RET/RBC ratios are equivalent to 1.0. Results obtained by this method correlated with those calculated by the method based on fluorescence (reticulocyte count) (R2=1.0; p-value <0.001).
Disappearance time as calculated from Eq. (2) is:
Kinetics regarding reticulocyte disappearance in culture
As the reticulocyte disappearance in culture was a mono-exponential function as we described above, some kinetic parameters were calculated by mathematical analysis. It was observed that the reticulocyte disappearance rate became faster as the blood bank storage time increased. The reticulocyte disappearance time was 144.0±46.3h for RBC units stored for 0.5 weeks and declined significantly for units stored for 2, 4 and 6 weeks (73.3±59.1; 27.1±29.0; and 15.1±14.3h; respectively; p-value <0.001 – Table 2).
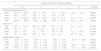
The kinetics of reticulocyte disappearance in culture according to length of blood bank storage.
| Length of blood bank storage (weeks) | |||||
|---|---|---|---|---|---|
| 0.5 | 2 | 4 | 6 | p-value | |
| Time until disappearance (h) | |||||
| RET | 144.0±46.3 | 73.3±59.1 | 27.1±29.0 | 15.1±14.3 | 0.0000 |
| HFR | 42.5±8.5 | 24.0±2.6 | 14.3±3.4 | – | 0.0001 |
| MFR | 73.4±20.8 | 32.5±19.5 | 19.2±11.0 | 3.0±2.9 | 0.0000 |
| LFR | 269.9±98.8 | 104.0±45.9 | 29.3±12.8 | 15.2±5.9 | 0.0000 |
| Half-life (h) | |||||
| RET | 27.9±13.9 | 25.3±30.3 | 5.6±6.4 | 2.5±2.4 | 0.0000 |
| HFR | 12.9±7.4 | 7.1±1.5 | 3.6±4.2 | – | 0.0100 |
| MFR | 15.6±4.5 | 8.3±5.6 | 4.9±4.0 | 1.8±1.8 | 0.0040 |
| LFR | 43.1±42.3 | 22.7±16.7 | 6.3±6.7 | 2.5±2.4 | 0.0001 |
| Disappearance rate (h−1) | |||||
| RET | −0.03±0.02 | −0.05±0.02 | −0.30±0.31 | −0.74±0.66 | 0.0003 |
| HFR | −0.07±0.03 | −0.10±0.02 | −1.22±2.17 | – | 0.0300 |
| MFR | −0.05±0.02 | −0.17±0.20 | −0.30±0.25 | −0.95±0.79 | 0.0040 |
| LFR | −0.03±0.02 | −0.03±0.03 | −0.29±0.26 | −0.71±0.63 | 0.0010 |
RET: total reticulocytes; HFR: high fluorescence reticulocytes; MFR: medium fluorescence reticulocytes; LFR: low fluorescence reticulocytes.
The results are presented as the mean±1 standard deviation for six independent assays.
In addition to the changes in fluorescence observed during cultivation, reticulocytes also showed changes in shape, manifested as a progressive decrease in side (SSC) and forward light scatter (FSC). The time for reticulocyte disappearance, defined by the moment at which the ratio of SSC of reticulocytes to mature RBCs (SSCRET/RBC) and the ratio of FSC of reticulocytes to mature RBCs (FSCRET/RBC) equaled 1.0, was calculated. Results obtained using this method were strongly correlated with the time for disappearance calculated by the fluorescence-based kinetic analysis (R2=1.0; p-value <0.001) (Figure 3B).
Moreover, reticulocyte subtypes showed distinctive disappearance kinetics; the time was faster for HFR and slower for MFR and LFR. Indeed, HFR completely disappeared after 42.5±8.5h, MFR at 73.4±20.8h and LFR at 269.9±98.8h for RBC units stored for 0.5 weeks. These times became significantly reduced for each reticulocyte subtype in RBC units having longer blood bank storage times. The kinetics of disappearance for HFR in units stored for six weeks could not be determined because they were undetectable.
Furthermore, the half-life and constant disappearance rate could be calculated from Eq. (2):

These additional kinetic parameters also showed differences related to blood bank storage time. The half-life of total reticulocytes obtained from RBC units stored for 0.5 weeks was 27.9±13.9h; this decreased significantly by the end of storage to 2.5±2.4h (p<0.001). HFR from RBC units after storage for 0.5 weeks had a half-life of 12.9±7.4h in culture, while this was 15.6±4.5h for MFR and 43.1±42.3h for LFR. These values decreased significantly as the RBC unit storage time increased (Table 2). The constant reticulocyte disappearance rate of RBC units at the beginning of storage −0.03±0.02h−1 increased to −0.74±0.66h−1 by the sixth week (p-value=0.001). HFR had a disappearance constant of −0.07±0.03h−1 at Week 0.5 which increased to −1.22±2.17h−1 by the 4th week of storage (p-value=0.01). For MFR, it was −0.05±0.02h−1 at Week 0.5 and −0.95±0.79h−1 by the end of storage (p-value=0.004). In the case of LFR, it was −0.03±0.02h−1 at Week 0.5 and −0.71±0.63h−1 by Week 6 (p-value <0.001 – Table 2).
To summarize, an exponential decay for reticulocytes in culture was observed in all six RBC units studied at different blood bank storage times in AS-1. However, the kinetic parameters revealed significant differences according to the length of storage: reticulocyte disappearance time in culture became shorter with increasing blood bank storage time for all aliquots analyzed. Bivariate regression was used to analyze the relationship between reticulocyte disappearance time during culturing and previous blood bank storage duration giving the following model:
where y is the disappearance time in culture and x the blood bank storage time. The y intercept showed that the average disappearance time for reticulocytes isolated from fresh RBC units is 138.1±16.9h. The slope suggested that the disappearance rate during refrigerated blood bank storage was 7.3-fold lower than during cultivation at 37°C (1/slope=7.3). Rearranging the terms of the equation, total reticulocyte disappearance time was equivalent to decay time in culture conditions plus blood bank storage time adjusted by a constant accounting for the delay produced by refrigerated blood bank storage (Eqs. (6) and (7)):Discussion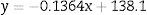

Several methods have been used to enrich reticulocytes from venous blood samples (expected reticulocytes concentration: 1–2%). Differential centrifugation, density gradient centrifugation, and elutriation attain reticulocyte concentrations of 2.6%,14 7–13%14 and 4–5%,15,16 respectively, while immunomagnetic separation using anti-CD71 antibodies attains concentrations greater than 90%.8,15 However, none of these methods have been used in samples from RBC units that have been obtained by the centrifugation of whole blood units and have lower reticulocyte concentrations than those observed in venous blood.9 In this study, we used a Percoll density gradient centrifugation technique with reticulocyte-poor samples due to the standard blood bank processing to obtain RBC units; this technique obtained inoculums for culturing with reticulocyte counts close to those of fresh peripheral venous blood.
With this Percoll density centrifugation technique, a 14-fold increase in reticulocyte concentration was achieved in samples obtained from RBC units after 0.5 weeks of storage and the yield was even higher for units with longer storage times, obtaining a 30-fold increase in reticulocyte percentages from samples obtained from units at the end of the sixth storage week. This higher yield can be explained by the fact that reticulocyte fractions in the density gradients change throughout storage, with smaller volumes and higher reticulocyte concentrations. On the one hand, as storage progresses, the concentration of free hemoglobin increases, which floats at the top of the density gradients, so that it is necessary to avoid this layer and harvest the reticulocyte fraction below, thus collecting smaller volumes. On the other hand, it has been documented that the densities of all RBC populations increase during storage so that the reticulocytes are expected to be in bands of higher density within the gradient,17 thereby increasing reticulocyte concentrations in the fraction below the floating free hemoglobin, but above the fractions of mature RBCs. Although the densities of collected fractions was measured using Percoll density markers, these measurements were achieved with fresh blood samples and not with stored blood samples.
The results of this study show that, total reticulocytes obtained from RBC units after 0.5 weeks of refrigerated storage had a half-life of 27.9±13.9h during incubation at 37°C, with 0.2±0.2% hemolysis. This result is similar to previously reported data on fresh blood samples.8 When the aliquots taken at different blood bank storage times were compared, it was observed that the reticulocyte disappearance rate increased (shorter disappearance times) for RBC units having longer storage times in a glucose-rich medium such as AS-1. Since there was no difference between these aliquots regarding hemolysis, one plausible explanation is that the maturation of reticulocytes to discocytes occurred somewhat during storage in blood bank conditions.9 Nevertheless, the maturation rate during storage at 4°C appears to be much lower than that at 37°C as reticulocytes were present even in aliquots taken from refrigerated RBC units after the sixth week of storage. Similarly, another paper has also reported the presence of reticulocytes in RBC units in citrate-phosphate-dextrose-adenine-1 (CPDA-1) after 35 days of blood bank storage.5 Refrigerated storage does not seem to cause permanent damage to the maturational machinery since the rate of disappearance in culture at 37°C reported in the present study was equal to or faster than that reported in fresh blood under equivalent culture conditions.8
Because reticulocyte maturation occurs gradually, as reflected in decreased fluorescence determining passage from high fluorescence (HFR) to medium fluorescence reticulocytes (MFR) and then to low fluorescence reticulocytes (LFR), if maturation is assumed to be the main explanation for cultured reticulocyte disappearance, it would be expected that the cells having shorter disappearance time would be the HFR. The results presented here for reticulocyte subpopulations support this hypothesis.
In addition, as the fluorescence decreased, cells with high levels of light scatter not corresponding to mature discocytes disappeared in parallel. The ratio of light scattering of these cells to mature erythrocytes approached 1.0 throughout the culture time (Figure 3B). In subpopulations, it was noted that the fastest decrease occurred in HFR, corresponding to cells with the highest light scatter, as presented in the graphs (Figures 1 and 2). The progressive decrease in the reticulocyte count was accompanied by parallel changes in SSC and FSC. This allowed us to determinate that the complete disappearance of fluorescence (zero reticulocyte count) was accompanied by a cytological homogenization of all cells present in the culture, with light-scattering parameters correspondent to mature discocytes. A non-specific hemolytic process in reticulocytes would be reflected as a decreased reticulocyte count but not as a change in light scattering indices.
If the progressive maturation of the reticulocytes into discocytes is admitted as the main mechanism responsible for the time-dependent decrease in the reticulocyte count during culturing of fresh peripheral blood (20–29h),8 during storage of RBC units at 4°C, and during in vitro culturing after refrigerated storage (28–2.5h), it can be proposed that standard blood bank storage conditions fundamentally cause a slowing down of the maturation process, possibly due to the low temperature, and that the rate of this process is recovered by bringing the cells back to 37°C. Thus, cells that have been exposed to blood bank refrigerated storage complete their maturation in cultures at 37°C in proportionally less time depending on the time of storage in refrigeration. This might mean that the storage conditions of RBC units (no plasma, with anticoagulant/additive solution and low temperature) are not able to completely arrest reticulocyte maturation into discocytes.
Reticulocytes are considered a metabolic transition stage in erythroid maturation; they are cells that are ceasing to be aerobic and becoming anaerobic (discocytes). Thus, it is not surprising that reticulocyte maturation can be sustained with just glucose and adenine as metabolic sources. It is well known that reticulocyte maturation into discocytes is an active adenosine triphosphate (ATP)-dependent process18,19 characterized by mRNA translation,20 protein synthesis,8,20–22 and membrane remodeling,23 hence the relatively rapid fall in intracellular ATP levels observed with solutions such as CPDA-122 may be reflected in energy deficiency at 4°C, thereby resulting in the arresting of reticulocyte maturation. By contrast, such energy demand could be supplied with the higher ATP concentrations observed throughout storage in AS-1.24
In addition to the energy metabolism, another factor that might influence reticulocyte maturation is the presence of plasma. Although plasma contains several stimulating factors for reticulocyte maturation (erythropoietin,25 hemin26 and iron26), its presence in whole blood units has not been associated with reticulocyte maturation.5 Furthermore, their absence, as in the RBC units in the current study, did not seem to be a limiting condition for reticulocyte maturation. The presence of plasma would thus not seem to be a necessary or sufficient condition for reticulocyte maturation under blood bank conditions.1,3,4,8
ConclusionData presented here seem to be consistent with the fact that refrigerated storage under blood bank conditions does not cause definitive damage to the human reticulocyte maturational machinery, but only a reversible kinetic slowdown.
Conflicts of interestThe authors declare no conflicts of interest.
Thanks to the National Blood Bank of the Colombian Red Cross for providing the red blood cell units for this study.


