

In sickle cell disease, the quantification of Hb A2 is important for the differential diagnosis between sickle cell anemia (Hb SS) and Hb S/β0-thalassemia.
ObjectiveTo determine Hb A2 levels as quantified by high performance liquid chromatography in patients with sickle cell anemia (Hb SS) and with the SC hemoglobinopathy, with or without concomitant alpha thalassemia.
MethodsThis is a retrospective study of 242 children aged between two and six years with diagnoses of Hb SS or Hb SC. The hemoglobin was evaluated using high performance liquid chromatography and alpha thalassemia [3.7kb deletion (−α3.7)] was detected by polymerase chain reaction. Patients were classified as homozygous (−α3.7/−α3.7), heterozygous (−α3.7/α), or homozygous wild-type. Analysis of variance was used to compare the mean Hb A2 values between the alpha thalassemia groups.
ResultsThe mean (±standard deviation) Hb A2 concentrations in the Hb SS group (n=135) was 3.68±0.65%. The mean values for individuals with Hb SS and heterozygous (n=28) or homozygous for alpha thalassemia (n=3) were 3.98±0.64% and 4.73±0.25%, respectively. The mean Hb A2 of all the Hb SC patients (n=107) was 4.01±0.507 with 4.29±0.41% and 4.91±0.22% in individuals heterozygous (n=23) and homozygous for alpha thalassemia (n=7), respectively. All patients homozygous for alpha thalassemia had Hb A2 levels above 3.5%. However, Hb A2 values above 5.2% were seen in patients with Hb SS and Hb SC, independently of alpha thalassemia.
ConclusionHb A2 levels are elevated in patients with Hb S or Hb C, and are directly influenced by the alpha thalassemia genotypes.
Sickle cell disease is one of the most common genetic pathologies in the world. It is characterized by homozygous hemoglobin S (Hb S) or Hb S associated to other Hb variants.1 There is great clinical variation in the clinical manifestations between sickle cell disease patients; several factors are associated with the different presentations. Some determinants are already well established, such as genetic, clinical and laboratory factors, while others, such as psycho-social and nutritional factors, have been less well studied.2–5
Of the genetic factors, the importance of the phenotype of the hemoglobinopathy is well characterized in that individuals doubly heterozygous for sickle cell anemia and those with Hb S/β0-thalassemia have a more severe clinical profile. On the other hand, carriers of Hb SC together with Hb S/β+-thalassemia have better outcomes, which makes the correct diagnosis of these syndromes an issue of great importance for a better understanding and adequate clinical and therapeutic management of patients.4–6
In the diagnosis of sickle cell disease, quantification of Hb A2, as well as a complete blood count (CBC), family history and clinical data, help to establish the differential diagnosis between sickle cell anemia (Hb SS) and Hb S/β0-thalassemia.7,8
The choice of the methodology to accurately measure Hb A2 has been the subject of many discussions in the medical literature, and high performance liquid chromatography (HPLC) has been regarded the method of choice for many years. The reference value of Hb A2 in healthy adults who do not have thalassemia is usually between 2.0 and 3.3%.5,9–12
In 1996, Suh et al.13 reported that Hb A2 values obtained by HPLC increased significantly in samples containing Hb S and suggested the possibility that Hb SS individuals may have been incorrectly diagnosed with Hb S/β0-thalassemia. They also suggested that increases in Hb A2 could be explained by the presence of smaller components of Hb S that co-eluted with Hb A2.
In 2000, Shokrani et al.14 proposed that blood samples with Hb values of up to 5.9% and up to 5.2% of Hb A2 as analyzed by HPLC from Hb SS or Hb SC patients and individuals with the sickle cell trait (Hb AS), respectively can be considered normal. In 2004, Head et al.7 confirmed the findings of Shokrani et al. and explained that the falsely elevated Hb A2 values were due to the presence of Hb S that had suffered post-translational modifications, and consequently had the same retention time as Hb A2. They also demonstrated that the degree of uncertainty directly correlated to the concentration of Hb S, which is higher in Hb SS patient samples than in samples from individuals with Hb AS. Additionally, they concluded that the percentage of Hb A2 is higher in Hb AS individuals with alpha thalassemia (AT) than in those without AT; and suggested that this occurs because the delta chains have greater affinity to alpha chains than the βS chains.7
More recently, studies using mass spectrometry have proposed that elevated Hb A2 values in samples with Hb S can be a consequence of the elution of smaller Hb components formed by a βS chain associated with an alpha-globin chain that was modified by carbamylation after translation.15
The interference of anomalous Hb in the quantification of Hb A2 is not limited to the presence of Hb S and Hb C, but can also be related to the presence of other beta chain variants such as Hb E, Hb D and Hb Lepore.16,17
In 2007, Ondei et al.,18 in an effort to establish reference values for the Brazilian population, used HPLC to analyze 136 samples with the Hb AS phenotype, 106 with AT and Hb AS, 18 with Hb SS and nine with Hb SC, and concluded that Hb A2 values of 2.9–5.2% for Hb AS, 2.8–5.2% for AT together with Hb AS, 0.8–5.6% for Hb SS and 3.8–5.7% for Hb SC should be considered normal.
Considering the widespread use of HPLC in the laboratory practice and the importance of an accurate diagnosis to define the type of sickle cell disease in order to facilitate better clinical and laboratory follow-up of these patients, the current study sought to verify the Hb A2 values as quantified by HPLC, in samples of patients with Hb S and Hb C, in the presence or absence of the α2-thalassemia 3.7kb deletion as both hemoglobinopathies may be prevalent in the same population.
MethodsStudy design and populationThis is a retrospective study conducted between June 2008 and June 2009 with an initial sample composed of 287 children. Forty-five were excluded: eight for presenting a diagnosis of Hb S/β-thalassemia, eleven for having been analyzed by HPLC after the transfusion of blood components, and 26 due to iron deficiency. This left a total of 242 children diagnosed with sickle cell anemia or Hb SC screened and followed at the Neonatal Screening Referral Service (SRTN) of the Associação de Pais e Amigos dos Excepcionais in Salvador (APAE/Salvador), Bahia, Brazil. The SRTN-APAE/Salvador is registered with the Brazilian Ministry of Health (Ordinance 822 – 06/06/2001) as a referral service in the state of Bahia, Brazil. This service diagnoses and follows up all newborns with sickle cell anemia in Bahia, the state with the highest incidence of this hemoglobinopathy in Brazil (one in 601 newborns/year).19
The objectives and procedures involved in the study were explained, and parents who agreed to participate signed an informed consent form. All parents of participating children were asymptomatic, and were subjected to a CBC, Hb profiling, and measurement of serum ferritin. All presented a laboratory profile compatible with heterozygosity for Hb S or Hb C and normal iron reserves.
Analyses and laboratory techniquesVenous blood samples were collected in 3.0-mL tubes containing 3.6mgK2-ethylenediaminetetraacetic acid (EDTA) as an anticoagulation agent and in a tube with a gel separator. The qualitative and quantitative Hb profiles were investigated by automated HPLC using the Variant Express apparatus and the β-thalassemia Short Program kit (Bio-Rad, California, USA).
Cation-exchange HPLC is a process in which a mixture of molecules (such as normal and variant Hbs) with a net positive charge is separated into its components by adsorption of molecules in a negatively charged stationary phase in a chromatography column, followed by their elution in a mobile phase. In the mobile phase a liquid with an increased concentration of cations flows through the column; the cations in the mobile phase compete with the adsorbed proteins for anionic binding sites. Thus, the adsorbed positively charged Hb molecules are eluted from the column into the liquid phase at a rate related to their affinity in the stationary phase. The different Hbs eluted from the column are represented graphically and automatically quantified. The result is a chromatogram with the percentage and retention time of each Hb fraction. The time of elution (retention time) of any normal or variant Hb present is compared with that of known Hbs providing quantification of normal Hbs (Hb A, Hb F, and Hb A2) and many variants. The most positively charged Hbs (e.g. Hb S and Hb C) have a longer retention time.20
Patient samples were considered to contain Hb S and/or Hb C when the chromatograms presented variants with retention times equivalent to these Hbs. As such, the diagnosis of sickle cell anemia was made only if Hb S, Hb F and Hb A2 were present, hemametric indices of the CBC were normal, and the parents presented normal CBCs with Hb profile consistent with sickle cell trait. The serum ferritin level was determined by chemoluminescence (ADVIA Centaur CP System, Siemens). Ferritin levels <12ng/mL were considered as iron deficient.21
The deletion of 3.7kb in AT was investigated by allele-specific polymerase chain reaction (PCR)22 and the participants were identified as heterozygotes (−α3.7/αα), homozygotes (−α3.7/−α3.7) or wild type (αα/αα).
Statistical analysisHb A2 concentrations were described according to the type of sickle cell disease (Hb SC or Hb SS) together with AT status (wild-type, heterozygous or homozygous) using central tendency analysis and dispersion. The Kolmogorov–Smirnov test was used for analysis of normal distribution. One-way analysis of variance (ANOVA) was used to analyze differences between groups, and two-way ANOVA was used to analyze the influence of the interaction and confounding factors between type of sickle cell anemia and presence of AT (independent variables) on Hb A2 levels (dependent variable). Post hoc analysis was performed using Tukey's Honestly Significant Difference (HSD) test and the Games–Howell test to identify situations in which equality of variance was verified. Due to the reduced size of the group with homozygous mutations, statistical significance was set at a p-value <0.01.
Hb A2 values were categorized in three groups based on standard reference values: (1) below 2.0%; (2) between 2.0 and 3.5%; and (3) above 3.5%. These categories were analyzed according to the AT data using the chi-squared tendency test. All data were analyzed using EPI INFO for Windows (version 3.5.1) and the Statistical Package for the Social Sciences (SPSS® – version 13.0).
Ethical considerationsThe present study was approved by the Ethics Committee for Research in Human Beings of the Gonçalo Moniz Research Center from the Oswaldo Cruz Foundation, Bahia (CEP-CPqGM/FIOCRUZ: protocol #112/2006) and followed the research ethics guidelines as defined in resolution 196/96 of the Helsinki declaration of 2008.
ResultsThe final cohort analyzed consisted of 242 patients (107 Hb SC and 135 Hb SS) aged from two to six years with an average age of 3.05 years (±1.01), and median (p25–p75) of 4 (3.0–5.0) years.
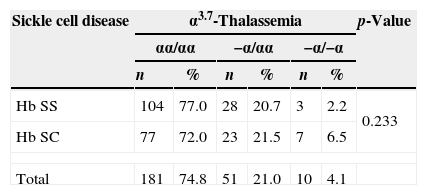
The distribution of α3.7-thalassemia is described in Table 1. There was no significant difference between the distribution of heterozygous or homozygous AT between the two types of hemoglobinopathies (Hb SS and Hb SC) (χ2=2.917; p-value=0.233).
Distribution of α3.7-thalassemia in 242 children with sickle cell disease.
| Sickle cell disease | α3.7-Thalassemia | p-Value | |||||
|---|---|---|---|---|---|---|---|
| αα/αα | −α/αα | −α/−α | |||||
| n | % | n | % | n | % | ||
| Hb SS | 104 | 77.0 | 28 | 20.7 | 3 | 2.2 | 0.233 |
| Hb SC | 77 | 72.0 | 23 | 21.5 | 7 | 6.5 | |
| Total | 181 | 74.8 | 51 | 21.0 | 10 | 4.1 | |
Hb SS: sickle cell anemia; Hb SC: SC hemoglobinopathy.
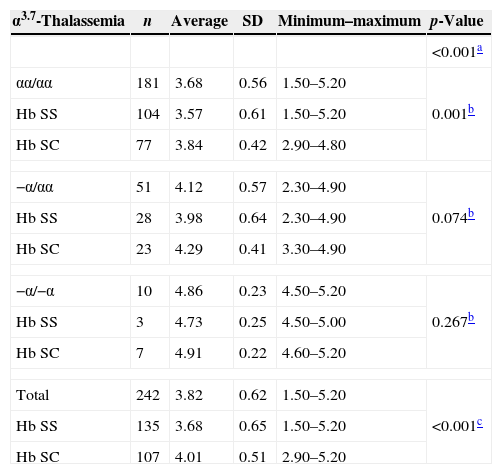
The mean Hb A2 level in Hb SS samples independently of the presence of AT (n=135) was 3.68% (±0.65); in Hb SS samples with heterozygous AT (n=28) it was 3.98% (±0.64) and in Hb SS samples with homozygous AT (n=3) it was 4.73% (±0.25). The mean Hb A2 in all Hb SC samples (n=107) was 4.01% (±0.50); in Hb SC samples with heterozygous AT (n=23) it was 4.29% (±0.41), and in Hb SC samples with homozygous AT (n=7) it was 4.91% (±0.22).
With regard to the mean Hb A2 values and the sickle cell disease type (Hb SS or Hb SC), significantly higher overall values were observed in patients with Hb SC compared to Hb SS (p-value <0.001) as shown in Table 2. When the data were stratified according to the AT status (wild type, heterozygous or homozygous), a significant difference was observed only when samples without AT were compared. Values were not significant for heterozygous (Hb SC: 4.29±0.41% versus Hb SS: 3.98±0.64%; p-value=0.074), or for homozygous AT mutation (Hb SC: 4.91±0.22% versus Hb SS: 4.73±0.25%; p-value=0.267 – Table 2).
Mean, standard deviation, maximum and minimum values for Hb A2 in 242 children according to the presence of α3.7-thalassemia, stratified by type of sickle cell disease.
| α3.7-Thalassemia | n | Average | SD | Minimum–maximum | p-Value |
|---|---|---|---|---|---|
| <0.001a | |||||
| αα/αα | 181 | 3.68 | 0.56 | 1.50–5.20 | 0.001b |
| Hb SS | 104 | 3.57 | 0.61 | 1.50–5.20 | |
| Hb SC | 77 | 3.84 | 0.42 | 2.90–4.80 | |
| −α/αα | 51 | 4.12 | 0.57 | 2.30–4.90 | 0.074b |
| Hb SS | 28 | 3.98 | 0.64 | 2.30–4.90 | |
| Hb SC | 23 | 4.29 | 0.41 | 3.30–4.90 | |
| −α/−α | 10 | 4.86 | 0.23 | 4.50–5.20 | 0.267b |
| Hb SS | 3 | 4.73 | 0.25 | 4.50–5.00 | |
| Hb SC | 7 | 4.91 | 0.22 | 4.60–5.20 | |
| Total | 242 | 3.82 | 0.62 | 1.50–5.20 | <0.001c |
| Hb SS | 135 | 3.68 | 0.65 | 1.50–5.20 | |
| Hb SC | 107 | 4.01 | 0.51 | 2.90–5.20 | |
SD: standard deviation; Hb SS: sickle cell anemia; Hb SC: SC hemoglobinopathy.
Comparison of average Hb A2 values according to presence of α3.7-thalassemia (wild-type, heterozygous and homozygous) independently of type of hemoglobinopathy – non-parametric Kruskal–Wallis test.
When comparing groups according to AT status only (wild-type, heterozygous or homozygous), higher mean values were observed for Hb A2 in patients with the −α/−α genotype (F=30.985; p-value <0.001 – Table 2).
The analysis of the interaction between the type of sickle cell disease and AT genotype was carried out after the difference between the average Hb A2 values for Hb SS and Hb SC was found to be significant. There was no significant interaction (F=0.583; p-value=0.559) or influence of the type of hemoglobinopathy (F=2.156; p-value=0.43) on the mean Hb A2 values. Only the AT genotype influenced the variation of the mean Hb A2 values (F=28.676; p-value <0.001). The post hoc analysis indicated a significant difference between the three AT genotype groups, showing a progressive increase in Hb A2 levels (Figure 1).
 according to α3.7-thalassemia genotype and sickle cell type (Hb SS/Hb SC) in 242 children.")
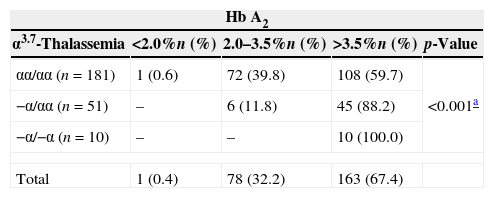
Using the reference Hb A2 values described by Ondei et al. in 2007,18 it was observed that all homozygous mutant samples had elevated Hb A2 levels (above 3.5%), and a tendency for increases in the percentage of children with Hb A2 levels above 3.5% from the wild-type (59.7%) to the heterozygous (88.2%) and the homozygous (100%) samples (χ2linear tendency=18.871; p-valuetendency<0.001), as shown in Table 3.
Proportion of Hb A2 above 3.5% found in 242 according to the presence of α3.7-thalassemia.
| Hb A2 | ||||
|---|---|---|---|---|
| α3.7-Thalassemia | <2.0%n (%) | 2.0–3.5%n (%) | >3.5%n (%) | p-Value |
| αα/αα (n=181) | 1 (0.6) | 72 (39.8) | 108 (59.7) | <0.001a |
| −α/αα (n=51) | – | 6 (11.8) | 45 (88.2) | |
| −α/−α (n=10) | – | – | 10 (100.0) | |
| Total | 1 (0.4) | 78 (32.2) | 163 (67.4) | |
Hb disorders are recognized as one of the most common inherited diseases worldwide. Among the hemoglobinopathies, sickle cell disease and β-thalassemia have the greatest impact on morbidity and mortality, affecting millions of individuals worldwide.5
Sickle cell disease should be considered as both a qualitative and quantitative genetic disorder in that it is caused by the presence of an abnormal Hb variant – Hb S. Homozygosity for Hb S or sickle cell anemia is the most common genotype; the other causative genotypes include compound heterozygous states of Hb S with Hb C (Hb SC) or β-thalassemia variants (Hb S/β0-thalassemia and Hb S/β+-thalassemia).5
Diagnosis of specific sickle cell diseases is accomplished by integrating clinical and hematological parameters along with laboratory Hb analysis. Combining these elements to properly diagnose Hb disorders is essential for the treatment of anemia, primary prevention and genetic counseling for underlying disorders. In the majority of patients, the presence of a hemoglobinopathy can be diagnosed with sufficient accuracy for clinical purposes from knowledge of the patient's ethnical background and clinical history (including family history) and the results of the physical examination combined with relatively simple blood tests. Initial investigations should include determination of Hb concentration and red cell indices. A detailed examination of a well-stained blood film should be carried out. Other important basic tests are Hb electrophoresis or chromatography, and the measurement of Hb A2 and Hb F.23 Automated HPLC, by analyzing large numbers of samples, is increasingly replacing Hb electrophoresis as the initial investigative procedure in laboratories.18,23
While HPLC is considered a method that permits rapid and precise detection of Hb variants, as well as sensitive quantification of Hb A2,9 over the last two decades various authors have reported the occurrence of falsely elevated Hb A2 in screening for Hb variants (Hb S, Hb C, Hb D, Hb E and Hb Lepore) and for AT. Some of these authors have cautioned about the risk of interpretation errors and the false diagnosis of Hb S/β0- thalassemia.7,10,13,14,16–18,24–26
Accurate diagnosis of Hb disorders is essential in sickle cell syndromes. Considering the clinical importance of Hb A1 and Hb A2 and/or Hb F together with clinical and laboratory data for the diagnosis of Hb S/β-thalassemia, this study analyzed Hb A2 values by HPLC in conjunction with Hb S and Hb C, and AT, in a population with a low estimated frequency of β-thalassemia.27,28 Similar to results observed in previous studies,7,10,13,14,16–18,24–26 the Hb A2 values obtained by HPLC were increased in Hb SS and Hb SC patient samples.
α2-Thalassemia was diagnosed in 23.4% of the children with sickle cell disease, a result that agrees with previous studies performed in the population of the state of Bahia, Brazil.29,30 Thus, as Suh et al.13 and Ondei et al.18 stated, the presence of AT has an impact on the value of Hb A2 as quantified by HPLC and additionally, in the present study, significant differences in the mean levels of Hb A2 were observed according to the presence of α3.7-thalassemia, with a gradual increase in this Hb fraction between the three groups: wild type to heterozygous to homozygous.
Several studies in recent years9–12 have sought to compare different methodologies and systems in order to identify processes in which the presence of anomalous Hbs have the least effect on the measurement of Hb A2 in order to reach a more accurate diagnosis. However, studies seeking to explain how the presence of these Hbs and AT may result in false Hb A2 levels are extremely scarce. Even the most recent publications, such as that of Greene et al. in 20155 seem to agree with Suh et al. from 199613 in attributing the apparent increase in Hb A2 as quantified by HPLC in samples containing Hb structural variants to the presence of glycosylated fractions of anomalous Hb (such as Hb S1c) that co-elute with Hb A2.10,14,17,23
On comparing the impact of the type of Hb variant on the measurement of Hb A2, the greatest impact was caused by the presence of AT, and not by Hb S or Hb C. Head et al. 7 defended that the increased Hb A2 levels observed in the association of sickle cell disease with AT are explainable in that with a lower number of alpha chains being produced, these positively charged molecules combine with other chains for which they have great affinity, namely the delta chains.
The prevalence of β-thalassemia is very low in the studied population,27,28 and a careful hematological study of the parents showed normal erythrograms and the presence of Hb S and Hb A consistent with heterozygosity for Hb S. Given these facts, we consider that the Hb A2 values seen in the patients were falsely elevated due to interference of the methodology used in the presence of structural Hb variants and AT, and as such the patients can be diagnosed as having sickle cell anemia, and not Hb S/β0-thalassemia, even though we recognize a limitation by the fact that we did not perform molecular analyses to conclusively exclude the diagnosis of β-thalassemia. We suggest that in cases with a possible diagnosis of Hb S/β0 thalassemia, the Hb profile should not be performed by HPLC, or that if used, this method should be complemented by a second confirmatory test. Furthermore, when doubts still remain, a molecular analysis should be carried out to identify deletions or other mutations, in order to confirm the clinical diagnosis and guide genetic counseling.5
ConclusionWe conclude that the Hb A2 levels in samples containing Hb S and/or Hb C can be overestimated when analyzed by HPLC, especially in the presence of AT, and that in these situations the reference values of up to 3.5% should not be used. We reinforce the importance of multi-center studies when establishing patterns, the need for individual evaluations of cases in order to reach a differential diagnosis between sickle cell syndromes, especially in regions with a high prevalence of the different types of hemoglobinopathies, and the use of molecular biology studies to clarify any doubts.
FundingCentro Nacional de Desenvolvimento Científico e Tecnológico (CNPq).
Conflicts of interestThe authors declare no conflicts of interest.

