
Different hematological analyzers have different analytical performances that are often reflected in the criteria for sample stability of the complete blood count. This study aimed to assess the stability of several hematological parameters using the XN-9000 Sysmex and BC-6800 Mindray analyzers.
MethodsThe impact of storage at room temperature and 4°C was evaluated after 2, 4, 6, 8, 24, 36 and 48h using ten normal and 40 abnormal blood samples. The variation from the baseline measurement was evaluated by the Steel–Dwass–Critchlow–Fligner test and by Bland–Altman plots, using quality specifications and critical difference as the total allowable variation.
ResultsRed blood cells and reticulocyte parameters (i.e. hematocrit, mean corpuscular volume, mean corpuscular hemoglobin concentration, red blood cell distribution width, immature reticulocyte fractions, low-fluorescence reticulocytes, middle-fluorescence reticulocytes, high fluorescence mononuclear cells) showed less stability compared to leukocyte and platelet parameters (except for monocyte count and mean platelet volume). The bias for hematocrit, mean corpuscular volume, mean corpuscular hemoglobin concentration and red blood cell distribution width coefficient of variation was higher than the critical difference after 8h using both analyzers.
ConclusionBlood samples measured with both analyzers do not show analytically significant changes in up to 2h of storage at room temperature and 4°C. However, the maximum time for analysis can be extended for up to 8h when the bias is compared to the critical difference.
Modern hematological analyzers not only enable accurate quantitative and qualitative assessment of blood cells, but also provide a vast array of hematological parameters that may be useful for the diagnostic and prognostic assessment of many blood cell disorders. The vast majority of laboratory errors (up to 70%) emerge from the pre-analytical phase.1 This phase is influenced by a number of variables, including the preparation of the patient before testing, the procedures used to collect and transport the biological specimens, as well as the time and storage conditions of blood samples before analysis. In particular, it was recently proven that the stability of many hematological parameters is strongly influenced by the storage temperature of the sample and the time elapsed between collection and analysis.2–4
Another factor that may have an influence on the stability of hematological parameters is the technology used by the different hematological analyzers.3 Basically, the instruments currently available on the market use different methods and technologies to assess basic parameters such as red blood cell (RBC), platelet (PLT), total leukocyte (WBC) and leukocyte subclass [neutrophils (NE), lymphocytes (LY), monocytes (MO), eosinophils (EO), basophils (BA)] counts.5 It is for this reason that a more profound knowledge of the potential impact of time and storage temperature of samples before analysis should be regarded as a mainstay to increase the quality of hematological testing and to improve the clinical interpretation of data obtained with different analyzers and techniques.2–4 Notably, the latest generation of hematological analyzers provides a number of innovative quantitative and qualitative parameters, such as the enumeration of high fluorescence mononuclear cells (HFC)5–7 and nucleated red blood cell (NRBC) count,7 and the RBC distribution width expressed as a standard deviation (RDW-SD) or coefficient of variation (RDW-CV).8 Moreover, they may provide platelet distribution width (PDW), plateletcrit (PCT), mean platelet volume (MPV), percentage of large platelet (P-LCR) parameters,5,9,10 along with the reticulocyte count (RET) and immature reticulocyte fractions [IRF, high-fluorescence (HFR), middle-fluorescence (MFR) and low-fluorescence reticulocytes (LFR)], all of which are useful for the diagnosis and classification of anemia or for monitoring bone marrow erythropoiesis.11,12
The importance of verifying the stability of the aforementioned parameters is now unquestionable and published data about blood sample stability before analysis is scarce for the new generation of hematological analyzers. Therefore, this study aimed to assess and compare the stability of a number of hematological parameters in normal and abnormal blood samples measured using two novel analyzers, XN-9000 (Sysmex Co., Kobe, Japan) and BC-6800 (Mindray, Shenzhen, China), according to the Guidelines of the International Council for Standardization of Haematology (ICSH)4 and the Clinical and Laboratory Standards Institute (CLSI) Document H26-P2.13
Blood samplesThe study population consisted of ten adult and ostensibly healthy volunteers recruited from the laboratory staff (five women, mean age 37.5±0.8 years and five males, mean age 35.0±7.4 years). All subjects were Caucasian, had no diabetes mellitus, hypertension and had not taken any medication for one month before the study. Six venous blood samples from each subject were collected in K3-ethylenediaminetetraacetic acid (K3-EDTA) tubes (Becton Dickinson, Franklin Lakes, NJ). All samples were analyzed immediately after venipuncture (i.e., within 30min). The analysis of the impact of different storage temperatures was then carried out by storing three blood tubes from each individual at room temperature (RT) and three blood tubes were divided in six aliquots and stored (refrigerated) at 4°C. Repeated measures were then performed on each sample after 2h, 4h, 6h, 8h, 24h, 36h and 48h of storage. An additional study was performed using 40 routine samples with abnormal values, that is, containing at least one abnormality of hemoglobin (Hb), platelet (PLT) or white blood cell (WBC) counts or morphological alterations (i.e., at least one morphological flag for WBC). Count abnormalities included Hb lower than 70g/dL, PLT lower than 100×109/L or higher than 400×109/L; WBC lower than 1.00×10⁹/L or higher than 12.00×10⁹/L. Hematological testing was performed immediately upon arrival in the laboratory (i.e., within 30min) and then each sample was divided into 8 aliquots, four were stored at 4°C and four were stored at RT. The tests were repeated after 4h, 8h, 24h 36h and 48h of storage. All measures (i.e., the baseline and the repeated analyses) were performed in duplicate and the final value was expressed as the mean of the two analyses at each time point.
Study designThe following parameters were assessed to check blood sample stability: extended complete blood count (CBC) profile parameters, including all basic CBC parameters [RBC, Hb, hematocrit (HT)], mean corpuscular volume (MCV), mean corpuscular hemoglobin (MCH), mean corpuscular hemoglobin concentration (MCHC), RDW-SD, RDW-CV and NRBC. Moreover, the extended differential counts (DIFF) (including WBC, NE, LY, MO, EO, BA and HFC), PLT profile parameters (including PLT, PCT, MPV, PDW and P-LCR) and the RET profile (including RET, IRF, LFR, MFR and HFR) were evaluated.
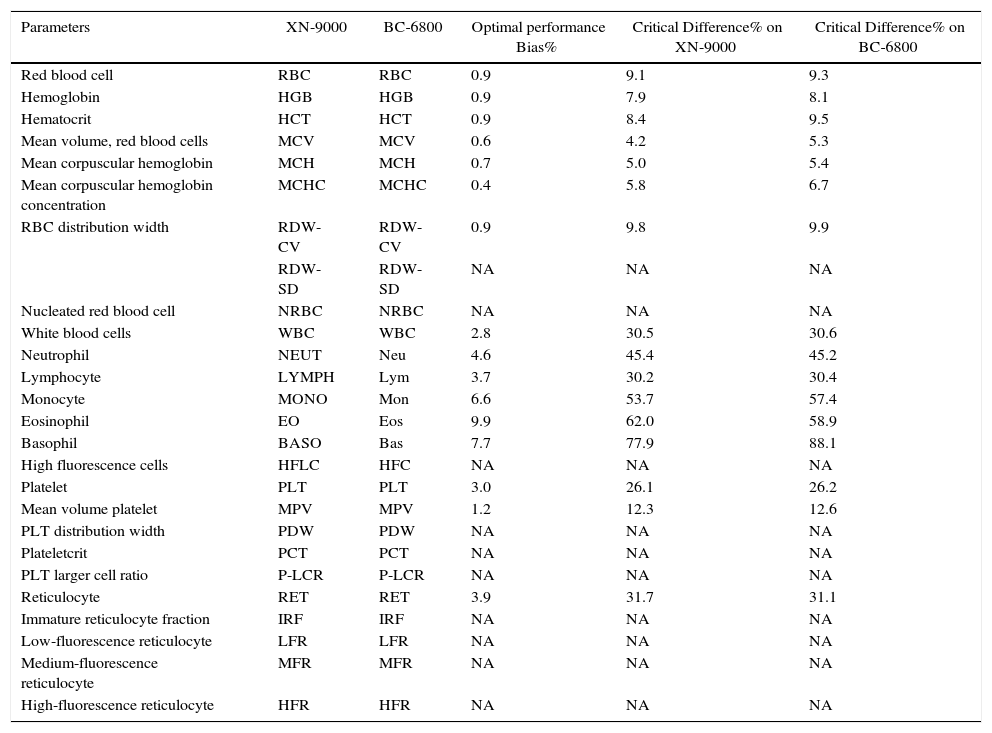
The measurements at the different time points were concomitantly performed with both the XN-9000 and BC-6800 analyzers. The mean analytical characteristics of the two analyzers are summarized in Table 1. Briefly, the XN-9000 and the BC-6000 analyzers perform a 5-part DIFF, RET count, NRBC count, with flags appearing in the presence of abnormal results.7,14,15 Both analyzers use a combination of flow cytometry and fluorescence with lysing buffers for leukocyte DIFF and identification of abnormal cells. A separate channel for NRBC assessment is also available in the BC-6800.
XN-9000 and BC-6800 parameters with optimal performance Bias% and Critical Difference% (CD).
| Parameters | XN-9000 | BC-6800 | Optimal performance Bias% | Critical Difference% on XN-9000 | Critical Difference% on BC-6800 |
|---|---|---|---|---|---|
| Red blood cell | RBC | RBC | 0.9 | 9.1 | 9.3 |
| Hemoglobin | HGB | HGB | 0.9 | 7.9 | 8.1 |
| Hematocrit | HCT | HCT | 0.9 | 8.4 | 9.5 |
| Mean volume, red blood cells | MCV | MCV | 0.6 | 4.2 | 5.3 |
| Mean corpuscular hemoglobin | MCH | MCH | 0.7 | 5.0 | 5.4 |
| Mean corpuscular hemoglobin concentration | MCHC | MCHC | 0.4 | 5.8 | 6.7 |
| RBC distribution width | RDW-CV | RDW-CV | 0.9 | 9.8 | 9.9 |
| RDW-SD | RDW-SD | NA | NA | NA | |
| Nucleated red blood cell | NRBC | NRBC | NA | NA | NA |
| White blood cells | WBC | WBC | 2.8 | 30.5 | 30.6 |
| Neutrophil | NEUT | Neu | 4.6 | 45.4 | 45.2 |
| Lymphocyte | LYMPH | Lym | 3.7 | 30.2 | 30.4 |
| Monocyte | MONO | Mon | 6.6 | 53.7 | 57.4 |
| Eosinophil | EO | Eos | 9.9 | 62.0 | 58.9 |
| Basophil | BASO | Bas | 7.7 | 77.9 | 88.1 |
| High fluorescence cells | HFLC | HFC | NA | NA | NA |
| Platelet | PLT | PLT | 3.0 | 26.1 | 26.2 |
| Mean volume platelet | MPV | MPV | 1.2 | 12.3 | 12.6 |
| PLT distribution width | PDW | PDW | NA | NA | NA |
| Plateletcrit | PCT | PCT | NA | NA | NA |
| PLT larger cell ratio | P-LCR | P-LCR | NA | NA | NA |
| Reticulocyte | RET | RET | 3.9 | 31.7 | 31.1 |
| Immature reticulocyte fraction | IRF | IRF | NA | NA | NA |
| Low-fluorescence reticulocyte | LFR | LFR | NA | NA | NA |
| Medium-fluorescence reticulocyte | MFR | MFR | NA | NA | NA |
| High-fluorescence reticulocyte | HFR | HFR | NA | NA | NA |
NA: not available.
The between-run imprecision of both the XN-9000 and BC-6800 was evaluated according to the CLSI document EP5-A3,16 by analysis in duplicate of three levels (i.e., level 1, 2 and 3) of control materials (XN-CHECK; Streck Laboratories Inc., Omaha, NE, USA and BC-6D, BC-BC-RET and NRBC; Shenzhen Mindray Bio-Medical Electronics, Shenzhen, China) for 40 consecutive working days. The study was carried out in accord with the Declaration of Helsinki, under the terms of all relevant local legislation and with prior approval of the Local Ethics Committee.
Statistical analysisThe significance of the difference of the parameters obtained in paired samples measured with the two analyzers was estimated according to the Steel–Dwass–Critchlow–Fligner test, with assessment by the Hodges–Lehmann location shift for multiple comparisons of means and medians between different groups, after verification of value distribution by the Shapiro–Wilk test. Statistical significance was set for p-values <0.05. The results were then reported as delta variations from baseline analysis immediately after collection, as ΔX (TX−T0), where “X” is the different timing and “0” is the baseline result. Percentage variations from the baseline result (T0) in samples with statistically significant differences were then analyzed using Bland–Altman plots (Bias%) and compared with the current quality specifications for optimal bias (OP-Bias%),17 that is calculated using intra-individual biological variability (CVi) and inter-individual biological variability (CVg) following the equation: OP-Bias%=0.250 (CVi+CVg)1/2. Bias% was also compared with the reference change values or critical difference (CD)18,19 when these indices were available. The CD percentage is the highest relative difference between two consecutive measurements, that, at a chosen level of probability, may still be due to the combined effect of the analytical (Va) and biological (Vi) variations. It is given by the following equation: CD%=K×(Va2+Vi2)1/2, where K depends on the chosen probability. The comparison between Bias% and CD% was performed only for those parameters exhibiting a statistically significant difference between Bias% and OP-Bias% throughout the study period. The statistical analysis was performed using Analyse-it software version 3.90.1 (Analyse-it Software Ltd.; Leeds, UK).
ResultsOverall, 2480 measurements were performed with the XN-9000 and BC-6800 analyzers. All results obtained in the normal samples group were included in the statistical analysis, whereas 160 measurements were performed in the abnormal samples group. Unfortunately, several measurements could not be performed due to the low residual sample volume in this second group of samples. The results of these studies and the relative variations according to the different storage conditions are shown in Tables 2–5.
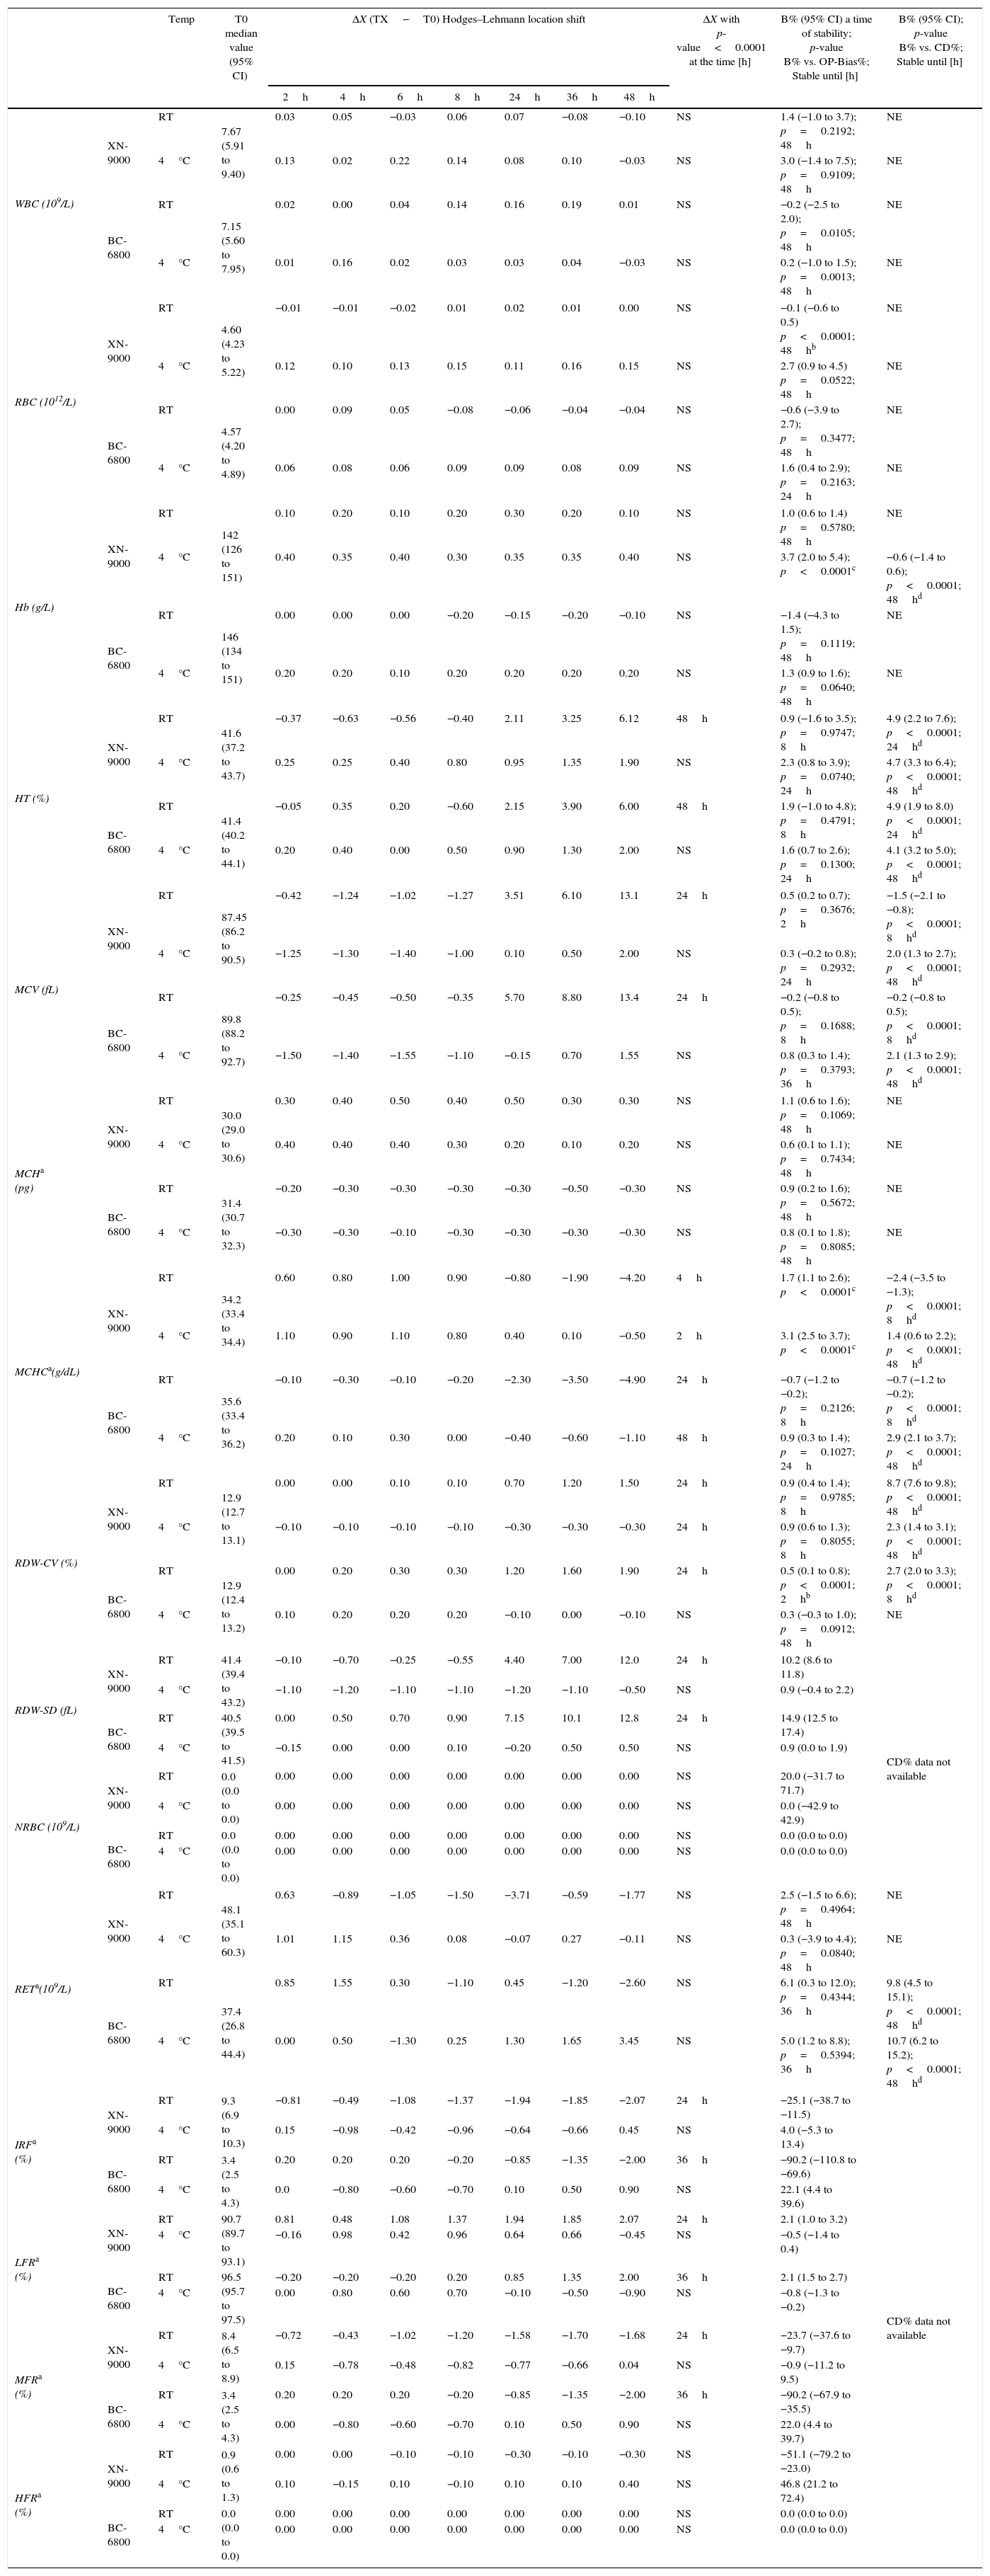
Samples stability of group of normal samples for CBC and RET profiles parameters. Median Hodges–Lehmann location shift (ΔX); Bias% (B%) between baseline (T0) and the time point (2h up to 48h) at 4°C and room temperature (RT) comparison of OP-Bias% to Critical Difference % (CD).
| Temp | T0 median value (95% CI) | ΔX (TX−T0) Hodges–Lehmann location shift | ΔX with p-value<0.0001 at the time [h] | B% (95% CI) a time of stability; p-value B% vs. OP-Bias%; Stable until [h] | B% (95% CI); p-value B% vs. CD%; Stable until [h] | ||||||||
|---|---|---|---|---|---|---|---|---|---|---|---|---|---|
| 2h | 4h | 6h | 8h | 24h | 36h | 48h | |||||||
| WBC (109/L) | XN-9000 | RT | 7.67 (5.91 to 9.40) | 0.03 | 0.05 | −0.03 | 0.06 | 0.07 | −0.08 | −0.10 | NS | 1.4 (−1.0 to 3.7); p=0.2192; 48h | NE |
| 4°C | 0.13 | 0.02 | 0.22 | 0.14 | 0.08 | 0.10 | −0.03 | NS | 3.0 (−1.4 to 7.5); p=0.9109; 48h | NE | |||
| BC-6800 | RT | 7.15 (5.60 to 7.95) | 0.02 | 0.00 | 0.04 | 0.14 | 0.16 | 0.19 | 0.01 | NS | −0.2 (−2.5 to 2.0); p=0.0105; 48h | NE | |
| 4°C | 0.01 | 0.16 | 0.02 | 0.03 | 0.03 | 0.04 | −0.03 | NS | 0.2 (−1.0 to 1.5); p=0.0013; 48h | NE | |||
| RBC (1012/L) | XN-9000 | RT | 4.60 (4.23 to 5.22) | −0.01 | −0.01 | −0.02 | 0.01 | 0.02 | 0.01 | 0.00 | NS | −0.1 (−0.6 to 0.5) p<0.0001; 48hb | NE |
| 4°C | 0.12 | 0.10 | 0.13 | 0.15 | 0.11 | 0.16 | 0.15 | NS | 2.7 (0.9 to 4.5) p=0.0522; 48h | NE | |||
| BC-6800 | RT | 4.57 (4.20 to 4.89) | 0.00 | 0.09 | 0.05 | −0.08 | −0.06 | −0.04 | −0.04 | NS | −0.6 (−3.9 to 2.7); p=0.3477; 48h | NE | |
| 4°C | 0.06 | 0.08 | 0.06 | 0.09 | 0.09 | 0.08 | 0.09 | NS | 1.6 (0.4 to 2.9); p=0.2163; 24h | NE | |||
| Hb (g/L) | XN-9000 | RT | 142 (126 to 151) | 0.10 | 0.20 | 0.10 | 0.20 | 0.30 | 0.20 | 0.10 | NS | 1.0 (0.6 to 1.4) p=0.5780; 48h | NE |
| 4°C | 0.40 | 0.35 | 0.40 | 0.30 | 0.35 | 0.35 | 0.40 | NS | 3.7 (2.0 to 5.4); p<0.0001c | −0.6 (−1.4 to 0.6); p<0.0001; 48hd | |||
| BC-6800 | RT | 146 (134 to 151) | 0.00 | 0.00 | 0.00 | −0.20 | −0.15 | −0.20 | −0.10 | NS | −1.4 (−4.3 to 1.5); p=0.1119; 48h | NE | |
| 4°C | 0.20 | 0.20 | 0.10 | 0.20 | 0.20 | 0.20 | 0.20 | NS | 1.3 (0.9 to 1.6); p=0.0640; 48h | NE | |||
| HT (%) | XN-9000 | RT | 41.6 (37.2 to 43.7) | −0.37 | −0.63 | −0.56 | −0.40 | 2.11 | 3.25 | 6.12 | 48h | 0.9 (−1.6 to 3.5); p=0.9747; 8h | 4.9 (2.2 to 7.6); p<0.0001; 24hd |
| 4°C | 0.25 | 0.25 | 0.40 | 0.80 | 0.95 | 1.35 | 1.90 | NS | 2.3 (0.8 to 3.9); p=0.0740; 24h | 4.7 (3.3 to 6.4); p<0.0001; 48hd | |||
| BC-6800 | RT | 41.4 (40.2 to 44.1) | −0.05 | 0.35 | 0.20 | −0.60 | 2.15 | 3.90 | 6.00 | 48h | 1.9 (−1.0 to 4.8); p=0.4791; 8h | 4.9 (1.9 to 8.0) p<0.0001; 24hd | |
| 4°C | 0.20 | 0.40 | 0.00 | 0.50 | 0.90 | 1.30 | 2.00 | NS | 1.6 (0.7 to 2.6); p=0.1300; 24h | 4.1 (3.2 to 5.0); p<0.0001; 48hd | |||
| MCV (fL) | XN-9000 | RT | 87.45 (86.2 to 90.5) | −0.42 | −1.24 | −1.02 | −1.27 | 3.51 | 6.10 | 13.1 | 24h | 0.5 (0.2 to 0.7); p=0.3676; 2h | −1.5 (−2.1 to −0.8); p<0.0001; 8hd |
| 4°C | −1.25 | −1.30 | −1.40 | −1.00 | 0.10 | 0.50 | 2.00 | NS | 0.3 (−0.2 to 0.8); p=0.2932; 24h | 2.0 (1.3 to 2.7); p<0.0001; 48hd | |||
| BC-6800 | RT | 89.8 (88.2 to 92.7) | −0.25 | −0.45 | −0.50 | −0.35 | 5.70 | 8.80 | 13.4 | 24h | −0.2 (−0.8 to 0.5); p=0.1688; 8h | −0.2 (−0.8 to 0.5); p<0.0001; 8hd | |
| 4°C | −1.50 | −1.40 | −1.55 | −1.10 | −0.15 | 0.70 | 1.55 | NS | 0.8 (0.3 to 1.4); p=0.3793; 36h | 2.1 (1.3 to 2.9); p<0.0001; 48hd | |||
| MCHa (pg) | XN-9000 | RT | 30.0 (29.0 to 30.6) | 0.30 | 0.40 | 0.50 | 0.40 | 0.50 | 0.30 | 0.30 | NS | 1.1 (0.6 to 1.6); p=0.1069; 48h | NE |
| 4°C | 0.40 | 0.40 | 0.40 | 0.30 | 0.20 | 0.10 | 0.20 | NS | 0.6 (0.1 to 1.1); p=0.7434; 48h | NE | |||
| BC-6800 | RT | 31.4 (30.7 to 32.3) | −0.20 | −0.30 | −0.30 | −0.30 | −0.30 | −0.50 | −0.30 | NS | 0.9 (0.2 to 1.6); p=0.5672; 48h | NE | |
| 4°C | −0.30 | −0.30 | −0.10 | −0.30 | −0.30 | −0.30 | −0.30 | NS | 0.8 (0.1 to 1.8); p=0.8085; 48h | NE | |||
| MCHCa(g/dL) | XN-9000 | RT | 34.2 (33.4 to 34.4) | 0.60 | 0.80 | 1.00 | 0.90 | −0.80 | −1.90 | −4.20 | 4h | 1.7 (1.1 to 2.6); p<0.0001c | −2.4 (−3.5 to −1.3); p<0.0001; 8hd |
| 4°C | 1.10 | 0.90 | 1.10 | 0.80 | 0.40 | 0.10 | −0.50 | 2h | 3.1 (2.5 to 3.7); p<0.0001c | 1.4 (0.6 to 2.2); p<0.0001; 48hd | |||
| BC-6800 | RT | 35.6 (33.4 to 36.2) | −0.10 | −0.30 | −0.10 | −0.20 | −2.30 | −3.50 | −4.90 | 24h | −0.7 (−1.2 to −0.2); p=0.2126; 8h | −0.7 (−1.2 to −0.2); p<0.0001; 8hd | |
| 4°C | 0.20 | 0.10 | 0.30 | 0.00 | −0.40 | −0.60 | −1.10 | 48h | 0.9 (0.3 to 1.4); p=0.1027; 24h | 2.9 (2.1 to 3.7); p<0.0001; 48hd | |||
| RDW-CV (%) | XN-9000 | RT | 12.9 (12.7 to 13.1) | 0.00 | 0.00 | 0.10 | 0.10 | 0.70 | 1.20 | 1.50 | 24h | 0.9 (0.4 to 1.4); p=0.9785; 8h | 8.7 (7.6 to 9.8); p<0.0001; 48hd |
| 4°C | −0.10 | −0.10 | −0.10 | −0.10 | −0.30 | −0.30 | −0.30 | 24h | 0.9 (0.6 to 1.3); p=0.8055; 8h | 2.3 (1.4 to 3.1); p<0.0001; 48hd | |||
| BC-6800 | RT | 12.9 (12.4 to 13.2) | 0.00 | 0.20 | 0.30 | 0.30 | 1.20 | 1.60 | 1.90 | 24h | 0.5 (0.1 to 0.8); p<0.0001; 2hb | 2.7 (2.0 to 3.3); p<0.0001; 8hd | |
| 4°C | 0.10 | 0.20 | 0.20 | 0.20 | −0.10 | 0.00 | −0.10 | NS | 0.3 (−0.3 to 1.0); p=0.0912; 48h | NE | |||
| RDW-SD (fL) | XN-9000 | RT | 41.4 (39.4 to 43.2) | −0.10 | −0.70 | −0.25 | −0.55 | 4.40 | 7.00 | 12.0 | 24h | 10.2 (8.6 to 11.8) | CD% data not available |
| 4°C | −1.10 | −1.20 | −1.10 | −1.10 | −1.20 | −1.10 | −0.50 | NS | 0.9 (−0.4 to 2.2) | ||||
| BC-6800 | RT | 40.5 (39.5 to 41.5) | 0.00 | 0.50 | 0.70 | 0.90 | 7.15 | 10.1 | 12.8 | 24h | 14.9 (12.5 to 17.4) | ||
| 4°C | −0.15 | 0.00 | 0.00 | 0.10 | −0.20 | 0.50 | 0.50 | NS | 0.9 (0.0 to 1.9) | ||||
| NRBC (109/L) | XN-9000 | RT | 0.0 (0.0 to 0.0) | 0.00 | 0.00 | 0.00 | 0.00 | 0.00 | 0.00 | 0.00 | NS | 20.0 (−31.7 to 71.7) | |
| 4°C | 0.00 | 0.00 | 0.00 | 0.00 | 0.00 | 0.00 | 0.00 | NS | 0.0 (−42.9 to 42.9) | ||||
| BC-6800 | RT | 0.0 (0.0 to 0.0) | 0.00 | 0.00 | 0.00 | 0.00 | 0.00 | 0.00 | 0.00 | NS | 0.0 (0.0 to 0.0) | ||
| 4°C | 0.00 | 0.00 | 0.00 | 0.00 | 0.00 | 0.00 | 0.00 | NS | 0.0 (0.0 to 0.0) | ||||
| RETa(109/L) | XN-9000 | RT | 48.1 (35.1 to 60.3) | 0.63 | −0.89 | −1.05 | −1.50 | −3.71 | −0.59 | −1.77 | NS | 2.5 (−1.5 to 6.6); p=0.4964; 48h | NE |
| 4°C | 1.01 | 1.15 | 0.36 | 0.08 | −0.07 | 0.27 | −0.11 | NS | 0.3 (−3.9 to 4.4); p=0.0840; 48h | NE | |||
| BC-6800 | RT | 37.4 (26.8 to 44.4) | 0.85 | 1.55 | 0.30 | −1.10 | 0.45 | −1.20 | −2.60 | NS | 6.1 (0.3 to 12.0); p=0.4344; 36h | 9.8 (4.5 to 15.1); p<0.0001; 48hd | |
| 4°C | 0.00 | 0.50 | −1.30 | 0.25 | 1.30 | 1.65 | 3.45 | NS | 5.0 (1.2 to 8.8); p=0.5394; 36h | 10.7 (6.2 to 15.2); p<0.0001; 48hd | |||
| IRFa (%) | XN-9000 | RT | 9.3 (6.9 to 10.3) | −0.81 | −0.49 | −1.08 | −1.37 | −1.94 | −1.85 | −2.07 | 24h | −25.1 (−38.7 to −11.5) | CD% data not available |
| 4°C | 0.15 | −0.98 | −0.42 | −0.96 | −0.64 | −0.66 | 0.45 | NS | 4.0 (−5.3 to 13.4) | ||||
| BC-6800 | RT | 3.4 (2.5 to 4.3) | 0.20 | 0.20 | 0.20 | −0.20 | −0.85 | −1.35 | −2.00 | 36h | −90.2 (−110.8 to −69.6) | ||
| 4°C | 0.0 | −0.80 | −0.60 | −0.70 | 0.10 | 0.50 | 0.90 | NS | 22.1 (4.4 to 39.6) | ||||
| LFRa (%) | XN-9000 | RT | 90.7 (89.7 to 93.1) | 0.81 | 0.48 | 1.08 | 1.37 | 1.94 | 1.85 | 2.07 | 24h | 2.1 (1.0 to 3.2) | |
| 4°C | −0.16 | 0.98 | 0.42 | 0.96 | 0.64 | 0.66 | −0.45 | NS | −0.5 (−1.4 to 0.4) | ||||
| BC-6800 | RT | 96.5 (95.7 to 97.5) | −0.20 | −0.20 | −0.20 | 0.20 | 0.85 | 1.35 | 2.00 | 36h | 2.1 (1.5 to 2.7) | ||
| 4°C | 0.00 | 0.80 | 0.60 | 0.70 | −0.10 | −0.50 | −0.90 | NS | −0.8 (−1.3 to −0.2) | ||||
| MFRa (%) | XN-9000 | RT | 8.4 (6.5 to 8.9) | −0.72 | −0.43 | −1.02 | −1.20 | −1.58 | −1.70 | −1.68 | 24h | −23.7 (−37.6 to −9.7) | |
| 4°C | 0.15 | −0.78 | −0.48 | −0.82 | −0.77 | −0.66 | 0.04 | NS | −0.9 (−11.2 to 9.5) | ||||
| BC-6800 | RT | 3.4 (2.5 to 4.3) | 0.20 | 0.20 | 0.20 | −0.20 | −0.85 | −1.35 | −2.00 | 36h | −90.2 (−67.9 to −35.5) | ||
| 4°C | 0.00 | −0.80 | −0.60 | −0.70 | 0.10 | 0.50 | 0.90 | NS | 22.0 (4.4 to 39.7) | ||||
| HFRa (%) | XN-9000 | RT | 0.9 (0.6 to 1.3) | 0.00 | 0.00 | −0.10 | −0.10 | −0.30 | −0.10 | −0.30 | NS | −51.1 (−79.2 to −23.0) | |
| 4°C | 0.10 | −0.15 | 0.10 | −0.10 | 0.10 | 0.10 | 0.40 | NS | 46.8 (21.2 to 72.4) | ||||
| BC-6800 | RT | 0.0 (0.0 to 0.0) | 0.00 | 0.00 | 0.00 | 0.00 | 0.00 | 0.00 | 0.00 | NS | 0.0 (0.0 to 0.0) | ||
| 4°C | 0.00 | 0.00 | 0.00 | 0.00 | 0.00 | 0.00 | 0.00 | NS | 0.0 (0.0 to 0.0) | ||||
WBC: white blood cells; RBC: red blood cell; RT: Room temperature; Hb: hemoglobin; HT: hematocrit; MCV: mean corpuscular volume; MCH: mean corpuscular hemoglobin; MCHC: mean corpuscular hemoglobin concentration; RDW-CV: distribution-coefficient of variation; RDW-SD: RBC distribution width-standard deviation; NRBC: nucleated red blood cell; RET: reticulocyte; IRF: immature reticulocyte fraction; LFR: low-fluorescence reticulocyte; MFR: medium-fluorescence reticulocyte; HFR: high-fluorescence reticulocyte; NS: ΔX not significant throughout the study period; NE: not evaluated; Temp: Temperature.
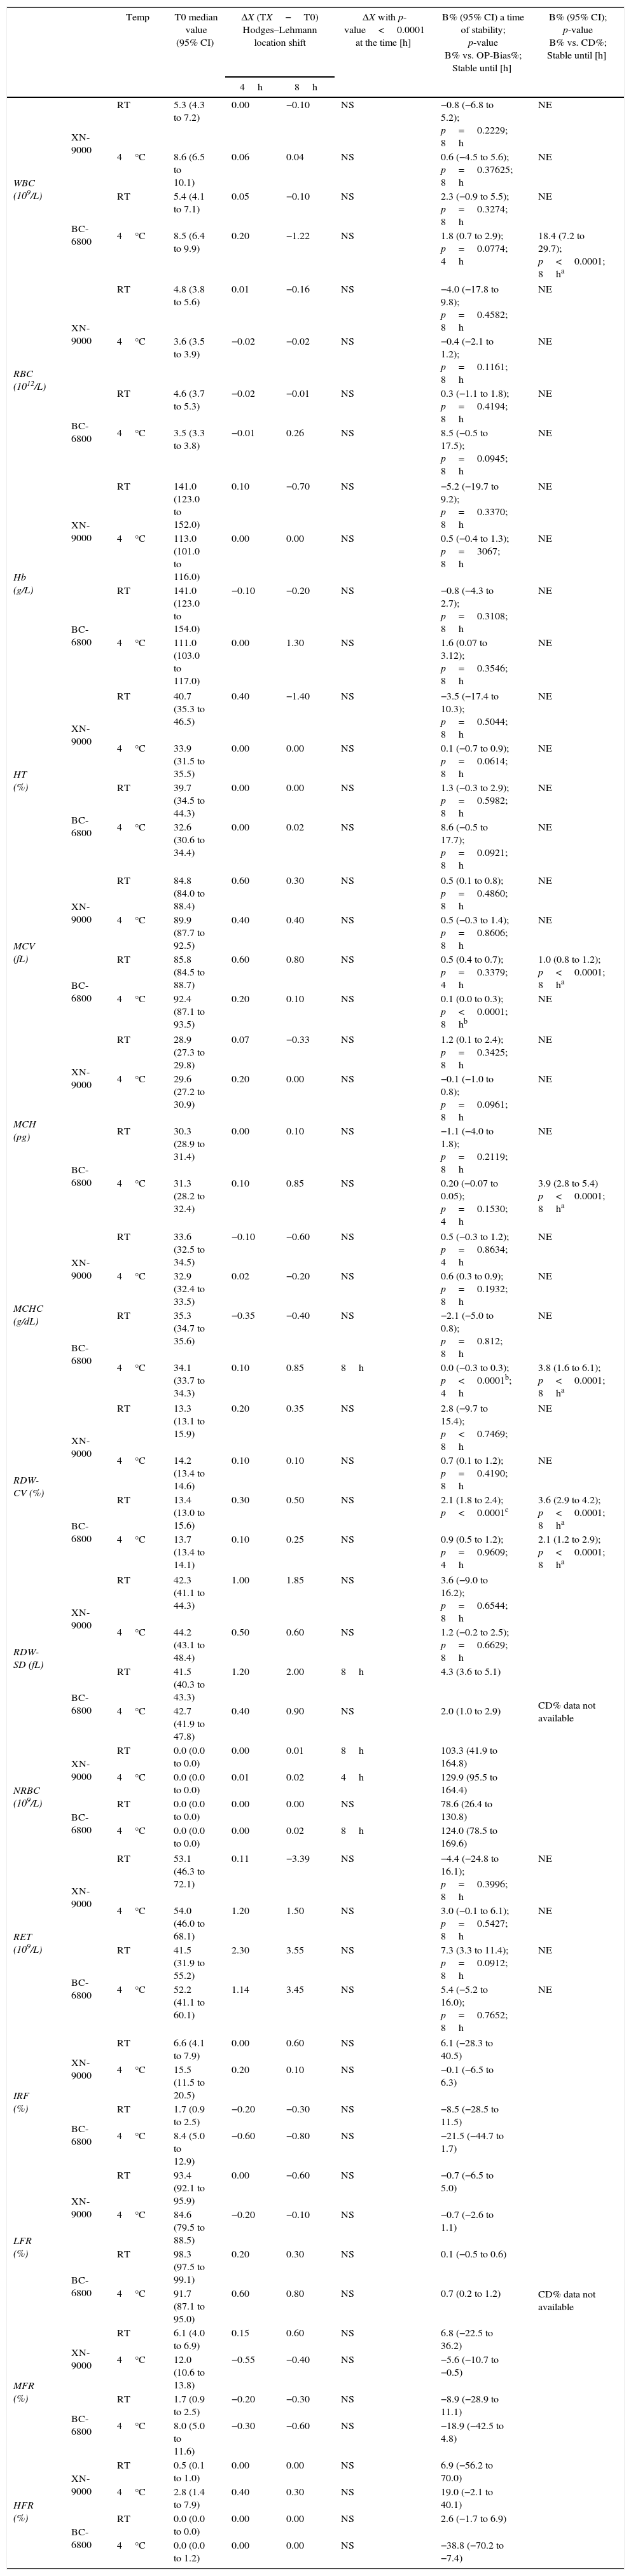
Samples stability on group of pathological samples for: CBC and RET profiles parameters. Median Hodges–Lehmann location shift (ΔX); Bias% (B%) between baseline (T0) and the time point (4h up to 8h) at 4°C and room temperature (RT) comparison of OP-Bias% to Critical Difference% (CD).
| Temp | T0 median value (95% CI) | ΔX (TX−T0) Hodges–Lehmann location shift | ΔX with p-value<0.0001 at the time [h] | B% (95% CI) a time of stability; p-value B% vs. OP-Bias%; Stable until [h] | B% (95% CI); p-value B% vs. CD%; Stable until [h] | |||
|---|---|---|---|---|---|---|---|---|
| 4h | 8h | |||||||
| WBC (109/L) | XN-9000 | RT | 5.3 (4.3 to 7.2) | 0.00 | −0.10 | NS | −0.8 (−6.8 to 5.2); p=0.2229; 8h | NE |
| 4°C | 8.6 (6.5 to 10.1) | 0.06 | 0.04 | NS | 0.6 (−4.5 to 5.6); p=0.37625; 8h | NE | ||
| BC-6800 | RT | 5.4 (4.1 to 7.1) | 0.05 | −0.10 | NS | 2.3 (−0.9 to 5.5); p=0.3274; 8h | NE | |
| 4°C | 8.5 (6.4 to 9.9) | 0.20 | −1.22 | NS | 1.8 (0.7 to 2.9); p=0.0774; 4h | 18.4 (7.2 to 29.7); p<0.0001; 8ha | ||
| RBC (1012/L) | XN-9000 | RT | 4.8 (3.8 to 5.6) | 0.01 | −0.16 | NS | −4.0 (−17.8 to 9.8); p=0.4582; 8h | NE |
| 4°C | 3.6 (3.5 to 3.9) | −0.02 | −0.02 | NS | −0.4 (−2.1 to 1.2); p=0.1161; 8h | NE | ||
| BC-6800 | RT | 4.6 (3.7 to 5.3) | −0.02 | −0.01 | NS | 0.3 (−1.1 to 1.8); p=0.4194; 8h | NE | |
| 4°C | 3.5 (3.3 to 3.8) | −0.01 | 0.26 | NS | 8.5 (−0.5 to 17.5); p=0.0945; 8h | NE | ||
| Hb (g/L) | XN-9000 | RT | 141.0 (123.0 to 152.0) | 0.10 | −0.70 | NS | −5.2 (−19.7 to 9.2); p=0.3370; 8h | NE |
| 4°C | 113.0 (101.0 to 116.0) | 0.00 | 0.00 | NS | 0.5 (−0.4 to 1.3); p=3067; 8h | NE | ||
| BC-6800 | RT | 141.0 (123.0 to 154.0) | −0.10 | −0.20 | NS | −0.8 (−4.3 to 2.7); p=0.3108; 8h | NE | |
| 4°C | 111.0 (103.0 to 117.0) | 0.00 | 1.30 | NS | 1.6 (0.07 to 3.12); p=0.3546; 8h | NE | ||
| HT (%) | XN-9000 | RT | 40.7 (35.3 to 46.5) | 0.40 | −1.40 | NS | −3.5 (−17.4 to 10.3); p=0.5044; 8h | NE |
| 4°C | 33.9 (31.5 to 35.5) | 0.00 | 0.00 | NS | 0.1 (−0.7 to 0.9); p=0.0614; 8h | NE | ||
| BC-6800 | RT | 39.7 (34.5 to 44.3) | 0.00 | 0.00 | NS | 1.3 (−0.3 to 2.9); p=0.5982; 8h | NE | |
| 4°C | 32.6 (30.6 to 34.4) | 0.00 | 0.02 | NS | 8.6 (−0.5 to 17.7); p=0.0921; 8h | NE | ||
| MCV (fL) | XN-9000 | RT | 84.8 (84.0 to 88.4) | 0.60 | 0.30 | NS | 0.5 (0.1 to 0.8); p=0.4860; 8h | NE |
| 4°C | 89.9 (87.7 to 92.5) | 0.40 | 0.40 | NS | 0.5 (−0.3 to 1.4); p=0.8606; 8h | NE | ||
| BC-6800 | RT | 85.8 (84.5 to 88.7) | 0.60 | 0.80 | NS | 0.5 (0.4 to 0.7); p=0.3379; 4h | 1.0 (0.8 to 1.2); p<0.0001; 8ha | |
| 4°C | 92.4 (87.1 to 93.5) | 0.20 | 0.10 | NS | 0.1 (0.0 to 0.3); p<0.0001; 8hb | NE | ||
| MCH (pg) | XN-9000 | RT | 28.9 (27.3 to 29.8) | 0.07 | −0.33 | NS | 1.2 (0.1 to 2.4); p=0.3425; 8h | NE |
| 4°C | 29.6 (27.2 to 30.9) | 0.20 | 0.00 | NS | −0.1 (−1.0 to 0.8); p=0.0961; 8h | NE | ||
| BC-6800 | RT | 30.3 (28.9 to 31.4) | 0.00 | 0.10 | NS | −1.1 (−4.0 to 1.8); p=0.2119; 8h | NE | |
| 4°C | 31.3 (28.2 to 32.4) | 0.10 | 0.85 | NS | 0.20 (−0.07 to 0.05); p=0.1530; 4h | 3.9 (2.8 to 5.4) p<0.0001; 8ha | ||
| MCHC (g/dL) | XN-9000 | RT | 33.6 (32.5 to 34.5) | −0.10 | −0.60 | NS | 0.5 (−0.3 to 1.2); p=0.8634; 4h | NE |
| 4°C | 32.9 (32.4 to 33.5) | 0.02 | −0.20 | NS | 0.6 (0.3 to 0.9); p=0.1932; 8h | NE | ||
| BC-6800 | RT | 35.3 (34.7 to 35.6) | −0.35 | −0.40 | NS | −2.1 (−5.0 to 0.8); p=0.812; 8h | NE | |
| 4°C | 34.1 (33.7 to 34.3) | 0.10 | 0.85 | 8h | 0.0 (−0.3 to 0.3); p<0.0001b; 4h | 3.8 (1.6 to 6.1); p<0.0001; 8ha | ||
| RDW-CV (%) | XN-9000 | RT | 13.3 (13.1 to 15.9) | 0.20 | 0.35 | NS | 2.8 (−9.7 to 15.4); p<0.7469; 8h | NE |
| 4°C | 14.2 (13.4 to 14.6) | 0.10 | 0.10 | NS | 0.7 (0.1 to 1.2); p=0.4190; 8h | NE | ||
| BC-6800 | RT | 13.4 (13.0 to 15.6) | 0.30 | 0.50 | NS | 2.1 (1.8 to 2.4); p<0.0001c | 3.6 (2.9 to 4.2); p<0.0001; 8ha | |
| 4°C | 13.7 (13.4 to 14.1) | 0.10 | 0.25 | NS | 0.9 (0.5 to 1.2); p=0.9609; 4h | 2.1 (1.2 to 2.9); p<0.0001; 8ha | ||
| RDW-SD (fL) | XN-9000 | RT | 42.3 (41.1 to 44.3) | 1.00 | 1.85 | NS | 3.6 (−9.0 to 16.2); p=0.6544; 8h | CD% data not available |
| 4°C | 44.2 (43.1 to 48.4) | 0.50 | 0.60 | NS | 1.2 (−0.2 to 2.5); p=0.6629; 8h | |||
| BC-6800 | RT | 41.5 (40.3 to 43.3) | 1.20 | 2.00 | 8h | 4.3 (3.6 to 5.1) | ||
| 4°C | 42.7 (41.9 to 47.8) | 0.40 | 0.90 | NS | 2.0 (1.0 to 2.9) | |||
| NRBC (109/L) | XN-9000 | RT | 0.0 (0.0 to 0.0) | 0.00 | 0.01 | 8h | 103.3 (41.9 to 164.8) | |
| 4°C | 0.0 (0.0 to 0.0) | 0.01 | 0.02 | 4h | 129.9 (95.5 to 164.4) | |||
| BC-6800 | RT | 0.0 (0.0 to 0.0) | 0.00 | 0.00 | NS | 78.6 (26.4 to 130.8) | ||
| 4°C | 0.0 (0.0 to 0.0) | 0.00 | 0.02 | 8h | 124.0 (78.5 to 169.6) | |||
| RET (109/L) | XN-9000 | RT | 53.1 (46.3 to 72.1) | 0.11 | −3.39 | NS | −4.4 (−24.8 to 16.1); p=0.3996; 8h | NE |
| 4°C | 54.0 (46.0 to 68.1) | 1.20 | 1.50 | NS | 3.0 (−0.1 to 6.1); p=0.5427; 8h | NE | ||
| BC-6800 | RT | 41.5 (31.9 to 55.2) | 2.30 | 3.55 | NS | 7.3 (3.3 to 11.4); p=0.0912; 8h | NE | |
| 4°C | 52.2 (41.1 to 60.1) | 1.14 | 3.45 | NS | 5.4 (−5.2 to 16.0); p=0.7652; 8h | NE | ||
| IRF (%) | XN-9000 | RT | 6.6 (4.1 to 7.9) | 0.00 | 0.60 | NS | 6.1 (−28.3 to 40.5) | CD% data not available |
| 4°C | 15.5 (11.5 to 20.5) | 0.20 | 0.10 | NS | −0.1 (−6.5 to 6.3) | |||
| BC-6800 | RT | 1.7 (0.9 to 2.5) | −0.20 | −0.30 | NS | −8.5 (−28.5 to 11.5) | ||
| 4°C | 8.4 (5.0 to 12.9) | −0.60 | −0.80 | NS | −21.5 (−44.7 to 1.7) | |||
| LFR (%) | XN-9000 | RT | 93.4 (92.1 to 95.9) | 0.00 | −0.60 | NS | −0.7 (−6.5 to 5.0) | |
| 4°C | 84.6 (79.5 to 88.5) | −0.20 | −0.10 | NS | −0.7 (−2.6 to 1.1) | |||
| BC-6800 | RT | 98.3 (97.5 to 99.1) | 0.20 | 0.30 | NS | 0.1 (−0.5 to 0.6) | ||
| 4°C | 91.7 (87.1 to 95.0) | 0.60 | 0.80 | NS | 0.7 (0.2 to 1.2) | |||
| MFR (%) | XN-9000 | RT | 6.1 (4.0 to 6.9) | 0.15 | 0.60 | NS | 6.8 (−22.5 to 36.2) | |
| 4°C | 12.0 (10.6 to 13.8) | −0.55 | −0.40 | NS | −5.6 (−10.7 to −0.5) | |||
| BC-6800 | RT | 1.7 (0.9 to 2.5) | −0.20 | −0.30 | NS | −8.9 (−28.9 to 11.1) | ||
| 4°C | 8.0 (5.0 to 11.6) | −0.30 | −0.60 | NS | −18.9 (−42.5 to 4.8) | |||
| HFR (%) | XN-9000 | RT | 0.5 (0.1 to 1.0) | 0.00 | 0.00 | NS | 6.9 (−56.2 to 70.0) | |
| 4°C | 2.8 (1.4 to 7.9) | 0.40 | 0.30 | NS | 19.0 (−2.1 to 40.1) | |||
| BC-6800 | RT | 0.0 (0.0 to 0.0) | 0.00 | 0.00 | NS | 2.6 (−1.7 to 6.9) | ||
| 4°C | 0.0 (0.0 to 1.2) | 0.00 | 0.00 | NS | −38.8 (−70.2 to −7.4) | |||
WBC: white blood cells; RBC: red blood cell; RT: Room temperature; Hb: hemoglobin; HT: hematocrit; MCV: mean corpuscular volume; MCH: mean corpuscular hemoglobin; MCHC: mean corpuscular hemoglobin concentration; RDW-CV: distribution-coefficient of variation; RDW-SD: RBC distribution width-standard deviation; NRBC: nucleated red blood cell; RET: reticulocyte; IRF: immature reticulocyte fraction; LFR: low-fluorescence reticulocyte; MFR: medium-fluorescence reticulocyte; HFR: high-fluorescence reticulocyte; NS: ΔX not significant throughout the study period; NE: not evaluated; Temp: Temperature.
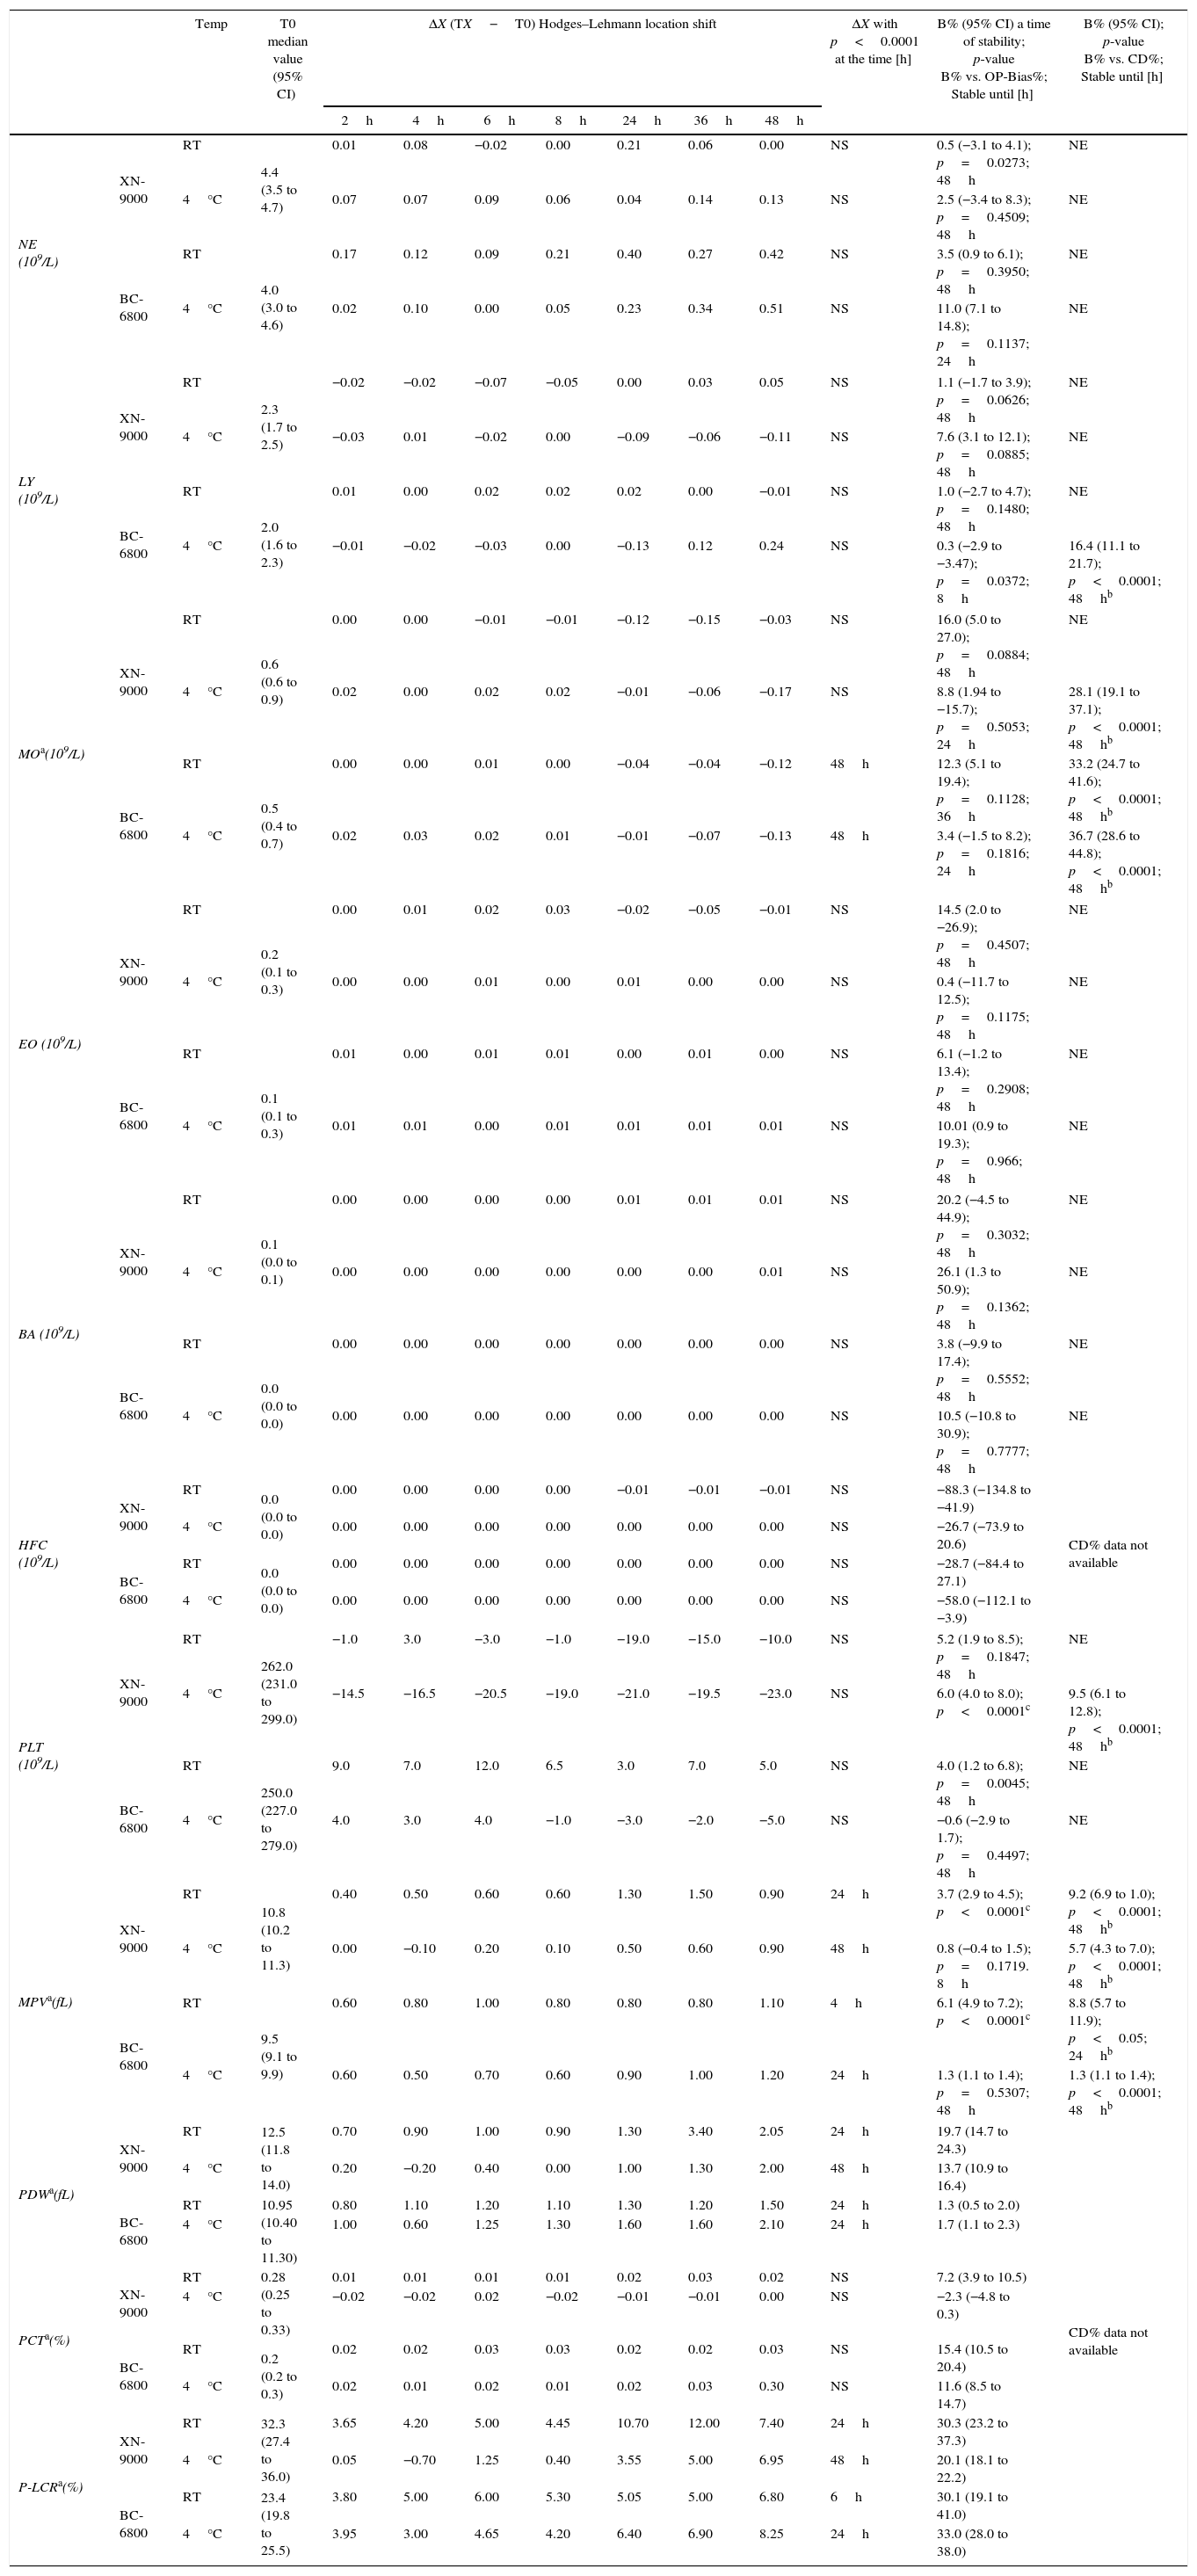
Samples stability of group of normal samples for: DIFF and PLT profiles parameters. Median Hodges–Lehmann location shift (ΔX); Bias% (B%) between baseline (T0) and the time point (2h up to 48h) at 4°C and room temperature (RT) comparison of OP-Bias% to Critical Difference% (CD).
| Temp | T0 median value (95% CI) | ΔX (TX−T0) Hodges–Lehmann location shift | ΔX with p<0.0001 at the time [h] | B% (95% CI) a time of stability; p-value B% vs. OP-Bias%; Stable until [h] | B% (95% CI); p-value B% vs. CD%; Stable until [h] | ||||||||
|---|---|---|---|---|---|---|---|---|---|---|---|---|---|
| 2h | 4h | 6h | 8h | 24h | 36h | 48h | |||||||
| NE (109/L) | XN-9000 | RT | 4.4 (3.5 to 4.7) | 0.01 | 0.08 | −0.02 | 0.00 | 0.21 | 0.06 | 0.00 | NS | 0.5 (−3.1 to 4.1); p=0.0273; 48h | NE |
| 4°C | 0.07 | 0.07 | 0.09 | 0.06 | 0.04 | 0.14 | 0.13 | NS | 2.5 (−3.4 to 8.3); p=0.4509; 48h | NE | |||
| BC-6800 | RT | 4.0 (3.0 to 4.6) | 0.17 | 0.12 | 0.09 | 0.21 | 0.40 | 0.27 | 0.42 | NS | 3.5 (0.9 to 6.1); p=0.3950; 48h | NE | |
| 4°C | 0.02 | 0.10 | 0.00 | 0.05 | 0.23 | 0.34 | 0.51 | NS | 11.0 (7.1 to 14.8); p=0.1137; 24h | NE | |||
| LY (109/L) | XN-9000 | RT | 2.3 (1.7 to 2.5) | −0.02 | −0.02 | −0.07 | −0.05 | 0.00 | 0.03 | 0.05 | NS | 1.1 (−1.7 to 3.9); p=0.0626; 48h | NE |
| 4°C | −0.03 | 0.01 | −0.02 | 0.00 | −0.09 | −0.06 | −0.11 | NS | 7.6 (3.1 to 12.1); p=0.0885; 48h | NE | |||
| BC-6800 | RT | 2.0 (1.6 to 2.3) | 0.01 | 0.00 | 0.02 | 0.02 | 0.02 | 0.00 | −0.01 | NS | 1.0 (−2.7 to 4.7); p=0.1480; 48h | NE | |
| 4°C | −0.01 | −0.02 | −0.03 | 0.00 | −0.13 | 0.12 | 0.24 | NS | 0.3 (−2.9 to −3.47); p=0.0372; 8h | 16.4 (11.1 to 21.7); p<0.0001; 48hb | |||
| MOa(109/L) | XN-9000 | RT | 0.6 (0.6 to 0.9) | 0.00 | 0.00 | −0.01 | −0.01 | −0.12 | −0.15 | −0.03 | NS | 16.0 (5.0 to 27.0); p=0.0884; 48h | NE |
| 4°C | 0.02 | 0.00 | 0.02 | 0.02 | −0.01 | −0.06 | −0.17 | NS | 8.8 (1.94 to −15.7); p=0.5053; 24h | 28.1 (19.1 to 37.1); p<0.0001; 48hb | |||
| BC-6800 | RT | 0.5 (0.4 to 0.7) | 0.00 | 0.00 | 0.01 | 0.00 | −0.04 | −0.04 | −0.12 | 48h | 12.3 (5.1 to 19.4); p=0.1128; 36h | 33.2 (24.7 to 41.6); p<0.0001; 48hb | |
| 4°C | 0.02 | 0.03 | 0.02 | 0.01 | −0.01 | −0.07 | −0.13 | 48h | 3.4 (−1.5 to 8.2); p=0.1816; 24h | 36.7 (28.6 to 44.8); p<0.0001; 48hb | |||
| EO (109/L) | XN-9000 | RT | 0.2 (0.1 to 0.3) | 0.00 | 0.01 | 0.02 | 0.03 | −0.02 | −0.05 | −0.01 | NS | 14.5 (2.0 to −26.9); p=0.4507; 48h | NE |
| 4°C | 0.00 | 0.00 | 0.01 | 0.00 | 0.01 | 0.00 | 0.00 | NS | 0.4 (−11.7 to 12.5); p=0.1175; 48h | NE | |||
| BC-6800 | RT | 0.1 (0.1 to 0.3) | 0.01 | 0.00 | 0.01 | 0.01 | 0.00 | 0.01 | 0.00 | NS | 6.1 (−1.2 to 13.4); p=0.2908; 48h | NE | |
| 4°C | 0.01 | 0.01 | 0.00 | 0.01 | 0.01 | 0.01 | 0.01 | NS | 10.01 (0.9 to 19.3); p=0.966; 48h | NE | |||
| BA (109/L) | XN-9000 | RT | 0.1 (0.0 to 0.1) | 0.00 | 0.00 | 0.00 | 0.00 | 0.01 | 0.01 | 0.01 | NS | 20.2 (−4.5 to 44.9); p=0.3032; 48h | NE |
| 4°C | 0.00 | 0.00 | 0.00 | 0.00 | 0.00 | 0.00 | 0.01 | NS | 26.1 (1.3 to 50.9); p=0.1362; 48h | NE | |||
| BC-6800 | RT | 0.0 (0.0 to 0.0) | 0.00 | 0.00 | 0.00 | 0.00 | 0.00 | 0.00 | 0.00 | NS | 3.8 (−9.9 to 17.4); p=0.5552; 48h | NE | |
| 4°C | 0.00 | 0.00 | 0.00 | 0.00 | 0.00 | 0.00 | 0.00 | NS | 10.5 (−10.8 to 30.9); p=0.7777; 48h | NE | |||
| HFC (109/L) | XN-9000 | RT | 0.0 (0.0 to 0.0) | 0.00 | 0.00 | 0.00 | 0.00 | −0.01 | −0.01 | −0.01 | NS | −88.3 (−134.8 to −41.9) | CD% data not available |
| 4°C | 0.00 | 0.00 | 0.00 | 0.00 | 0.00 | 0.00 | 0.00 | NS | −26.7 (−73.9 to 20.6) | ||||
| BC-6800 | RT | 0.0 (0.0 to 0.0) | 0.00 | 0.00 | 0.00 | 0.00 | 0.00 | 0.00 | 0.00 | NS | −28.7 (−84.4 to 27.1) | ||
| 4°C | 0.00 | 0.00 | 0.00 | 0.00 | 0.00 | 0.00 | 0.00 | NS | −58.0 (−112.1 to −3.9) | ||||
| PLT (109/L) | XN-9000 | RT | 262.0 (231.0 to 299.0) | −1.0 | 3.0 | −3.0 | −1.0 | −19.0 | −15.0 | −10.0 | NS | 5.2 (1.9 to 8.5); p=0.1847; 48h | NE |
| 4°C | −14.5 | −16.5 | −20.5 | −19.0 | −21.0 | −19.5 | −23.0 | NS | 6.0 (4.0 to 8.0); p<0.0001c | 9.5 (6.1 to 12.8); p<0.0001; 48hb | |||
| BC-6800 | RT | 250.0 (227.0 to 279.0) | 9.0 | 7.0 | 12.0 | 6.5 | 3.0 | 7.0 | 5.0 | NS | 4.0 (1.2 to 6.8); p=0.0045; 48h | NE | |
| 4°C | 4.0 | 3.0 | 4.0 | −1.0 | −3.0 | −2.0 | −5.0 | NS | −0.6 (−2.9 to 1.7); p=0.4497; 48h | NE | |||
| MPVa(fL) | XN-9000 | RT | 10.8 (10.2 to 11.3) | 0.40 | 0.50 | 0.60 | 0.60 | 1.30 | 1.50 | 0.90 | 24h | 3.7 (2.9 to 4.5); p<0.0001c | 9.2 (6.9 to 1.0); p<0.0001; 48hb |
| 4°C | 0.00 | −0.10 | 0.20 | 0.10 | 0.50 | 0.60 | 0.90 | 48h | 0.8 (−0.4 to 1.5); p=0.1719. 8h | 5.7 (4.3 to 7.0); p<0.0001; 48hb | |||
| BC-6800 | RT | 9.5 (9.1 to 9.9) | 0.60 | 0.80 | 1.00 | 0.80 | 0.80 | 0.80 | 1.10 | 4h | 6.1 (4.9 to 7.2); p<0.0001c | 8.8 (5.7 to 11.9); p<0.05; 24hb | |
| 4°C | 0.60 | 0.50 | 0.70 | 0.60 | 0.90 | 1.00 | 1.20 | 24h | 1.3 (1.1 to 1.4); p=0.5307; 48h | 1.3 (1.1 to 1.4); p<0.0001; 48hb | |||
| PDWa(fL) | XN-9000 | RT | 12.5 (11.8 to 14.0) | 0.70 | 0.90 | 1.00 | 0.90 | 1.30 | 3.40 | 2.05 | 24h | 19.7 (14.7 to 24.3) | CD% data not available |
| 4°C | 0.20 | −0.20 | 0.40 | 0.00 | 1.00 | 1.30 | 2.00 | 48h | 13.7 (10.9 to 16.4) | ||||
| BC-6800 | RT | 10.95 (10.40 to 11.30) | 0.80 | 1.10 | 1.20 | 1.10 | 1.30 | 1.20 | 1.50 | 24h | 1.3 (0.5 to 2.0) | ||
| 4°C | 1.00 | 0.60 | 1.25 | 1.30 | 1.60 | 1.60 | 2.10 | 24h | 1.7 (1.1 to 2.3) | ||||
| PCTa(%) | XN-9000 | RT | 0.28 (0.25 to 0.33) | 0.01 | 0.01 | 0.01 | 0.01 | 0.02 | 0.03 | 0.02 | NS | 7.2 (3.9 to 10.5) | |
| 4°C | −0.02 | −0.02 | 0.02 | −0.02 | −0.01 | −0.01 | 0.00 | NS | −2.3 (−4.8 to 0.3) | ||||
| BC-6800 | RT | 0.2 (0.2 to 0.3) | 0.02 | 0.02 | 0.03 | 0.03 | 0.02 | 0.02 | 0.03 | NS | 15.4 (10.5 to 20.4) | ||
| 4°C | 0.02 | 0.01 | 0.02 | 0.01 | 0.02 | 0.03 | 0.30 | NS | 11.6 (8.5 to 14.7) | ||||
| P-LCRa(%) | XN-9000 | RT | 32.3 (27.4 to 36.0) | 3.65 | 4.20 | 5.00 | 4.45 | 10.70 | 12.00 | 7.40 | 24h | 30.3 (23.2 to 37.3) | |
| 4°C | 0.05 | −0.70 | 1.25 | 0.40 | 3.55 | 5.00 | 6.95 | 48h | 20.1 (18.1 to 22.2) | ||||
| BC-6800 | RT | 23.4 (19.8 to 25.5) | 3.80 | 5.00 | 6.00 | 5.30 | 5.05 | 5.00 | 6.80 | 6h | 30.1 (19.1 to 41.0) | ||
| 4°C | 3.95 | 3.00 | 4.65 | 4.20 | 6.40 | 6.90 | 8.25 | 24h | 33.0 (28.0 to 38.0) | ||||
NE: neutrophil; LY: lymphocyte; MO: monocyte; RT: Room temperature; EO: eosinophil; BA: basophil; HFC: HIGH fluorescence cells; PLT: platelet; MPV: mean volume platelet; PDW: PLT distribution width; PCT: plateletcrit; P-LCR: PLT larger cell ratio; NS: ΔX not significant throughout the study period; NE: not evaluated; Temp: Temperature.
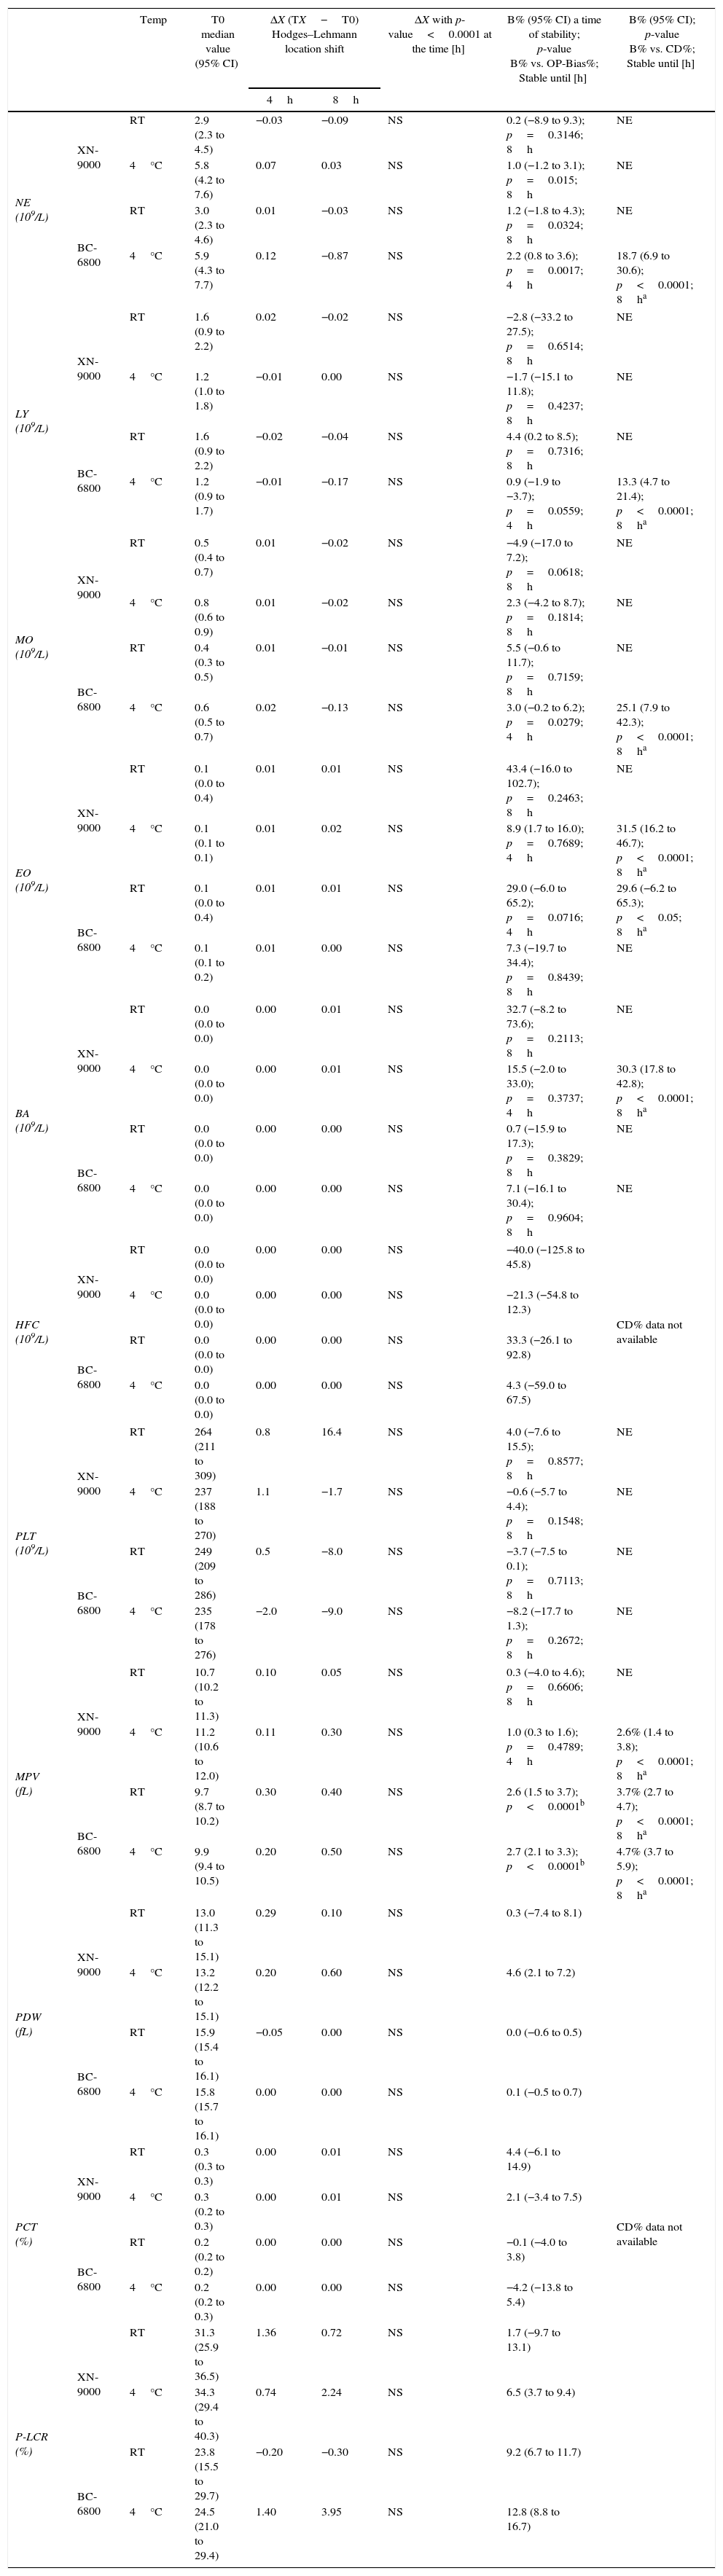
Samples stability of group of pathological samples for DIFF and PLT profiles parameters. Median Hodges–Lehmann location shift (ΔX); Bias% (B%) between baseline (T0) and the time point (4h up to 8h) at 4°C and room temperature (RT) comparison of OP-Bias% to Critical Difference% (CD).
| Temp | T0 median value (95% CI) | ΔX (TX−T0) Hodges–Lehmann location shift | ΔX with p-value<0.0001 at the time [h] | B% (95% CI) a time of stability; p-value B% vs. OP-Bias%; Stable until [h] | B% (95% CI); p-value B% vs. CD%; Stable until [h] | |||
|---|---|---|---|---|---|---|---|---|
| 4h | 8h | |||||||
| NE (109/L) | XN-9000 | RT | 2.9 (2.3 to 4.5) | −0.03 | −0.09 | NS | 0.2 (−8.9 to 9.3); p=0.3146; 8h | NE |
| 4°C | 5.8 (4.2 to 7.6) | 0.07 | 0.03 | NS | 1.0 (−1.2 to 3.1); p=0.015; 8h | NE | ||
| BC-6800 | RT | 3.0 (2.3 to 4.6) | 0.01 | −0.03 | NS | 1.2 (−1.8 to 4.3); p=0.0324; 8h | NE | |
| 4°C | 5.9 (4.3 to 7.7) | 0.12 | −0.87 | NS | 2.2 (0.8 to 3.6); p=0.0017; 4h | 18.7 (6.9 to 30.6); p<0.0001; 8ha | ||
| LY (109/L) | XN-9000 | RT | 1.6 (0.9 to 2.2) | 0.02 | −0.02 | NS | −2.8 (−33.2 to 27.5); p=0.6514; 8h | NE |
| 4°C | 1.2 (1.0 to 1.8) | −0.01 | 0.00 | NS | −1.7 (−15.1 to 11.8); p=0.4237; 8h | NE | ||
| BC-6800 | RT | 1.6 (0.9 to 2.2) | −0.02 | −0.04 | NS | 4.4 (0.2 to 8.5); p=0.7316; 8h | NE | |
| 4°C | 1.2 (0.9 to 1.7) | −0.01 | −0.17 | NS | 0.9 (−1.9 to −3.7); p=0.0559; 4h | 13.3 (4.7 to 21.4); p<0.0001; 8ha | ||
| MO (109/L) | XN-9000 | RT | 0.5 (0.4 to 0.7) | 0.01 | −0.02 | NS | −4.9 (−17.0 to 7.2); p=0.0618; 8h | NE |
| 4°C | 0.8 (0.6 to 0.9) | 0.01 | −0.02 | NS | 2.3 (−4.2 to 8.7); p=0.1814; 8h | NE | ||
| BC-6800 | RT | 0.4 (0.3 to 0.5) | 0.01 | −0.01 | NS | 5.5 (−0.6 to 11.7); p=0.7159; 8h | NE | |
| 4°C | 0.6 (0.5 to 0.7) | 0.02 | −0.13 | NS | 3.0 (−0.2 to 6.2); p=0.0279; 4h | 25.1 (7.9 to 42.3); p<0.0001; 8ha | ||
| EO (109/L) | XN-9000 | RT | 0.1 (0.0 to 0.4) | 0.01 | 0.01 | NS | 43.4 (−16.0 to 102.7); p=0.2463; 8h | NE |
| 4°C | 0.1 (0.1 to 0.1) | 0.01 | 0.02 | NS | 8.9 (1.7 to 16.0); p=0.7689; 4h | 31.5 (16.2 to 46.7); p<0.0001; 8ha | ||
| BC-6800 | RT | 0.1 (0.0 to 0.4) | 0.01 | 0.01 | NS | 29.0 (−6.0 to 65.2); p=0.0716; 4h | 29.6 (−6.2 to 65.3); p<0.05; 8ha | |
| 4°C | 0.1 (0.1 to 0.2) | 0.01 | 0.00 | NS | 7.3 (−19.7 to 34.4); p=0.8439; 8h | NE | ||
| BA (109/L) | XN-9000 | RT | 0.0 (0.0 to 0.0) | 0.00 | 0.01 | NS | 32.7 (−8.2 to 73.6); p=0.2113; 8h | NE |
| 4°C | 0.0 (0.0 to 0.0) | 0.00 | 0.01 | NS | 15.5 (−2.0 to 33.0); p=0.3737; 4h | 30.3 (17.8 to 42.8); p<0.0001; 8ha | ||
| BC-6800 | RT | 0.0 (0.0 to 0.0) | 0.00 | 0.00 | NS | 0.7 (−15.9 to 17.3); p=0.3829; 8h | NE | |
| 4°C | 0.0 (0.0 to 0.0) | 0.00 | 0.00 | NS | 7.1 (−16.1 to 30.4); p=0.9604; 8h | NE | ||
| HFC (109/L) | XN-9000 | RT | 0.0 (0.0 to 0.0) | 0.00 | 0.00 | NS | −40.0 (−125.8 to 45.8) | CD% data not available |
| 4°C | 0.0 (0.0 to 0.0) | 0.00 | 0.00 | NS | −21.3 (−54.8 to 12.3) | |||
| BC-6800 | RT | 0.0 (0.0 to 0.0) | 0.00 | 0.00 | NS | 33.3 (−26.1 to 92.8) | ||
| 4°C | 0.0 (0.0 to 0.0) | 0.00 | 0.00 | NS | 4.3 (−59.0 to 67.5) | |||
| PLT (109/L) | XN-9000 | RT | 264 (211 to 309) | 0.8 | 16.4 | NS | 4.0 (−7.6 to 15.5); p=0.8577; 8h | NE |
| 4°C | 237 (188 to 270) | 1.1 | −1.7 | NS | −0.6 (−5.7 to 4.4); p=0.1548; 8h | NE | ||
| BC-6800 | RT | 249 (209 to 286) | 0.5 | −8.0 | NS | −3.7 (−7.5 to 0.1); p=0.7113; 8h | NE | |
| 4°C | 235 (178 to 276) | −2.0 | −9.0 | NS | −8.2 (−17.7 to 1.3); p=0.2672; 8h | NE | ||
| MPV (fL) | XN-9000 | RT | 10.7 (10.2 to 11.3) | 0.10 | 0.05 | NS | 0.3 (−4.0 to 4.6); p=0.6606; 8h | NE |
| 4°C | 11.2 (10.6 to 12.0) | 0.11 | 0.30 | NS | 1.0 (0.3 to 1.6); p=0.4789; 4h | 2.6% (1.4 to 3.8); p<0.0001; 8ha | ||
| BC-6800 | RT | 9.7 (8.7 to 10.2) | 0.30 | 0.40 | NS | 2.6 (1.5 to 3.7); p<0.0001b | 3.7% (2.7 to 4.7); p<0.0001; 8ha | |
| 4°C | 9.9 (9.4 to 10.5) | 0.20 | 0.50 | NS | 2.7 (2.1 to 3.3); p<0.0001b | 4.7% (3.7 to 5.9); p<0.0001; 8ha | ||
| PDW (fL) | XN-9000 | RT | 13.0 (11.3 to 15.1) | 0.29 | 0.10 | NS | 0.3 (−7.4 to 8.1) | CD% data not available |
| 4°C | 13.2 (12.2 to 15.1) | 0.20 | 0.60 | NS | 4.6 (2.1 to 7.2) | |||
| BC-6800 | RT | 15.9 (15.4 to 16.1) | −0.05 | 0.00 | NS | 0.0 (−0.6 to 0.5) | ||
| 4°C | 15.8 (15.7 to 16.1) | 0.00 | 0.00 | NS | 0.1 (−0.5 to 0.7) | |||
| PCT (%) | XN-9000 | RT | 0.3 (0.3 to 0.3) | 0.00 | 0.01 | NS | 4.4 (−6.1 to 14.9) | |
| 4°C | 0.3 (0.2 to 0.3) | 0.00 | 0.01 | NS | 2.1 (−3.4 to 7.5) | |||
| BC-6800 | RT | 0.2 (0.2 to 0.2) | 0.00 | 0.00 | NS | −0.1 (−4.0 to 3.8) | ||
| 4°C | 0.2 (0.2 to 0.3) | 0.00 | 0.00 | NS | −4.2 (−13.8 to 5.4) | |||
| P-LCR (%) | XN-9000 | RT | 31.3 (25.9 to 36.5) | 1.36 | 0.72 | NS | 1.7 (−9.7 to 13.1) | |
| 4°C | 34.3 (29.4 to 40.3) | 0.74 | 2.24 | NS | 6.5 (3.7 to 9.4) | |||
| BC-6800 | RT | 23.8 (15.5 to 29.7) | −0.20 | −0.30 | NS | 9.2 (6.7 to 11.7) | ||
| 4°C | 24.5 (21.0 to 29.4) | 1.40 | 3.95 | NS | 12.8 (8.8 to 16.7) | |||
NE: neutrophil; RT: Room temperature; LY: lymphocyte; MO: monocyte; EO: eosinophil; BA: basophil; HFC: high fluorescence cells; PLT: platelet; MPV: mean volume platelet; PDW: PLT distribution width; PCT: plateletcrit; P-LCR: PLT larger cell ratio; NS: ΔX not significant throughout the study period; NE: not evaluated; Temp: Temperature.
The median values obtained at baseline (i.e., T0) in the normal sample group did not significantly differ between the two analyzers for all the parameters tested, except for MCH and MCHC (Table 2). In this group of normal samples, the values of WBC, RBC, HB, MCH and NRBC were found to be stable up to 48h at RT and 4°C using both analyzers. Conversely, the HT values displayed a statistically significant increase 48h after collection in samples stored at RT (but not in those stored at 4°C) when measured with both analyzers. The comparison of the Bias% at different time points (TX) with the OP-Bias% showed that HT is stable at room temperature for up to 8h using both the XN-9000 (Bias%: 0.9) and BC-6800 (Bias%: 1.9), whereas the Bias% for HT in samples stored at RT remained lower than the CD% for up to 24h. The same analysis in samples stored at 4°C showed good stability for up to 24h after collection when compared with the OP-Bias%, whereas the Bias% always remained lower than the CD% throughout the study period (i.e., up to 48h) using both analyzers.
The values of MCV and RDW-SD displayed significant differences after 24h of storage at RT, whereas the results remained substantially unchanged for up to 48h after collection in samples stored a 4°C. Interestingly, the Bias% of MCV exceeded the OP-Bias% after 2h of storage at RT with the XN-9000 and after 8h of storage at RT with the BC-6800, respectively. The Bias% of MCV was lower than the relative CD% for up to 8h of storage using both analyzers at RT. At variance, the Bias% always remained lower than CD% throughout the study period in samples stored at 4°C. The RDW-CV exhibited significant variations after 24h from collection using both analyzers at RT, whereas significant differences were observed after 24h of storage in samples stored at 4°C using the XN-9000 but not with the BC-6800 (Table 2). When compared with the OP-Bias%, RDW-CV values were found to be stable for up to 8h at both RT and 4°C using the XN-9000, and for up to 2h at RT with the BC-6800. The Bias% of RDW-CV was always lower than the OP-Bias% for up to 48h of storage using the BC-6800.
At variance with previous parameters, the values of MCHC displayed a specific and instrument-dependent variation. More specifically, significant differences were observed after 4h of storage at RT and 2h of storage at 4°C with the XN-9000. Accordingly, the Bias% exceeded the OP-Bias% at 2h of storage at both temperatures, whereas the Bias% did not exceed the CD% for up to 8h of storage at RT and for up to 48h of storage at 4°C. As regards MCHC values obtained with the BC-6800, significant differences were found after 24h of storage at RT and at the 48h time point after storage at 4°C. The OP-Bias% was exceeded after 8h of storage at RT and 24h of storage at 4°C, whereas the Bias% remained lower than the CD% for up to 8h of storage at RT and for up to 48h of storage at 4°C (Table 2).
All these parameters appeared to be substantially stable for up to 8h at both RT and 4°C in the abnormal samples group using both analyzers. The most relevant exceptions are summarized in Table 3. Specifically, the NRBC measured with the XN-9000 showed significant variations 8h after collection in samples stored at RT and 4h after collection in those stored at 4°C, whereas significant variations of NRBC measured with the BC-6800 could only be observed after 8h of storage at 4°C. The comparison between the Bias% and OP-Bias% for the MCH and RDW-CV measured with the BC-6800 showed a significant variation after 4h of storage at 4°C. As regards the XN-9000, only the Bias% for MCHC increased over the OP-Bias% after 4h of storage at RT. Interestingly, the Bias% was found to be always lower than the CD% for all parameters with both analyzers for up to 8h of storage at both temperatures.
ReticulocytesThe baseline values of the different RET parameters were found to be always different on comparing the measurements of the two hematological analyzers (Table 2). In the group of normal blood samples, RET and percentage of HFR were found to be stable for up to 48h using both analyzers and at both temperatures. The Bias% of RET was found to be higher than the OP-Bias% after 36h of storage at both temperatures. The percentages of IRF, LFR and MFR were found to be higher than the T0 values after 24h of storage at RT with the XN-9000 and after 36h of storage at RT with the BC-6800 (Table 4). In the group of abnormal blood samples all the RET parameters were found to be stable for up to 8h using both analyzers and at both temperatures (Table 3).
Leukocyte count and differentialThe baseline values of Leukocytes and DIFF counts did not exhibit statistically significant variations throughout the study period in the subgroup of normal samples, using both analyzers and at both temperatures, with the only exception of the MO measured with the BC-6800 at the 48-h time point (Table 4). Accordingly, the Bias% of MO increased over the OP-Bias% after 36–48h of storage at RT and after 24h of storage at 4°C. Importantly, the Bias% was found to be always lower than the CD% throughout the study period, using both analyzers and at both temperatures.
In the abnormal samples group the various parameters were also found to be stable up to 8h of storage using both analyzers and at both temperatures (Table 5). The OP-Bias% was exceeded after 4h for NE, LY and MO at 4°C, and EO at RT using the BC-6800. The Bias% of EO also exceeded the OP-Bias% after 8h of storage at 4°C using the XN-9000 (Table 5).
PlateletsWith the exception of PLT and PCT, the baseline values of all the PLT parameters were found to be significantly different between the two analyzers in the group of normal blood samples (Table 4). In this group of specimens, PLT and PCT parameters were found to be stable for up to 48h at both RT and 4°C using both analyzers (Table 4). The remaining parameters (MPV, PDW, PCT and P-LCR) showed instrument-dependent variations.
The Bias% of the PLT count measured with the XN-9000 was found to be higher than the OP-Bias% after 2h of storage at 4°C, but remained always lower than the CD% for up to 48h of storage at this temperature. The values of MPV measured with the XN-9000 significantly increased after 24h of storage at RT and at 48h of storage at 4°C. However, the variation of the MPV was found to be higher than the OP-Bias% starting from 2h of storage at RT and 8h of storage at 4°C (Table 4). Importantly, the Bias% of the MPV never exceeded the CD% throughout the 48h of storage. As regards the BC-6800, the MPV values were significantly increased after 4h of storage at RT and 24h of storage at 4°C. A Bias% larger than the OP-Bias% was observed after 2h of storage at RT, although it remained lower than the CD% throughout the 24h of storage at RT (Table 4). The values of the PDW measured with both analyzers were found to be significantly different after 24h of storage at RT, whereas significant differences in samples stored at 4°C were observed after 24h of storage with the BC-6800 and after 48h of storage with the XN-9000 (Table 4).
In the group of abnormal samples, the PLT parameters were found to be stable for up to 8h using both analyzers at both temperatures (Table 5). Nevertheless, the Bias% of the MPV measured with the BC-6800 was found to be higher than the OP-Bias% after 2h of storage at both temperatures, whereas the Bias% of the MPV measured with the XN-9000 exceeded the OP-Bias% after 4h of storage at 4°C. In no case, however, the Bias% was found to be higher than the CD% in up to 8h of storage at both temperatures (Table 5).
DiscussionThe ongoing reorganization of laboratory services around the globe frequently entails the consolidation of small labs into larger facilities.20 This process poses serious challenges to sample quality, as sometimes blood specimens need to be transported over long distances and for long periods of time.21 Therefore, the aim of our study was to obtain information about sample stability for many hematological parameters measured with both the XN-9000 and BC-6800 analyzers. It is hence not surprising that the stability data obtained in this study were quite similar. Analyzer-specific trends were only observed for a few parameters such as MCHC, MPV and MO. More specifically, MCHC was found to be stable for longer at both RT and 4°C using the BC-6800, whereas the MPV was found to be stable for longer at 4°C with the XN-9000. As the analyzers use rather similar analytical techniques, the differences seem to be attributable to a different technological approach used to assess MCHC and MPV.
Overall, the stability appeared greater for normal samples when they were stored at 4°C compared to RT. A similar trend was observed for abnormal samples, except for the NRBC count as this parameter measured with the XN-9000 showed a significant variation after 4h of storage at 4°C and after 8h of storage at RT. When measured with the BC-6800, the NRBC count was found to be stable throughout the study period at RT, whereas a significant change was found after 8h of storage at 4°C (Table 3).
For the Sysmex XN-series, in accord with previous data published by Briggs et al.,7 the values of WBC, NRBC and leukocyte DIFF were found to be stable up to 48h when normal samples were stored at 4°C. Tanaka et al. published data on the stability of the PLT count,22 which are overall similar to the results observed in this study (PLT seem to be stable for up to 48h in blood samples stored at both RT and at 4°C). Discrepant data were instead found comparing our results with those obtained by Daves et al.23 and by Imeri et al.2 using the Sysmex XN-series. Specifically, larger differences were found for some RBC parameters in normal blood samples (i.e., MCH, MCV, RDW-SD, PLT count and MPV). In these published investigations, the stability was found to be less than in the current study in blood samples stored at both RT and 4°C.
Conversely, the stability of MCHC values was found to be less in our investigation than in the study published by Daves et al.23 The differences are probably attributable to the use of different pre-analytical procedures between studies. In fact, our investigation was designed using strict criteria for the pre-analytical phase (especially for collection and transportation of normal samples), according to which the collection and transportation of healthy samples was directly handled by laboratory personnel. Similar evidence is unavailable in the studies of Daves et al.23 and Imeri et al.,2 who preferred to follow a different approach (i.e., blood collection and handling by nurses), which is probably closer to the reality of routine healthcare practices. Notably, no previous information is available for blood sample stability assessed with the BC-6800, so that a direct comparison is unfeasible.
Interesting results emerge from the comparison between the Bias% of the different analytes at different times and temperature conditions, which may be useful for defining the best practice for the pre-analytical phase of routine hematological testing. In the analysis of normal samples, the MCV exhibited a Bias% of −1.5% with the XN-9000 and a Bias% of −0.15% with the BC-6800 in a sample stored for 8h at RT. However, the Bias% of MCHC and RDW-CV measured with the BC-6800 were −0.7% and 2.7% after 8h of storage at RT and the Bias% of MCHC measured with the XN-9000 was −2.4% after 8h of storage at RT. The HT exhibited a Bias% of 4.9% with both the analyzers after 24h at RT. After these periods of storage, the variation of the parameters was found to be higher than the CD%.
The major limitation of this study was the absence of stability evaluation of pathological samples up to 72h (i.e., 12h, 24h, 36h and 72h) as suggested in the ICSH guidelines.3,4 This was not possible because the amount of each pathological sample included in this study was limited (only one tube for each sample compared to three tubes for normal samples).
The results of this study show that the time and temperature of storage can have an impact on the quality of hematological testing, with results that may significantly deviate from the clinically allowable bias. Overall, we can hence suggest that the blood samples should always be analyzed within 2h from collection regardless of storage temperature. When the Bias% is compared to the CD%, the maximum time for sample analysis can however be extended to up to 8h. Over 8h it is not advisable to report the time or temperature-sensitive parameters.
Conflicts of interestThe authors declare no conflicts of interest.


