

Multiple myeloma (MM) is a hematological malignancy characterized by clonal proliferation of malignant plasma cells which accumulate in the bone marrow, resulting in recurrent hypercalcemia, anemia, osteolytic lesions, renal failure, and increased risk of infection.1 Stathmin 1, also named oncoprotein 18 (OP18) or leukemia-associated phosphoprotein p18 (LAP18), is a microtubule destabilizer that plays an important role in cell progression, clonogenicity, differentiation and survival.2 Stathmin 1 overexpression has been reported in hematological malignancies, including acute myeloid leukemia, acute lymphoid leukemia, lymphoma, high-risk myelodysplastic syndromes and primary myelofibrosis.3–7 Functional studies indicate that high stathmin 1 expression is able to sustain rapid cell division and proliferation of leukemia cells, which are suppressed by stathmin 1 inhibition.5,8,9 Using the microarray approach, stathmin 1 has been identified as one of 15 relevant genes that determine the outcome in MM patients.10
The aim of the present study was to investigate Stathmin 1 expression in respect to clinical and laboratorial characteristics, and outcomes of MM patients. Bone marrow samples collected from healthy donors (n=21, median age 33 years; range: 18–69), MM patients (n=30; median age 64 years; range: 45–86) and plasma cell leukemia patients (PCL; n=4; median age 72 years; range: 68–84) were analyzed. All patients included in the study were untreated at the time of sample collection. Patients’ characteristics are listed in Table 1. All healthy controls and patients provided informed written consent and the study was approved by the Research Ethics Committee of the Universidade Estadual de Campinas. MM patients received cyclophosphamide, thalidomide and dexamethasone (CTD; n=15), bortezomib, thalidomide and dexamethasone (VTD; n=1), CTD/VTD (n=4), or melphalan, prednisolone and thalidomide (MPT; n=9) protocol treatments or watchful waiting (n=1). Total RNA was obtained from total bone marrow cells after removal of erythrocytes by hemolysis using the TRIzol reagent (Invitrogen, Carlsbad, CA, USA). The genomic DNA was eliminated using DNAse I treatment (Invitrogen). The cDNA was obtained from 1μg of RNA using the RevertAid™ First Strand cDNA Synthesis Kit (MBI Fermentas, St. Leon-Rot, Germany). An aliquot of 120ng of cDNA was used for gene expression analysis by quantitative polymerase chain reaction (qPCR) in the ABI 7500 Sequence Detection System (Applied Biosystem, Foster City, CA, USA) using specific primers for Stathmin 1 (FW: AGCCCTCGGTCAAAAGAATC; RV: TTCAAGACCTCAGCTTCATGGG) and hypoxanthine phosphoribosyltransferase 1 (HPRT1) (FW: GAACGTCTTGCTCGAGATGTGA; RV: TCCAGCAGGTCAGCAAAGAAT) and the Maxima Sybr green qPCR system (MBI Fermentas). HPRT1 was used as the gene reference. Reaction conditions for RNA extraction, cDNA synthesis and qPCR were performed according to the manufactures’ instructions. A negative ‘no template control’ was included for each primer pair. The dissociation protocol was performed at the end of each run to check for nonspecific amplification. Three replicas were run on the same plate for each sample. The relative gene expression was calculated using the equation, 2−ΔΔCT.11 Additional details of qPCR experiments will be provided upon request. A statistical analysis was performed using GraphPad Prism 5 (GraphPad Software, Inc., San Diego, CA, USA). For comparisons, the Kruskal–Wallis test with Dunn's post test was used for measured variables with three levels and the chi-squared test was used for categorical variables. Cox regression was used to estimate overall survival (OS) and progression free survival (PFS). OS was defined as the time (in months) between the date of sampling and the date of death (for deceased patients) or last follow-up (for censored patients). PFS was defined as the time (in months) between the sampling and the date of the first event (symptomatic progression based on the International Myeloma Working Group criteria12 or death) or last follow-up (for censored patients). A p-value<0.05 was considered statistically significant.
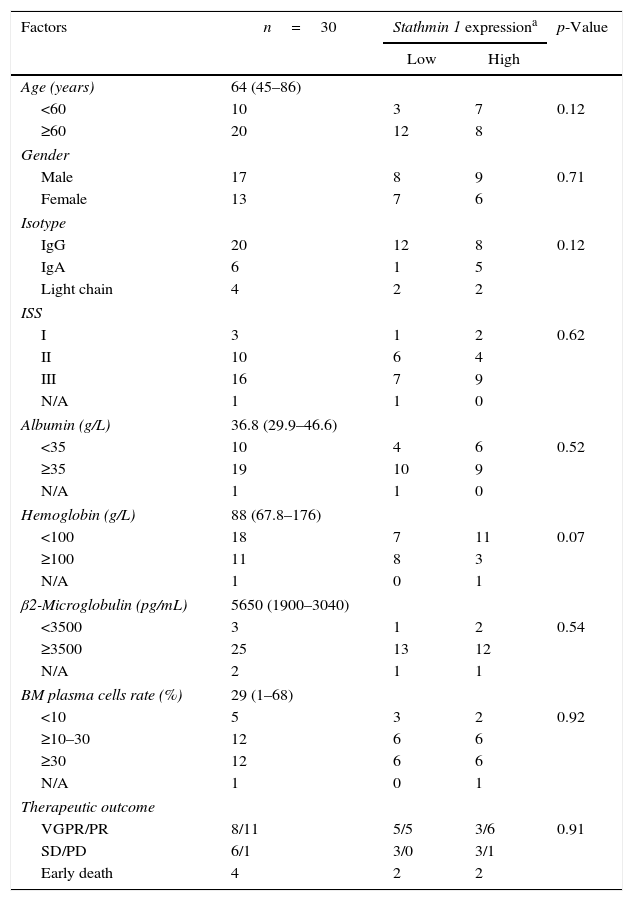
The association between clinical and laboratorial characteristics of multiple myeloma patients and Stathmin 1 expression.
| Factors | n=30 | Stathmin 1 expressiona | p-Value | |
|---|---|---|---|---|
| Low | High | |||
| Age (years) | 64 (45–86) | |||
| <60 | 10 | 3 | 7 | 0.12 |
| ≥60 | 20 | 12 | 8 | |
| Gender | ||||
| Male | 17 | 8 | 9 | 0.71 |
| Female | 13 | 7 | 6 | |
| Isotype | ||||
| IgG | 20 | 12 | 8 | 0.12 |
| IgA | 6 | 1 | 5 | |
| Light chain | 4 | 2 | 2 | |
| ISS | ||||
| I | 3 | 1 | 2 | 0.62 |
| II | 10 | 6 | 4 | |
| III | 16 | 7 | 9 | |
| N/A | 1 | 1 | 0 | |
| Albumin (g/L) | 36.8 (29.9–46.6) | |||
| <35 | 10 | 4 | 6 | 0.52 |
| ≥35 | 19 | 10 | 9 | |
| N/A | 1 | 1 | 0 | |
| Hemoglobin (g/L) | 88 (67.8–176) | |||
| <100 | 18 | 7 | 11 | 0.07 |
| ≥100 | 11 | 8 | 3 | |
| N/A | 1 | 0 | 1 | |
| β2-Microglobulin (pg/mL) | 5650 (1900–3040) | |||
| <3500 | 3 | 1 | 2 | 0.54 |
| ≥3500 | 25 | 13 | 12 | |
| N/A | 2 | 1 | 1 | |
| BM plasma cells rate (%) | 29 (1–68) | |||
| <10 | 5 | 3 | 2 | 0.92 |
| ≥10–30 | 12 | 6 | 6 | |
| ≥30 | 12 | 6 | 6 | |
| N/A | 1 | 0 | 1 | |
| Therapeutic outcome | ||||
| VGPR/PR | 8/11 | 5/5 | 3/6 | 0.91 |
| SD/PD | 6/1 | 3/0 | 3/1 | |
| Early death | 4 | 2 | 2 | |
ISS: International Staging System; BM: bone marrow; VGPR: very good partial response; PR: partial response; SD: stable disease; PD: progressive disease.
The expressions of Stathmin 1 transcripts were similar between healthy donors (median: 1.00; range: 0.28–1.84), and MM (median: 0.86: range: 0.30–2.89) and PCL (median: 0.79; range: 0.41–4.38) patients (p-value >0.05; Figure 1A). To evaluate the correlation of Stathmin 1 expression with clinical and laboratorial factors further, MM patients were divided into two groups based on median Stathmin 1 levels: high Stathmin 1 expression (median: 1.43; range: 0.89–2.89) and low Stathmin 1 expression (median: 0.62; range: 0.30–0.83). In our cohort of MM patients, no associations were observed between Stathmin 1 expression and clinical factors, laboratorial factors or therapy response ratios (Table 1). Stathmin 1 expression did not affect PFS (low Stathmin 1 expression versus high Stathmin 1 expression – hazard ratio: 1.08; 95% confidence interval: 0.46–2.53; p-value=0.87) nor OS (low Stathmin 1 expression versus high Stathmin 1 expression – hazard ratio: 0.77; 95% confidence interval: 0.28–2.18; p-value=0.68) (Figure 1B and C).
 Quantitative polymerase chain reaction analysis of Stathmin 1 mRNA expression in bone marrow cells from healthy donors, and from patients with multiple myeloma (MM) or plasma cell leukemia (PCL). The hypoxanthine phosphoribosyltransferase 1 gene was used as the reference gene and a healthy donor was used as a calibrator sample. Horizontal lines indicate medians. Progression free survival (B) and overall survival (C) of MM patients stratified by median Stathmin 1 expression. p-Values were calculated by the Long-rank test.")
Stathmin 1 expression in plasma cell neoplasms. (A) Quantitative polymerase chain reaction analysis of Stathmin 1 mRNA expression in bone marrow cells from healthy donors, and from patients with multiple myeloma (MM) or plasma cell leukemia (PCL). The hypoxanthine phosphoribosyltransferase 1 gene was used as the reference gene and a healthy donor was used as a calibrator sample. Horizontal lines indicate medians. Progression free survival (B) and overall survival (C) of MM patients stratified by median Stathmin 1 expression. p-Values were calculated by the Long-rank test.
In summary, our findings suggest that Stathmin 1 expression is not differently expressed in plasma cell neoplasms and has no impact upon MM outcomes when considered as an isolated factor. These results highlight that Stathmin 1 overexpression may be linked to high proliferate hematological malignancies as MM is characterized by slow proliferation of malignant plasma cells in the bone marrow.13,14 Future studies using larger cohorts and functional investigations are necessary before disregarding the involvement of Stathmin 1 in the malignant phenotype of plasma cell neoplasms.
Conflict of interestThe authors declare no conflicts of interest.

