
This study aimed to define the sex-divided reference intervals for platelet indices (mean platelet volume (MPV), platelet distribution width (PDW), platelet large cell ratio (P-LCR) and plateletcrit (PCT)) on the Sysmex XN-10.
MethodsA total of 2376 samples were assayed for full blood count on the Sysmex XN-10 haematology analyzer. After removing the outliers, reference intervals were calculated using the mean±2SD. The P value 0.05 was adopted to denote statistical significance.
ResultsThere was a statistical significance (α=0.05) between sex-divided reference intervals for MPV (p=0.007), P-LCR (p=0.015) and PCT (p<0.001), thus separate reference intervals were calculated for these indices, with orientation to the sex-divisions as follows: MPV, 9.1–13.0fL [males] and 9.2–12.8fL [females]; P-LCR, 17.6–47.0% [males] and 17.8–47.8% [females]; and PCT, 0.16–0.35% [males] and 0.18–0.37% [females]. No significance was found between sex-divided reference intervals for the PDW (p=0.838), therefore a reference interval for total individuals was calculated for this platelet measurement as 9.3–17.3fL.
ConclusionThis study showed comparable reference intervals, using the Sysmex XN-10, with the previous literature. It determined the need to define sex-specific reference intervals for the MPV, P-LCR and PCT, but not for the PDW. These reference intervals will allow for low and high values to be facilitated in order to do further research and guide platelet disorder management.
The introduction of automated clinical haematology analyzers has enabled accurate, precise and high throughput performance1 and has made new parameters available which had hitherto been undetermined.2 The latest generation of automated haematology analyzers, the Sysmex XN-10, is widely used in several clinical laboratories in the UK and can determine a vast array of novel and innovative platelet indices determined together in an automatic full blood count (FBC) profile over and above the platelet count. These platelet indices are related to morphology and thrombopoiesis3 and include the mean platelet volume (MPV), platelet distributing width (PDW), platelet large cell ratio (P-LCR) and plateletcrit (PCT).4
The MPV is the measure of thrombocyte volume, which is analyzer-calculated and usually increases when platelet production is decreased.3 The PDW is an indicator of volume dispersion in platelet size, which increases when platelet anisocytosis is present.5 The P-LCR is an indicator of circulating platelets that are larger than 12fL, and has been used to monitor the activity of platelets.6 The PCT is the platelet-occupied volume reflecting platelet mass and calculated using the formula PCT=plateletcount×MPV/10,000.7–9 The MPV and PDW are reported in femtolitres (fL) while the other two platelet indices, the P-LCR and PCT, are reported as a percentage (%).
The potential diagnostic applications of these indices have broadened beyond the differential diagnosis of platelet disorders. Variations in the MPV and PDW have been associated with cardiovascular, autoimmune and inflammatory diseases,10–12 while the enhanced P-LCR has been particularly useful in relation to antiplatelet antibodies,10–15 and the PCT has been shown to act as a biomarker for determining active Crohn's disease with a cut-off value of 0.28%.16
Despite the relative ease in obtaining these platelet indices, the principle underlying their measurement influences the results and instrument heterogeneity poses a challenge to the comparison of results between analytical platforms.3 Accordingly, there is evidence that reference intervals established by different manufacturers may not be suitable across laboratories and therefore local reference intervals should be established.17–19 The aim of the current study was to determine the need for sex-divided reference intervals for the MPV, PDW, P-LCR, and PCT in a UK population, for the first time, using the Sysmex XN-10 automated haematology analyser.
Materials and methodsEthics, sample requirement and inclusion criteriaThe current study obtained a favorable opinion from the National Research Ethics Service (NRES). Whole-blood venous samples from individuals ≥16 years old were collected in EDTA K2 Vacutainer tubes and mixed gently before testing for the FBC in the Department of Haematology at Homerton University Hospital, using the Sysmex XN-10 analyzer (Sysmex, Kobe, Japan). All FBC tests were performed within 8h post-collection in accordance with standard acceptable laboratory protocols. A total of 2376 samples were assayed for platelet indices (MPV, PDW, P-LCR, and PCT) with FBC parameters within the local reference ranges as follows: haemoglobin, 130–180g/L and 115–165g/L; red blood cell count, 4.50–6.50×10¹²/L and 3.80–5.80×10¹²/L; haematocrit, 0.40–0.54L/L and 0.37–0.47L/L, for males and females, respectively; mean corpuscular volume, 80–98fL; mean corpuscular haemoglobin, 27–32pg; mean corpuscular haemoglobin concentration, 310–350g/L; red blood cell distribution width, 10–14%; platelet count, 150–400×109/L; white blood cell count, 4.0–11.0×10⁹/L; neutrophil count, 2.0–7.5×10⁹/L; lymphocyte count, 1.0–4.0×10⁹/L; monocyte count, 0.2–1.0×10⁹/L; eosinophil count, 0.0–0.4×10⁹/L, and; basophil count, 0.0–0.1×10⁹/L. Whenever routine FBC analysis is performed, the Sysmex XN-10 analyzer obligatorily generates these platelet indices (MPV, PDW, P-LCR, and PCT), which are not reported on the FBC profile ordered by the clinicians. Internal quality procedures were in place in validating the quality of the results.
Exclusion criteria and statistical analysisData was collected and analyzed using Microsoft office Excel (2013) and RStudio (Version 0.99.903). Statistical outliers (IQR or >Q3+1.5IQR20) were removed. The distributional assumption for a data set was visually estimated using histograms and QQ plots. All reference intervals were calculated using the mean±2SD. Independent t-tests were performed to determine whether there was a statistical significance between platelet indices in males and females. The P value ≤0.05 was adopted to denote statistical significance.21
Analysis of platelet indicesPlatelet indices are calculated using the following formulae: MPV (fL)=plateletcrit/platelet count; PDW (fL)=the distribution width at the level of 20% with the peak of the histogram being at 100%; P-LCR=the percentage of platelets larger than 12fL, and; PCT=the ratio of the overall platelet volume to the overall blood volume in an individual.14
ResultsAfter removing 20 statistical outliers, the platelet indices of 2356 individuals (791 males and 1565 females; age range from 16 to 91 years), with all FBC parameters within the local reference ranges, were analysed on the Sysmex XN-10 analyzer. The distribution of all platelet indices was Gaussian, showing approximately normally distributed histograms and QQ plots by visual examination; hence, a parametric method (mean±2SD) was used to calculate the reference intervals for all platelet indices.21
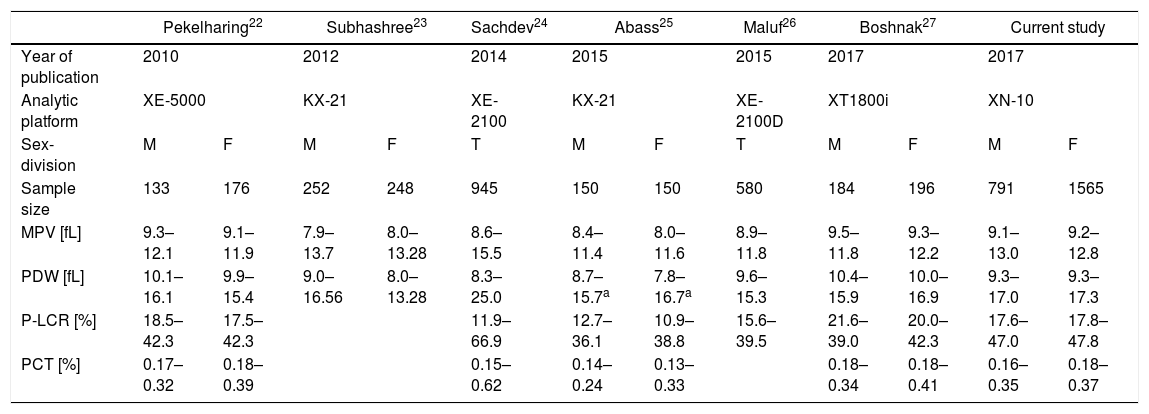
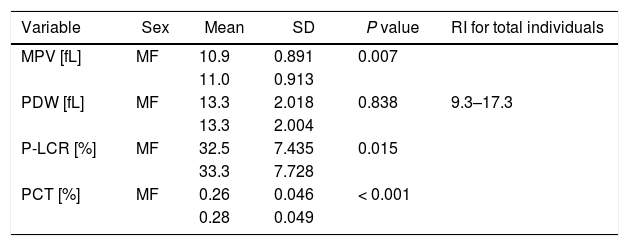
The reference intervals (mainly sex-divided) of platelet indices from six recent studies, including the current study, are presented in Table 1. The data obtained in these studied compared well with the current study. Table 2 shows the mean, SD, and P values of platelet indices for sex-divided subgroups and reference interval data for total individuals only for the PDW from the current study.
Comparison of reference intervals for platelet indices, using the Sysmex analytical platforms from 2012 to date.
| Pekelharing22 | Subhashree23 | Sachdev24 | Abass25 | Maluf26 | Boshnak27 | Current study | ||||||
|---|---|---|---|---|---|---|---|---|---|---|---|---|
| Year of publication | 2010 | 2012 | 2014 | 2015 | 2015 | 2017 | 2017 | |||||
| Analytic platform | XE-5000 | KX-21 | XE-2100 | KX-21 | XE-2100D | XT1800i | XN-10 | |||||
| Sex-division | M | F | M | F | T | M | F | T | M | F | M | F |
| Sample size | 133 | 176 | 252 | 248 | 945 | 150 | 150 | 580 | 184 | 196 | 791 | 1565 |
| MPV [fL] | 9.3–12.1 | 9.1–11.9 | 7.9–13.7 | 8.0–13.28 | 8.6–15.5 | 8.4–11.4 | 8.0–11.6 | 8.9–11.8 | 9.5–11.8 | 9.3–12.2 | 9.1–13.0 | 9.2–12.8 |
| PDW [fL] | 10.1–16.1 | 9.9–15.4 | 9.0–16.56 | 8.0–13.28 | 8.3–25.0 | 8.7–15.7a | 7.8–16.7a | 9.6–15.3 | 10.4–15.9 | 10.0–16.9 | 9.3–17.0 | 9.3–17.3 |
| P-LCR [%] | 18.5–42.3 | 17.5–42.3 | 11.9–66.9 | 12.7–36.1 | 10.9–38.8 | 15.6–39.5 | 21.6–39.0 | 20.0–42.3 | 17.6–47.0 | 17.8–47.8 | ||
| PCT [%] | 0.17–0.32 | 0.18–0.39 | 0.15–0.62 | 0.14–0.24 | 0.13–0.33 | 0.18–0.34 | 0.18–0.41 | 0.16–0.35 | 0.18–0.37 | |||
T: total individuals; M: males; and F: females.
Although reported separately, the PDW did not show a significant difference between males and females in Abass et al.25
P values, sex-specific means and standard deviations for platelet indices [MPV, PDW, P-LCR, PCT], and the PDW reference interval for total individuals on the Sysmex XN-10 in samples with FBC parameters within the local reference ranges.
| Variable | Sex | Mean | SD | P value | RI for total individuals |
|---|---|---|---|---|---|
| MPV [fL] | MF | 10.9 | 0.891 | 0.007 | |
| 11.0 | 0.913 | ||||
| PDW [fL] | MF | 13.3 | 2.018 | 0.838 | 9.3–17.3 |
| 13.3 | 2.004 | ||||
| P-LCR [%] | MF | 32.5 | 7.435 | 0.015 | |
| 33.3 | 7.728 | ||||
| PCT [%] | MF | 0.26 | 0.046 | < 0.001 | |
| 0.28 | 0.049 |
There was a statistically significant difference in the reference intervals for: MPV, 9.1–13.0fL [males] and 9.2–12.8fL [females] (p=0.007); P-LCR, 17.6–47.0% [males] and 17.8–47.8% [females] (p=0.015); and PCT, 0.16–0.35% [males] and 0.18–0.37% [females] (p<0.001), therefore sex-divided reference intervals for these indices are warranted. However, the reference interval between males and females for the PDW did not show a statistical difference (p=0.838), therefore a total reference interval was calculated for this particular parameter without sex division at 9.3–17.3fL (Table 2).
DiscussionPlatelets are derived from the megakaryocytes and are highly complex, anucleate and the smallest cell type in the blood. The number, size, distribution, and structure of platelets are routinely evaluated in the peripheral blood smear under a light microscope. This approach has several limitations that may lead to misinterpretations and, ultimately, misdiagnoses. With the advent of automated haematology cell counters, accurate and precise measurements can be attained in a timely manner,27 nevertheless, due to different measuring principles across various laboratory machines and varying population dynamics,19 evidence continues to support the need to establish local reference intervals.17–19 The current study was performed with the objective of addressing the need for local sex-divided reference intervals for platelet indices, namely MPV, PDW, P-LCR, and PCT, using the latest Sysmex analytical module XN-10.
The age range of this study population was between 16 to 91 years, comprising both males and females. The study population was categorized according to the sex. The reference intervals for the platelet indices did not show much difference from the previously published studies, using the XE-5000,22 KX-21,23,25 XE-2100,24,26 and XT1800i,27 but Sachdev et al.24 indicated a wider distribution at the upper and lower extremes, exceeding the distribution of the current study in all platelet indices. This may be related to the use of a different instrument (i.e., different principle, reagents, and calibrations), narrower and younger age range, different male to female ratio, with male predominance, difference in time between blood collection and FBC analysis, variation in the pre-analytical variables (i.e., the method of venepuncture), and/or a less diverse ethnicity origin.
The MPV reference intervals for males and females were 9.1–13.0fL and 9.2–12.8fL, respectively, which were close to those that had been previously reported. Sex-divided reference intervals for the MPV showed a statistical significance (p=0.007) in our study; this result is in accordance with at least four previous studies.22,23,28,29
Unlike a number of previous studies,9,22,23,27 we did not find a statistically significant sex-based difference for the PDW (p=0.838), and therefore, calculated a reference interval as 9.3–17.3fL, independent of sex. Our finding correlated with some researchers, who also did not find a sex-divided statistical significance regarding the PDW.1,2,25,26
Our study identified a statistical significance in the P-LCR reference intervals between the two sex (p=0.015), therefore separate reference intervals were calculated for males and females as 17.6–47.0% and 17.8–47.8%, respectively. This finding is in agreement with Pekelharing et al.,22 who also reported reference intervals determined according to differences between the sexes (p=0.0004).
The current study also showed statistical significance (p≤0.001) in reference intervals between sexes for the PCT and therefore different intervals were calculated for males and females as follows: 0.16–0.35% and 0.18–0.37%, respectively. This finding closely resembles the reference intervals reported by Boshnak27 and Botma et al.2 A previous study30 likewise noted a statistically higher median PCT in females compared to males which is in keeping with the current study. However, Abass et al.25 reported lower results and Sachdev et al.24 reported widely distributed results for the PCT relative to the present study, which could be due to different pre-analytical procedures, analytical platforms, reagents, and genetic base of the population studied; Abass et al.25 used the Sysmex KX-21 and enrolled a relatively smaller number of Sudanese subjects and Sachdev et al.24 used the Sysmex XE-2100 and assayed samples from voluntary blood donations from a younger Indian population, with male predominance.
Better knowledge of platelet disorders is attained when an automated platelet count is combined with platelet indices.1 In order to achieve this, we reported reference intervals for the platelet indices, namely the MPV, PDW, P-LCR, and PCT, to allow low and high values to be facilitated in order to do further research and guide platelet disorder management. These indices are part of the standard FBC and do not add any additional costs, and therefore do not put any testing burden on the patients, nor on the clinicians.
We found a statistically significant difference in reference ranges between the sexes for the MPV, P-LCR, and PCT, necessitating sex-divided reference intervals for these parameters, but no significance was noted for the PDW, thus a reference interval for total individuals was calculated for this platelet measurement. Overall, compared with the previously reported reference intervals, our study showed comparable reference intervals for platelet indices. Further large and high-quality multi-center, multi-ethnic and multi-gender prospective studies are needed to validate the use of these platelet indices in routine clinical practice.
ConclusionsThere were substantial differences between the sexes for all platelet indices, save the PDW. While a reference interval for total individuals was calculated for the PDW, separate sex-dependent reference intervals were determined for the MPV, P-LCR, and PCT.
Conflicts of interestThe authors declare no conflicts of interest.
The authors would like to thank the staff at the Department of Haematology at Homerton University Hospital NHS Foundation Trust for their assistance during this project.


