


Sarcopenia, characterized by decreased muscle mass, strength, and function, is associated with adverse outcomes. The prevalence of sarcopenia and the effect of the inflammatory response on muscle strength loss in children undergoing hematopoietic stem cell transplantation (HSCT) are unknown. This study aimed to estimate the prevalence of sarcopenia on admission and its associated clinical factors in children and adolescents undergoing HSCT and to determine the extent to which the systemic inflammatory response during hospitalization affects muscle strength.
MethodThis was a prospective study of patients aged 6–18 years old undergoing HSCT. The outcome variables were the prevalence of sarcopenia on admission (loss of strength and skeletal muscle mass) and the loss of handgrip strength during hospitalization. Potential explanatory variables included age, sarcopenia, nutritional status and systemic inflammation as measured by serum C-reactive protein, albumin and ferritin concentrations.
ResultsEighty patients with a mean age of 11.5 (± 3.5) years were included. The main diagnoses were acute lymphocytic leukemia, acute myeloid leukemia and aplastic anemia. Eleven percent of patients had sarcopenia upon admission. Female sex, sarcopenia on admission (β coefficient: 0.70; 95% CI: -1.30 to −0.12; p-value = 0.018) and serum C-reactive protein concentration (β coefficient: −0.10; 95% CI: −0.16 to −0.04; p-value = 0.001) were associated with handgrip strength loss from admission to 14 days after HSCT.
ConclusionSarcopenia on admission and the degree of systemic inflammatory response are associated with decreased handgrip strength during hospitalization in pediatric patients undergoing HSCT. Further studies using the same criteria for diagnosing sarcopenia are required to enhance our understanding of these relationships.
Children undergoing hematopoietic stem cell transplantation (HSCT) may present a previous catabolic state. In addition to the underlying disease and increased nutritional needs due to the developmental stage, the treatment itself can negatively impact the child's nutritional status. 1,2 Factors such as chemotherapy toxicity, surgical requirements and infections elicit a systemic inflammatory response and protein catabolism, resulting in a decrease in muscle mass, which, in combination with loss of strength and/or function, characterizes sarcopenia. 2 Sarcopenia has been associated with adverse clinical outcomes.3 This term was originally used to describe age-related loss of muscle mass in older adults, but its definition was expanded in 2010 by the European Working Group on Sarcopenia in Older People (EWGSOP)4 to include muscle function evaluations based on strength and functional capacity. Beyond being non-invasive and inexpensive, these parameters are more effective in predicting clinical outcomes than muscle mass alone. 5 Therefore, reduced muscle mass without functional assessment cannot be considered sarcopenia.6 Studies investigating the relationship between muscle mass loss and clinical outcomes in children with cancer have not yet adopted the EWGSOP criteria for sarcopenia.
The prevalence of sarcopenia, as defined by the EWGSOP or EWGSOP27 (revised EWGSOP), in pediatric patients undergoing HSCT and the extent to which the inflammatory response affects the strength loss in children throughout their hospitalization are unknown. Obtaining this information could enable early and specific interventions to reduce the prevalence of sarcopenia in these patients. This study aimed to estimate the prevalence of sarcopenia and its associated clinical factors at hospital admission in children and adolescents undergoing HSCT and to determine the extent to which the systemic inflammatory response during hospitalization affects muscle strength as measured by grip strength.
Materials and methodsThis was a prospective cohort study with a convenience sampling of patients consecutively admitted to the Grupo de Apoio ao Adolescente e à Criança com Câncer (GRAACC) hospital for HSCT treatment between May 2019 and February 2023. After this period, there were data losses due to restricted access to the sector, infection, and quarantine of patients exposed to Covid-19. Eligible patients were HSCT patients aged between 6 and 18 years old regardless of their underlying disease. Patients with cognitive and psychomotor impairment (motor impossibility to perform the strength test due to central nervous system impairment), Down syndrome, previous HSCT, or without remission of the onco-hematological disease were excluded.
The project was approved by the Research Ethics Committees of the Universidade Federal de São Paulo and the GRAACC hospital, where the data were collected (Approval number 04,711,818.3.0000.5505). 8 A Free and Informed Consent Term signed by the guardian was used, as well as the Term of Assent when applicable.
Study variablesThe outcome variables were sarcopenia on admission and loss of strength during hospitalization. Sarcopenia was defined as loss of strength, measured by handgrip strength (HGS) associated with loss of skeletal muscle mass, measured by mid-arm circumference (MAMC). The following variables were considered exposure variables for sarcopenia: sex, age, time of treatment between diagnosis and HSCT, ferritin and albumin concentrations and the body mass index for age (BMI/A) z-score on admission. Potential associations between sarcopenia and the time of engraftment, length of hospital stay, need for intensive care, infection and mortality were also evaluated.
The variation in muscle strength during hospitalization was defined by the difference between the z scores of the HGS on admission and on Day +14. The exposure variable for this outcome was the systemic inflammatory response as measured by the serum C-reactive protein (CRP) concentration on admission and Day +14. Potential variables associated with this outcome were serum albumin and ferritin concentrations on admission, age, sex, BMI/A z-score, sarcopenia diagnosis on admission and steroid use.
Anthropometric and muscle strength assessmentA baseline hydraulic dynamometer (model 12–0241) was used for the HGS analysis. Measurements were performed twice in the dominant hand with the highest value being considered. Values of HGS were transformed into a z-score (sHGS) using the mean and standard deviation (SD) of healthy Brazilian children and adolescents as reference. 9 In this study, for HGS, a z-score cutoff point of <−1 was employed as an indicator of strength loss and for abnormal MAMC a value below the 5th percentile for age was used, as proposed by Frisancho.10 Muscle strength measurements were performed by the first author and arm anthropometry measurements by trained dietitians on the staff.
For nutritional status classification, anthropometric indexes of weight (kg) and height (m) were compared to the World Health Organization (WHO) standards. Patients were considered malnourished when they presented a z-score for BMI/A lower than −2. The z-scores were calculated using the WHO Anthroplus software. 11
Dietary assessmentThe adequacy of energy intake was calculated individually according to Schofield equation for basal metabolic rate,12 and the estimated average requirement (EAR) for protein intake was calculated for each patient according to sex and age.13 The calculations were made based on dietary recalls conducted by the dietitian staff.
Laboratory assessmentThe clinical and laboratory data collected and used were those of routine care, with no need for further evaluation. The serum concentrations of albumin, ferritin, and CRP evaluated in the study were part of the internal operating procedures of routine laboratory assessments. Serum albumin was quantified using a colorimetric method, with hypoalbuminemia defined as a serum albumin concentration lower than 3.5 g/dL. The CRP concentration was evaluated using turbidimetry with a value equal to or less than 10 mg/dL considered the normal reference. 14 Serum albumin and ferritin were collected at the time of patient admission, while CRP was collected at admission, on Day −1, Day +7, and Day +14 to assess its response over time.
InfectionThe presence of infection and sepsis during hospitalization was identified from patients’ medical records.15,16
Statistical analysisCategorical variables are expressed as frequencies and percentages. Continuous quantitative variables are expressed as means and SD or median and interquartile range, depending on the nature of the distribution. A two-tailed t-test was used to compare means between groups. Logistic regression was used to verify the association between the pre-HSCT treatment time and sarcopenia. Linear regression was used to evaluate the association between sarcopenia, length of hospital stay, and time of engraftment.
Generalized estimating equations (GEE) with exchangeable correlation structures and Gaussian distribution were used to analyze the association between potential exposure variables and sHGS at different study timepoints. Variables that were associated with the outcome with a p-value <0.15 in the univariate analysis were selected for multivariate analysis. In the multivariate analysis models, associations with a p-value <0.05 were considered significant. Interactions between the remaining variables in the final model were tested. Results are expressed as β-coefficients and 95% confidence intervals (95% CIs). The data were analyzed using Stata MP 14.0 software (Stata Corporation, College Station, TX, USA).
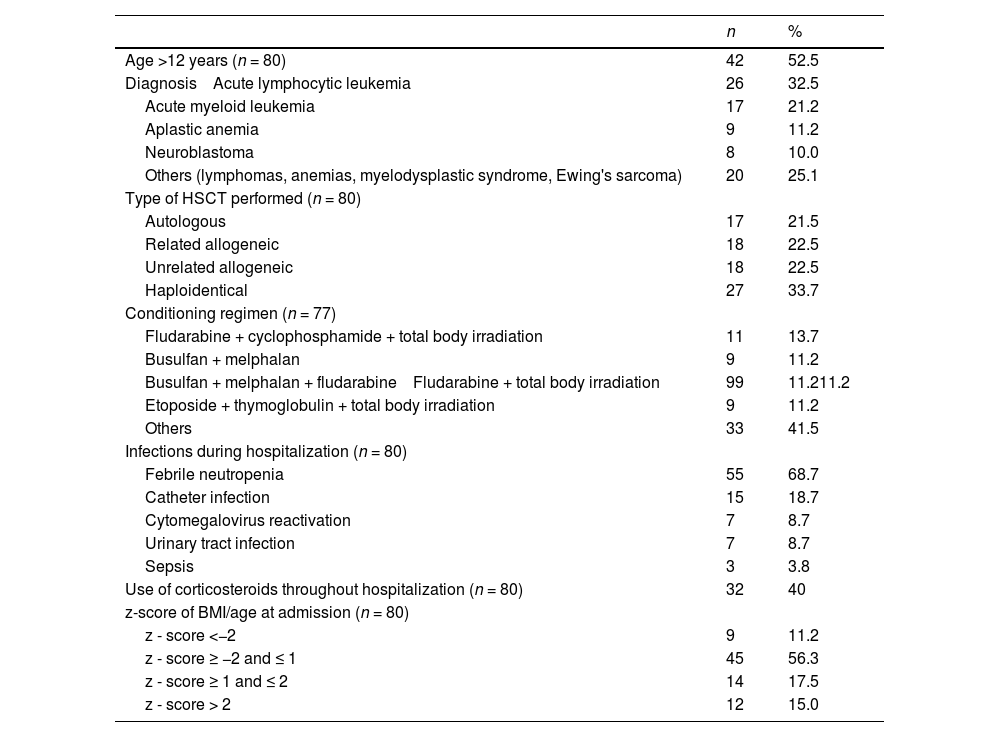
ResultsDescriptive analysis of dataThe sample consisted of 80 patients, 46 (57.5%) of whom were male. The mean age was 11.5 (± 3.5) years. The median time between diagnosis of the underlying disease and transplantation was 19.5 (interquartile range – IQR: 9.7–39.3) months. The mean time of hospital stay was 28.7 (± 10) days and the time for marrow engraftment was 16 (± 4.4) days. The mortality rate during hospitalization was 3.9% (3/77). Table 1 shows the main clinical characteristics of the study participants.
Clinical and demographic characteristics of the study sample.
*Data expressed in absolute frequency (n) and relative frequency.
On admission, the sample median for the BMI/A z-score was 0.26 (IQR: −0.79 to 1.46) and for height/age (H/A) it was −0.09 (IQR: −0.84 to 0.54).
The median adequacy for protein and energy intake were 145% (IQR: 104 to 188) and 92% (IQR: 63 to 114), respectively.
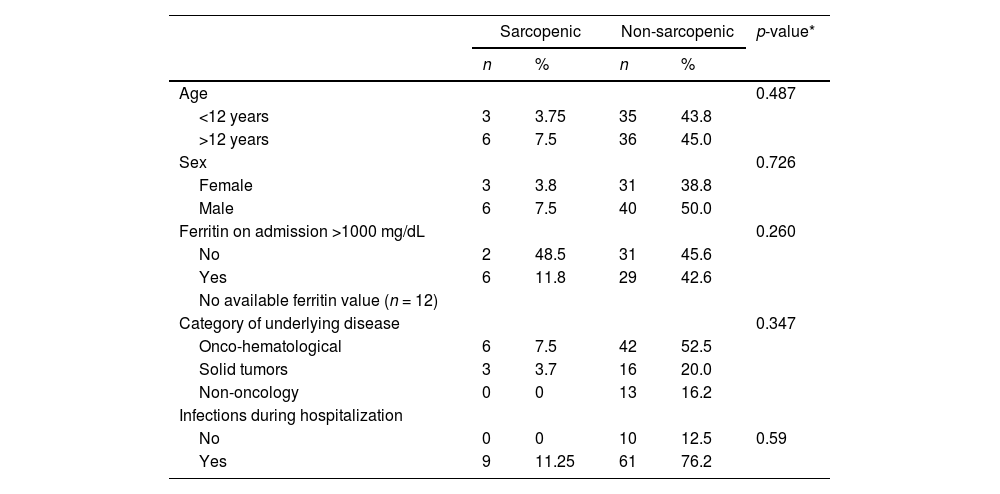
SarcopeniaSarcopenia, defined as decreased HGS and low muscle reserve as measured by the MAMC, was observed in 11.2% (9/80) of the patients on hospital admission. Ten of 80 (12.5%) children and adolescents had a MAMC <5th percentile and 37.5% (30/80) already had a MAMC <25th percentile, which is a nutritional risk parameter. Table 2 shows the clinical and demographic characteristics of patients according to the presence or absence of sarcopenia.
Clinical and demographic characteristics according to the presence or absence of sarcopenia.
| Sarcopenic | Non-sarcopenic | p-value* | |||
|---|---|---|---|---|---|
| n | % | n | % | ||
| Age | 0.487 | ||||
| <12 years | 3 | 3.75 | 35 | 43.8 | |
| >12 years | 6 | 7.5 | 36 | 45.0 | |
| Sex | 0.726 | ||||
| Female | 3 | 3.8 | 31 | 38.8 | |
| Male | 6 | 7.5 | 40 | 50.0 | |
| Ferritin on admission >1000 mg/dL | 0.260 | ||||
| No | 2 | 48.5 | 31 | 45.6 | |
| Yes | 6 | 11.8 | 29 | 42.6 | |
| No available ferritin value (n = 12) | |||||
| Category of underlying disease | 0.347 | ||||
| Onco-hematological | 6 | 7.5 | 42 | 52.5 | |
| Solid tumors | 3 | 3.7 | 16 | 20.0 | |
| Non-oncology | 0 | 0 | 13 | 16.2 | |
| Infections during hospitalization | |||||
| No | 0 | 0 | 10 | 12.5 | 0.59 |
| Yes | 9 | 11.25 | 61 | 76.2 | |
Sarcopenia on admission was not associated with pre-HSCT treatment time (p-value = 0.284), engrafting time (p-value = 0.421) or length of hospital stay (p-value = 0.608).
Systemic inflammatory responseTable 3 shows the values of laboratory tests for serum albumin, ferritin and CRP, as well as the evolution of CRP serum concentrations.
Laboratory test values during hospitalization.
Data are expressed as medians and interquartile ranges (IQR), except for albumin values. *Mean (SD) **Significant differences among timepoints (p-value <0.001). Generalized estimating equations.
Table 4 shows the values of handgrip strength and their respective z-scores on admission and on Day +14. The strength loss from admission to Day +14 was greater in girls than in boys (p-value = 0.048).
Evolution of handgrip strength at the time of admission and on Day +14 after transplantation and their respective z-scores.
| Variable | Admission (n=80) | Day +14 (n=65) | p-value | ||
|---|---|---|---|---|---|
| SHGS (median- IQR) | −1.14 | −1.96; 0.35 | −1.59 | −2.44; −0.64 | <0.001a |
| z-score <−1 e ≥ −2 (n-%) | 27 | 33.7 | 17 | 26.1 | |
| z-score <−2 (n-%) | 17 | 21.2 | 26 | 40.0 | |
sHGS, Handgrip Strength z-score.
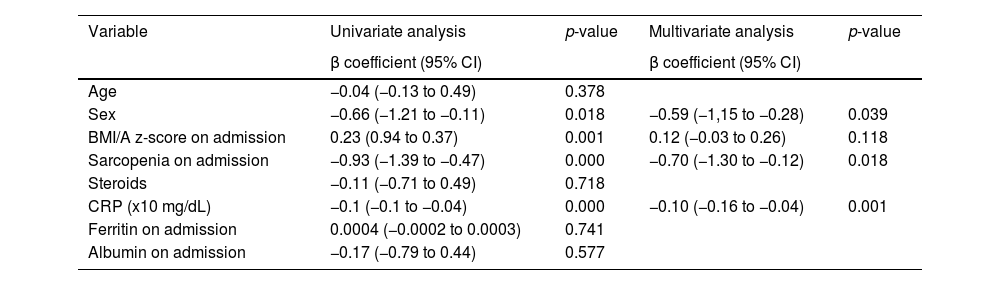
The results of the analysis of potential factors associated with sHGS are shown in Table 5. Sex, sarcopenia diagnosis on admission, and serum CRP concentration were associated with sHGS. CRP concentration was independently associated with the sHGS. The adjusted linear predictions of CRP concentration on the sHGS are shown in Figure 1. A 10 mg/dL increase in serum CRP concentration resulted in a 0.1 decrease in sHGS. Patients diagnosed with sarcopenia on admission had a reduction of 0.70 in the sHGS compared to non-sarcopenic patients.
Analysis of the potential factors associated with sHGS at two-time points (admission and 14 days after transplant – D + 14).
95% CI: 95% confidence interval; sHGS: handgrip strength z-score.
BMI/A: Body Mass Index/Age; CRP: C-reactive protein. Generalized estimating equations.

In this study, we examined the prevalence of sarcopenia among pediatric patients undergoing HSCT using the criteria recommended by the EWGSOP2.7 Approximately 11% of patients met the sarcopenia criteria upon hospital admission, defined by a MAMC <5th percentile and a sHGS less than −1.
A cross-sectional case series study conducted by Rezende et al.17 was the first to adopt the EWGSOP2 criteria (loss of muscle mass and HGS) for diagnosing sarcopenia in children. In a sample of 85 patients with chronic liver disease aged 6 to 19 years, the authors identified a 40% prevalence of sarcopenia in outpatient clinics. To evaluate muscle and strength loss, measured by dual-energy X-ray absorptiometry (DXA) and HGS, respectively, the authors adopted values below the median values found in their sample as cutoffs for DXA and HGS, which probably explains the higher prevalence of sarcopenia in their study compared to the current study. In the cited study, the prevalence rates of muscle mass and strength deficits were 50.6% and 54.1%, respectively. In contrast, this study identified 12.5% of patients with a MAMC <5th percentile and approximately 34% of patients with sHGS <−1 on admission. However, it should be noted that patients in this study had different underlying medical conditions. Similar to their study, the diagnosis of sarcopenia was not associated with sex or nutritional status classification.17
A retrospective study by Suzuki et al.18 assessed sarcopenia by measuring the psoas muscle area in children with acute lymphoblastic leukemia (ALL) before and after induction treatment. In the cited study, 29.7% of the patients were classified as sarcopenic based on a muscle mass loss index below the 25 quartile. A recent study of children who underwent allogeneic HSCT was conducted by the same authors, who assessed muscle mass loss using computed tomography at the time of diagnosis and pre-transplantation. Muscle loss, defined as a muscle mass loss index pre-transplantation/baseline of the psoas muscle area lower than 0.85 was identified in 41.5% of the patients. 19 Comparing the results observed in the current study with those of the cited studies is difficult because different criteria were used to define sarcopenia
Having sarcopenia on admission was associated with a decrease in HGS in the adjusted analysis. The diagnosis of sarcopenia resulted in a decrease in 0.70 sHGS, which is also clinically significant. Additionally, HSG loss was associated with the inflammatory response. These findings confirm the data of Mckirdy et al.20 who found an inverse correlation between CRP and HGS in a sample of 236 sick children with different diagnoses. During systemic inflammatory responses, cytokines such as interleukin-6 (IL-6) and tumor necrosis factor-alpha (TNF-α) are released by the immune cells. These cytokines activate signaling pathways that cause skeletal muscle breakdown resulting in wasting and/or loss of muscle mass and function.21 Similar to this study, these authors did not observe a correlation between HGS and length of hospital stay. 20
Males had higher sHGS values than females, which is consistent with the results of a previous study that examined the HGS and nutritional status of 89 hospitalized pediatric patients with a mean age of 13 (± 3.7) years. 22 However, in the cited study, HGS measurements were expressed in kilograms, whereas this study used z-scores, making direct comparison difficult.
The BMI/A z-score on admission did not identify worsening HGS, whereas sarcopenia on admission did. This finding reinforces the concept that malnutrition and sarcopenia are distinct diagnoses. Sarcopenia can be caused by several conditions including malnutrition, lack of physical activity, chronic diseases, systemic inflammation, and aging. Although malnutrition can contribute to sarcopenia, it can also occur in eutrophic individuals.23-25
Almost one-third of patients were overweight or obese upon hospital admission. Factors associated with oncological treatment before HSCT may be related to weight gain in children and adolescents. Steroids, which were frequently used in the current sample, are commonly used in the treatment of leukemia. Their use at high doses can lead to fluid retention, increased appetite, and weight gain. Other factors that may contribute to weight gain include physical inactivity during treatment, consumption of high-calorie low-nutrient foods and emotional factors.26
This study has some limitations that should be considered. First, the possible effects of the overall diversity of the samples and types of treatment could be better identified with a larger sample of patients. Owing to the Covid-19 pandemic lockdown restrictions, anthropometric data (MAMC) for the diagnosis of sarcopenia on Day +14 could not be obtained. For the same reason, HGS measurements could not be performed in 15 patients on Day +14. In addition, some patients were weakened and could not remain in the recommended ideal position for HGS measurement; however, this is a common characteristic of these patients.
To the best of our knowledge, the operational definition of sarcopenia by the EWGSOP27 consensus was adopted for the first time in pediatric patients undergoing HSCT. Considering that the sensitivity of muscle mass and strength diagnostic criteria in pediatric populations may be influenced by age-related developmental variations, the HGS measurements were adjusted according to patient age and sex for a more accurate evaluation. It is important to note that this assessment method is inexpensive and can be easily implemented in the routine hospital practice. Another strength of this study was the prospective cohort design, which is more likely to support causality.
ConclusionSarcopenia upon admission and the intensity of the systemic inflammatory response are associated with decreased HGS during hospitalization in children and adolescents undergoing HSCT. Identifying factors related to strength loss could help in early interventions to prevent complications and improve prognosis.
Further studies using the same criteria for sarcopenia and following patients over an extended period will provide more detailed insights into the progression of sarcopenia during the post-transplant course, and the potential effects of early interventions on long-term outcomes.
All authors contributed to the study concept. All designed and analyzed the study data. CGL performed data collection under the supervision of HPL and AG. CGL wrote the manuscript, which was critically reviewed by HPL.
This study was financed in part by the Coordenação de Aperfeiçoamento de Pessoal de Nível Superior – Brasil (CAPES) – Finance Code 001


