


Children and adolescents with cancer are particularly vulnerable to malnutrition and require special attention on nutritional assessment. An adequate nutritional status during treatment is essential in reducing morbidity and mortality, being a modifiable risk factor for clinical outcomes. This study aims to determine the nutritional status of pediatric patients with cancer assessed by the nutrition team at diagnosis and evaluate its association with the overall survival.
MethodThis is a retrospective cross-sectional study of patients at the time of cancer diagnosis who had nutritional assessments when hospitalized or referred to the nutrition outpatient clinic. Nutritional status was classified by the mid-upper arm circumference (MUAC) and body mass index for age z-score (zBMI/A). The Cox regression analysis was used to determine the association between the nutritional status and overall survival, adjusting for gender, tumor group and age.
ResultsThe study included 366 patients. The prevalence of undernutrition varied from 8 to 23% and overweight, from 5 to 20%. The MUAC identified more children as undernourished than the zBMI/A in patients with solid and hematological tumors. There was no significant difference in the overall survival by malnutrition classified by the zBMI/A (p = 0.1507) or MUAC (p = 0.8135). When adjusted for gender, tumor group and age, the nutritional status classification by the zBMI/A (hazard ratio [HR], 1.27; 95% confidence interval [CI], 0.88–1.83; p = 0.209) and MUAC (HR, 0.94; 95% CI, 0.61–1.44; p = 0.773) did not impact overall survival.
ConclusionThe nutritional status at diagnosis did not significantly impact the overall survival, which suggests there may have been a protective effect by successful nutritional intervention during the subsequent care.
Of the estimated global incidence of 400,000 new cancer cases in children 0–14 years of age, over 80% live in developing countries.1,2 In Brazil, there are approximately 12,500 new cancer diagnoses in children and adolescents 1–19 years of age per year, representing the leading cause of disease mortality in this age group in the country.3 Children with cancer are particularly vulnerable to malnutrition, with reported prevalences ranging from 6 to 90% depending on the country in which the study was conducted, method used to classify nutritional status, diagnosis, timing of nutritional assessment and patient socioeconomic status.4–8
The nutritional assessment of children with cancer at diagnosis requires special attention, since the presence of organomegaly and tumor masses are frequent, which may mask the weight and consequently generate a misclassification of nutritional status. Studies have shown that arm anthropometry, such as mid-upper arm circumference (MUAC), is a good indicator of the nutritional status of pediatric cancer patients, being considered a useful, affordable, inexpensive and noninvasive method.6,9–11 Guidelines published by the International Society of Pediatric Oncology (SIOP) recommend MUAC to measure the nutritional status of children with cancer, since it is not affected by tumor mass and is well established for this purpose.11,12
There is an important gap in the literature regarding the study of the role of nutrition in pediatric oncology in developing countries, especially in Brazil, where the number of high-quality publications on the subject is scarce.13 It has been shown that adequate nutritional status during antineoplastic treatment is essential in reducing the risk of infections, toxicities, length of stay and treatment abandonment and improving survival and quality of life.8,10,14–19 Studies in children with acute lymphoblastic leukemia (ALL) have shown that remediation of compromised nutritional status during treatment results in improved survival, corroborating the hypothesis that nutritional status is a modifiable risk factor for clinical outcomes.9,16
ObjectiveThis study aims to determine the nutritional status of children and adolescents with cancer assessed by the nutrition team at diagnosis and evaluate its association with overall survival.
MethodThis study was approved by the Research and Ethics Committee under the protocol number 47478115.6.0000.0068. This is a retrospective cross-sectional study based on a convenience sample consisting of all nutritional assessments from the nutrition service database of a tertiary public hospital in São Paulo, Brazil from April 2007 to April 2016. Information on clinical outcomes (death) was updated on April 2017. This database reflects nutritional assessments of hospitalized patients, as well as outpatients who were referred to the nutritionist at diagnosis. The data collected include weight, height and MUAC. In addition, the date of birth, diagnosis, date of diagnosis and date of death were collected from medical records. For some analyses, patients were grouped by hematological, solid or central nervous system (CNS) tumor diagnosis.
Patients with a cancer diagnosis, aged 3 months to 18 years, who had a nutritional assessment within 7 days of diagnosis, were included in this study. Exclusion criteria were: (1) patients with Down or Turner syndrome, as they have pathology-specific growth curves recognized by the Brazilian Society of Pediatrics; (2) patients with previous cancer diagnosis or relapse of cancer; and (3) patients who had no MUAC recorded in the nutritional assessment.
AnthropometryWeight was measured on a digital scale; for children under 2 years old infant scales were used. Children older than 2 years were weighed standing, with weight distributed between both feet. Length was measured in children up to 2 years of age using a pediatric anthropometer with a precision scale of 0.1 cm. The measurement was performed with the child lying on a flat and straight surface, with the head and the sole of the foot resting on the equipment. In children older than 2 years, height was obtained using a wall stadiometer with a precision scale of 0.1 cm. The child was kept standing, barefoot, with the back to the wall, heels together, weight distributed between both feet, back straight, and arms extended at the side of the body. The MUAC was assessed with a flexible and inelastic graduated tape measure. The child had the arm flexed towards the chest at a 90° angle to determine the midpoint of the distance between the acromion and the olecranon. The circumference was then measured at this point with the arm extended along the body.
Classification of nutritional statusIn this text, “malnutrition” refers to both undernutrition and overweight nutritional status. Therefore, to increase statistical power undernourished and overweight patients were grouped for the survival analysis, since both nutritional conditions have been shown to impact survival evenly.16 The nutritional status was diagnosed by the following parameters: body mass index (BMI) for age z-score (zBMI/A), obtained by the World Health Organization growth curves and classified according to the proposed criteria and MUAC percentiles from the World Health Organization growth curves20 for children aged 3–60 months and percentiles obtained by Frisancho21 tables for those older than 60 months. For MUAC, the percentile (P) < 5 was considered undernutrition, 5 ≥ P < 95, normal and P ≥ 95, overweight.4 Regarding the zBMI/A, the classification of nutritional status was performed as follows:
- •
Undernutrition: z-score <−2 (moderate and severe undernutrition);
- •
Normal: z-score ≥−2 and ≤+2 for children 5 years old and younger;
- •
z-score ≥−2 and ≤ 1 for children over 5 years old (normal and risk of overweight), and;
- •
Overweight: z-score >+2 for children 5 years old and under and z-score >+1 for children over 5 years old (overweight, obesity and severe obesity).
All inpatients were screened for nutritional risk within 24 h of admission and had a complete nutritional assessment performed within 72 h of admission, including weight, height and MUAC; follow up nutritional assessments were performed every 7 days. For the outpatient clinic, a complete nutritional assessment was also contemplated upon every consultation with the nutritionist. For all patients, nutritional interventions were applied whenever judged appropriate by the nutritionist and included oral supplements and enteral and parenteral nutrition. In 2012, a nutritional therapy algorithm and protocol were developed and implemented by the institution nutrition team to standardize interventions and improve clinical care.
Statistical analysisDescriptive analyses were used for demographic, clinical and anthropometric data. Frequencies were compared using the Chi-square test or Fisher's exact test, when appropriate. To assess 10-year overall survival, curves were created by the Kaplan–Meier method. To test the equality of survival functions, the log-rank test was used. We used Cox regression analysis to determine the association between the nutritional status and overall survival, adjusting for gender, tumor group and age. Statistical analyses were performed using the Stata® software, version 15.1. The level of statistical significance of 5% was adopted.
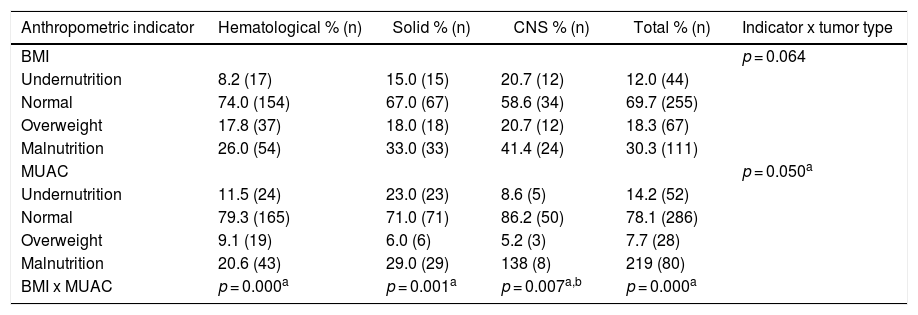
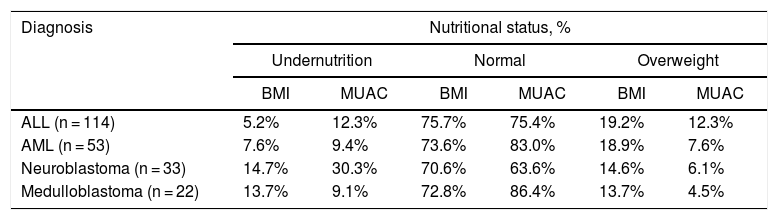
ResultsThe study included 366 patients with a mean age of 7.9 years (95% confidence interval [CI] 7.4–8.4), 55% male. Fifty-seven percent of the patients had a hematological tumor diagnosis (mean age of 8.4 years), 27% solid tumor (mean age of 7.4 years) and 16% CNS tumor (mean age of 7.1 years). Table 1 illustrates the nutritional status by tumor group of all 366 patients at diagnosis, zBMI/A and MUAC. Depending on the nutritional indicator and tumor type, the prevalence of undernutrition in the population varied from 8 to 23%, and overweight from 5 to 20%. Table 2 presents the comparison of the prevalence of nutritional status classifications by zBMI/A and MUAC percentiles in the most frequent diagnoses in the sample (greater than 5%), representing over 60% of all included patients.
Classification of the pediatric cancer patient nutritional status at diagnosis by different anthropometric indicators.
| Anthropometric indicator | Hematological % (n) | Solid % (n) | CNS % (n) | Total % (n) | Indicator x tumor type |
|---|---|---|---|---|---|
| BMI | p = 0.064 | ||||
| Undernutrition | 8.2 (17) | 15.0 (15) | 20.7 (12) | 12.0 (44) | |
| Normal | 74.0 (154) | 67.0 (67) | 58.6 (34) | 69.7 (255) | |
| Overweight | 17.8 (37) | 18.0 (18) | 20.7 (12) | 18.3 (67) | |
| Malnutrition | 26.0 (54) | 33.0 (33) | 41.4 (24) | 30.3 (111) | |
| MUAC | p = 0.050a | ||||
| Undernutrition | 11.5 (24) | 23.0 (23) | 8.6 (5) | 14.2 (52) | |
| Normal | 79.3 (165) | 71.0 (71) | 86.2 (50) | 78.1 (286) | |
| Overweight | 9.1 (19) | 6.0 (6) | 5.2 (3) | 7.7 (28) | |
| Malnutrition | 20.6 (43) | 29.0 (29) | 138 (8) | 219 (80) | |
| BMI x MUAC | p = 0.000a | p = 0.001a | p = 0.007a,b | p = 0.000a |
CNS: central nervous system; BMI: body mass index; MUAC: mid-upper arm circumference.
Classification of nutritional status by body mass index and mid-upper arm circumference of pediatric cancer patients at diagnosis by diagnosis.
| Diagnosis | Nutritional status, % | |||||
|---|---|---|---|---|---|---|
| Undernutrition | Normal | Overweight | ||||
| BMI | MUAC | BMI | MUAC | BMI | MUAC | |
| ALL (n = 114) | 5.2% | 12.3% | 75.7% | 75.4% | 19.2% | 12.3% |
| AML (n = 53) | 7.6% | 9.4% | 73.6% | 83.0% | 18.9% | 7.6% |
| Neuroblastoma (n = 33) | 14.7% | 30.3% | 70.6% | 63.6% | 14.6% | 6.1% |
| Medulloblastoma (n = 22) | 13.7% | 9.1% | 72.8% | 86.4% | 13.7% | 4.5% |
ALL: acute lymphoblastic leukemia; AML: acute myeloid leukemia; BMI: body mass index; MUAC: mid-upper arm circumference.
The 10-year overall survival was 65%, consistent with institutional data (Figure 1). The overall survival of patients with ALL, acute myeloid leukemia (AML), neuroblastoma and medulloblastoma was 69.3%, 54.7%, 42.4% and 77.3%, respectively. When divided into two groups of patients with ALL diagnosed from 2007 to 2011 (n = 57) and from 2012 to 2016 (n = 57), the survival rates are 60% and 79%, respectively. There was no significant difference in the 10-year overall survival by the presence of malnutrition, when measured by zBMI/A (p = 0.1507) or MUAC (p = 0.8135), as shown in Figure 2. When adjusted for gender, tumor group and age in a multivariate analysis, malnutrition at diagnosis by MUAC (hazard ratio [HR], 0.94; 95% CI, 0.61–1.44; p = 0.773) or zBMI/A (HR, 1.27; 95% CI, 0.88–1.83; p = 0.209) remained without impact on the overall survival.

 mid-upper arm circumference, (B) body mass index for age z-score.")
The aim of this study was to evaluate the nutritional status of children with cancer referred to the nutrition team at diagnosis and assess its association with overall survival, while acknowledging that these children received nutritional care during treatment, including nutritional therapy when deemed appropriate. The prevalence of undernutrition ranged from 8 to 23% and overweight/obesity from 5 to 20%, depending on the tumor group and nutritional indicator used. Such variations reflect the difference in the classification of nutritional status by different indicators and the need for standardization of methods and classifications that can clearly define malnutrition. In addition, the prevalence variation may reflect the diversity of the population (different ages, diagnoses and cancer staging), as well as the socioeconomic inequality present in the country. In a systematic review, Iniesta et al.22 observed that the prevalence of undernutrition in children with cancer at diagnosis is higher in low- and middle-income countries (LMICs) than in high income countries (HICs). The prevalence of undernutrition herein reported at cancer diagnosis was 2–6.5 times higher than the Brazilian population data for children (4.1%) and adolescents (3.4%).23 However, the prevalence of overweight/obesity and stunting at diagnosis are compatible with the Brazilian population data (overweight: 20.5–33.5%; obesity 4.9–14.3%; stunting: 6–6.8%).23
The diagnosis with the highest prevalence of undernutrition was neuroblastoma, both by BMI and MUAC. Green et al. (2008)24 also observed a high prevalence of undernutrition (50%) in children aged 1–5 years diagnosed with neuroblastoma in Canada, while Small et al. (2015)25 found 24% in a comparable group at diagnosis in Australia. The neuroblastoma is the most common solid tumor diagnosis in this study. The prevalence of undernutrition observed at diagnosis, measured by MUAC, was double what the BMI-based indicator had assessed, indicating that these patients had reduced muscle mass (sarcopenia) at diagnosis and probably large tumor masses.
Although a higher prevalence of undernutrition by BMI at diagnosis in patients with solid tumors has been reported in the literature,4,10,26,27 the highest prevalence of undernutrition in this study was found in patients with CNS tumors (20.7%), followed by diagnoses of solid tumors (15%), similar to the report by Tazi et al.7 in Morocco. In Canada, Bakish et al.28 evaluated the ideal body weight adequacy of patients with CNS tumors and found 31% of undernutrition at diagnosis. These results may reflect patients at a high nutritional risk due to reduced dietary intake and symptoms such as nausea and vomiting, which can lead to significant weight loss before diagnosis.28 In the current study, when classified by MUAC, patients with solid tumors had the highest prevalence of undernutrition, as was observed also by Lemos et al.4 and in the systematic review by Iniesta et al.22. In a study of more than 1500 children with cancer in Central America, Sala et al.10 found a high prevalence of undernutrition at diagnosis in patients with solid tumors and leukemias, except ALL, when assessed by arm anthropometry.
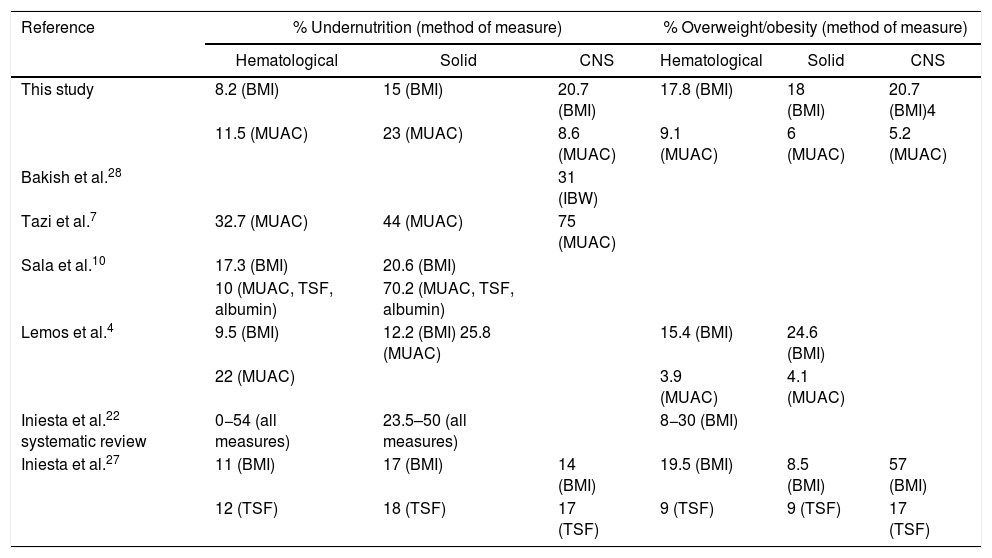
As in this study, Iniesta et al.27 observed a higher prevalence of overweight and obesity at diagnosis in children with CNS tumors than other forms of cancer. Lemos et al.4 found a higher prevalence of overweight and obesity at diagnosis in children with solid tumors, classified both by the BMI and MUAC. In a systematic review, Iniesta et al.22 reported 8–30% prevalence of overweight and obesity at the diagnosis of hematological tumors, defined by the BMI. In the present study, the prevalence of overweight/obesity classified by the MUAC was higher than by the BMI in patients with hematological tumors. Table 3 depicts a comparison between the prevalences of undernutrition and overweight/obesity by tumor group found in this study and previous publications.
Comparison of prevalences of undernutrition and overweight/obesity in children with cancer found in this study versus previous publications by tumor group.
| Reference | % Undernutrition (method of measure) | % Overweight/obesity (method of measure) | ||||
|---|---|---|---|---|---|---|
| Hematological | Solid | CNS | Hematological | Solid | CNS | |
| This study | 8.2 (BMI) | 15 (BMI) | 20.7 (BMI) | 17.8 (BMI) | 18 (BMI) | 20.7 (BMI)4 |
| 11.5 (MUAC) | 23 (MUAC) | 8.6 (MUAC) | 9.1 (MUAC) | 6 (MUAC) | 5.2 (MUAC) | |
| Bakish et al.28 | 31 (IBW) | |||||
| Tazi et al.7 | 32.7 (MUAC) | 44 (MUAC) | 75 (MUAC) | |||
| Sala et al.10 | 17.3 (BMI) | 20.6 (BMI) | ||||
| 10 (MUAC, TSF, albumin) | 70.2 (MUAC, TSF, albumin) | |||||
| Lemos et al.4 | 9.5 (BMI) | 12.2 (BMI) 25.8 (MUAC) | 15.4 (BMI) | 24.6 (BMI) | ||
| 22 (MUAC) | 3.9 (MUAC) | 4.1 (MUAC) | ||||
| Iniesta et al.22 systematic review | 0−54 (all measures) | 23.5–50 (all measures) | 8−30 (BMI) | |||
| Iniesta et al.27 | 11 (BMI) | 17 (BMI) | 14 (BMI) | 19.5 (BMI) | 8.5 (BMI) | 57 (BMI) |
| 12 (TSF) | 18 (TSF) | 17 (TSF) | 9 (TSF) | 9 (TSF) | 17 (TSF) | |
CNS = central nervous system; BMI = body mass index; MUAC = mid-upper arm circumference; IBW = ideal body weight, TSF = triceps skinfold.
In agreement with previous publications,22,29,30 there was a difference in this study in the classification of nutritional status at diagnosis when the BMI and MUAC were compared, the latter diagnosing more undernutrition in patients with solid and hematological tumors. This result is coherent, since the BMI is based on body weight, which is biased in many patients at diagnosis because it encompasses tumor masses, ascites and organomegaly.6 In patients with CNS tumors, however, in the present study, the BMI diagnosed a higher percentage of undernutrition and overweight at diagnosis than the MUAC. The explanation for this is unclear, but may have been influenced by hydration status, since vomiting is a common symptom in these cases. Another possibility is that the data may have been confounded by the change in reference to the annualized Frisancho percentiles for children older than 5 years of age, considering the mean age was 7.1 years for children with CNS tumors, as this can result in the underestimation of nutritional status in children 5–6 years of age. Children with hematological or solid tumors may have also suffered from this change of reference, as the mean ages for those groups were also higher than 5 years.
The distribution of nutritional status by tumor group was statistically different when assessed by the MUAC, but not by the BMI, although the same trend was observed for the latter. This points to the greater sensitivity of the MUAC in distinguishing different prevalences of malnutrition among tumor types. This study corroborates the claim that the use of the BMI to classify nutritional status has important limitations for children with cancer, especially those with solid or hematological tumors.
Impact of nutritional status at diagnosis on survivalIn this study, malnutrition at diagnosis classified by the MUAC or BMI did not significantly impact overall survival. Nonetheless, in the multivariate analysis, there was a trend for worse overall survival in malnourished patients, when diagnosed by zBMI/A, which would perhaps have been confirmed with a larger sample size. Regarding undernutrition, similar studies have published similar results. In Brazil, Pedrosa et al.5 classified nutritional status by weight for height and also found no association between undernutrition at diagnosis and overall survival. Similarly, a study by Triarico et al.26 did not find such an association in patients classified by the BMI for age. In contrast, a study conducted in Central America found a difference in event-free survival at 2 years between eutrophic (65%) and undernourished (48%) patients (p < 0.001) at diagnosis.10 In a British study, undernutrition at diagnosis was also associated with worse event-free survival, while overnutrition at diagnosis was not associated with unfavorable clinical outcomes.27
The study sample consisted of hospitalized patients who were intensively monitored by the nutrition team, or who were referred to the nutrition outpatient clinic at diagnosis. Thus, the patients included in this study received nutritional care from diagnosis and had their nutritional condition monitored closely and managed intensely, including a nutritional intervention, when required. This may partially explain the lack of impact of the nutritional status at diagnosis on the overall survival, since nutritional status has been shown to be a modifiable risk factor, although to date, only for patients with ALL.9,16 In 2012, a nutritional therapy algorithm and protocol was developed and implemented by the institution nutrition team, which improved care systematization and clinical support for patients and may well have impacted positively on overall survival. This points to the importance of an established nutrition program as part of the treatment of children with cancer.
Study limitations and strengthsThe main limitation of this study is the retrospective cross-sectional design, since the evolution of nutritional status during treatment was not accounted for. Furthermore, the lack of information on cancer staging and overall heterogeneity of patients (i.e., different diagnoses and socioeconomic backgrounds) restrict more detailed analyses. Having a sample composed of patients either hospitalized or referred for outpatient nutrition consultation, rather than all newly diagnosed patients, makes the comparison to other publications challenging. However, the study strengths include a nutritional assessment within 7 days of diagnosis, which eliminates the influence of the cancer treatment, and the measurement of the MUAC, in line with what is recommended and used in recent studies to classify the nutritional status of children with cancer.
ConclusionRefining our understanding of the nutritional status in children with cancer in LMICs and its clinical impact is an essential component of cancer care. Even when using a standard method to classify malnutrition, the prevalence at pediatric cancer diagnosis varies depending on the type of cancer and the methods of assessing nutritional status. It was observed that the MUAC classified more patients with solid and hematological tumors as undernourished than the zBMI/A, while the converse was true for patients with CNS tumors. In this study, the nutritional status at diagnosis did not impact the overall survival with statistical significance, which suggests the effect may have been modified by successful nutritional intervention during subsequent care. Multicentric prospective longitudinal studies conducted in Brazil and other LMICs are needed to better understand the impact on numerous clinical outcomes of nutritional status at diagnosis and during treatment. As a next step, to build upon the data here observed, our group will conduct a national study on the evolution of the nutritional status in the first 6 months of treatment, evaluating the role of the nutritional status on the cost of treatment and the relationship with the clinical outcomes.
Conflicts of interestThe authors declare no conflicts of interest.
The authors acknowledge the consulting support from Dr. Lehana Thabane in the statistical analysis of this study.


