
To assess the nutritional status of child and adolescent patients with cancer at diagnosis.
MethodsA total of 1154 patients were included and divided into two groups: solid and hematological malignancies. The parameters used for nutritional assessment were weight, height, triceps skinfold thickness, mid-upper arm circumference, arm muscle circumference, body mass index and percentage weight loss.
ResultsAt diagnosis, below adequate body mass index was observed by anthropometric analysis in 10.85% of the patients – 12.2% in the solid tumor group and 9.52% in the hematologic group. The average weight loss adjusted for a period of 7 days was −2.82% in the hematologic group and −2.9% in the solid tumor group.
ConclusionsThe prevalence of malnutrition is higher among patients with malignancies than in the general population, even though no difference was observed between the two groups.
Pediatric malignancies account for between 1% and 3% of cancer diagnosed worldwide.1 However, in developing countries, where the proportion of children and adolescents is about 50% of the population, these tumors correspond to from 3% to 10% of all malignant neoplasms;2 in developed countries this rate is about 1%. According to the Population-Based Cancer Registers (RCBP), the incidence of pediatric tumors in Brazil is between developing and developed countries, accounting for 3% of all malignancies. As nearly 30% of the population is 19 years old or less, it is estimated that approximately 11,530 new cases of cancer occurred in the pediatric and adolescent populations in 2012.3
The prevalence of malnutrition among these patients varies from 10% to 50% depending on the assessment method used, time of evaluation (at diagnosis, during chemotherapy, etc.), tumor stage and histology type, and patient socioeconomic status.4–12
Considering the importance of knowing the nutritional status of pediatric patients with malignant neoplasms, this study was performed with the following objectives:
- -
To evaluate the nutritional state of under 20-year-old cancer patients at diagnosis;
- -
To compare the nutritional status of patients with solid tumors (ST) to those with hematological malignancies (HM);
- -
To correlate the diagnosis with the nutritional status of the patient, the caregiver's level of education, family income and place of origin.
This transversal observational study evaluated the nutritional status of 1154 consecutive children and teenagers with malignant neoplasms treated in the outpatient clinic or admitted as inpatients on the wards or in the intensive care units of the Pediatric Oncology Institute of the Pediatrics Department, Universidade Federal de São Paulo (UNIFESP), from March 2006 to March 2012. This study was approved by the Research Ethics Committee of UNIFESP.
Patients aged 0–19 years with diagnosis of malignant neoplasms or benign tumors of the central nervous system with malignant behavior (i.e. craniopharyngioma, astrocytoma, etc.) were enrolled in this study. Patients with history of treatment of the neoplasm, receiving corticosteroids, those with chronic pre-existent diseases or with physical limitations that would hinder adequate measurement of study variables (in particular height and weight) were excluded.
The patients were divided into two groups according to diagnosis: HM group, comprising lymphoma and leukemia, and the ST group, which included all other tumors.
The Anthro software of the World Health Organization (version 3.0.1; Department of Nutrition, WHO) was used to calculate the nutritional status according to the body mass index (BMI) of up to 5-year-old patients and the WHO AnthroPlus software (version 1.0.2) for patients aged more than 5 years. Nutritional status was classified according to the WHO criteria13,14 and then categorized into three groups:
- -
Below adequate – patients with a z-score more than two standard deviations (SD) below the mean BMI for age;
- -
Adequate – patients with a z-score between two SD below and one SD above the mean BMI for age;
- -
Above adequate – patients with a z-score more than one SD above the mean BMI for age.
The parameters used for nutritional assessment were weight, height, triceps skinfold thickness (TSFT), mid-upper arm circumference (MUAC) and arm muscle circumference (AMC), BMI and percentage weight loss. TSFT, MUAC and AMC were classified according to the classification of Frisancho15 as follows:
- -
Below adequate: ≤5th percentile;
- -
Adequate: between 5th and 95th percentiles;
- -
Above adequate: ≥95th percentile.
Weight loss was qualitatively evaluated by questioning the patient or caregiver about whether they had noticed weight loss and quantitatively assessed by the absolute difference between the usual weight of the patient (as reported by the patient/caregiver) and the weight on admission. The relative weight loss was obtained by dividing the weight lost by the usual weight and classified according to the time of occurrence (as reported by the caregiver) using the Blackburn et al. formula,16 adjusted for a 7-day period.
Statistical analysisThe Chi-square test was used to assess the association between oncologic diagnosis and prevalence of nutritional deficit as identified by the TSFT, MUAC, and AMC exams.
The nonparametric Kruskal–Wallis test was used to assess the association between diagnosis and weight loss and between diagnosis and nutritional deficit as measured by the BMI. The significance threshold (α) was set at 5% (p-value<0.05).
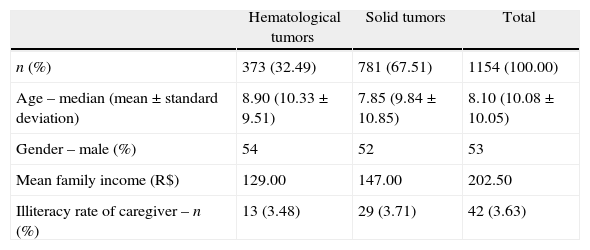
ResultsA total of 1317 patients were admitted to the intensive care units and inpatient facilities or treated in the outpatient clinic during the study period. Of those, 163 were excluded from analysis due to difficulties in weighing or the imprecision of the result. Thus, 1154 patients were included in the study of which 53.09% were male and the mean age was 10.24 years. The distribution of tumor types (HM and ST), age, family income and education level of the caregiver is shown in Table 1.
Demographic data of patients with cancer at the time of diagnosis (n=1154).
| Hematological tumors | Solid tumors | Total | |
| n (%) | 373 (32.49) | 781 (67.51) | 1154 (100.00) |
| Age – median (mean±standard deviation) | 8.90 (10.33±9.51) | 7.85 (9.84±10.85) | 8.10 (10.08±10.05) |
| Gender – male (%) | 54 | 52 | 53 |
| Mean family income (R$) | 129.00 | 147.00 | 202.50 |
| Illiteracy rate of caregiver – n (%) | 13 (3.48) | 29 (3.71) | 42 (3.63) |
Student's t-test: the groups did not differ in relation to gender, age, education of caregiver and mean family income. 1 US$ is about R$ 2.23.
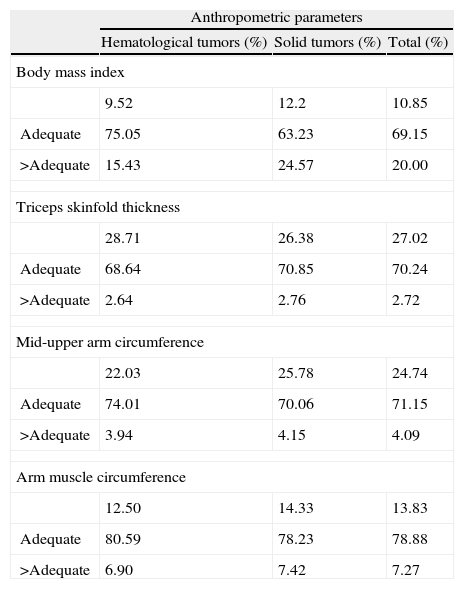
According to anthropometric analysis, 10.85% of the patients presented with below adequate BMI at admission. However, when the TSFT, MUAC and AMC exams were used, the prevalence of malnutrition increased to 27.02%, 24.74% and 13.83%, respectively. The prevalences of malnutrition by type of tumor and anthropometric parameter are shown in Table 2.
Percentage of malnutrition according to anthropometric parameters (n=1154).
| Anthropometric parameters | |||
| Hematological tumors (%) | Solid tumors (%) | Total (%) | |
| Body mass index | |||
| 9.52 | 12.2 | 10.85 | |
| Adequate | 75.05 | 63.23 | 69.15 |
| >Adequate | 15.43 | 24.57 | 20.00 |
| Triceps skinfold thickness | |||
| 28.71 | 26.38 | 27.02 | |
| Adequate | 68.64 | 70.85 | 70.24 |
| >Adequate | 2.64 | 2.76 | 2.72 |
| Mid-upper arm circumference | |||
| 22.03 | 25.78 | 24.74 | |
| Adequate | 74.01 | 70.06 | 71.15 |
| >Adequate | 3.94 | 4.15 | 4.09 |
| Arm muscle circumference | |||
| 12.50 | 14.33 | 13.83 | |
| Adequate | 80.59 | 78.23 | 78.88 |
| >Adequate | 6.90 | 7.42 | 7.27 |
Chi-squared test: groups did not differ with respect to the diagnosis of nutritional status according to the different anthropometric parameters.
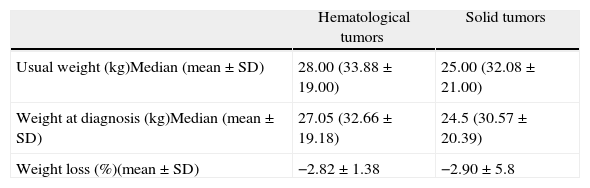
Table 3 shows the mean weight loss adjusted to 7-day periods: −2.82% in the patients of the HM group, and −2.9% in the patients of the ST group (p-value=0.11). No statistically significant differences were observed in respect to usual weight (p-value=0.18) and current weight (p-value=0.11) between the two groups.
Weight loss at diagnosis of patients with hematological and solid tumors (n=1154).
| Hematological tumors | Solid tumors | |
| Usual weight (kg)Median (mean±SD) | 28.00 (33.88±19.00) | 25.00 (32.08±21.00) |
| Weight at diagnosis (kg)Median (mean±SD) | 27.05 (32.66±19.18) | 24.5 (30.57±20.39) |
| Weight loss (%)(mean±SD) | −2.82±1.38 | −2.90±5.8 |
SD: Standard deviation.
Chi-squared test: the groups did not differ in mean usual weight, weight at diagnosis and percentage weight loss.
A significant drop in the prevalence of malnutrition was observed in Brazil during recent decades. The problem of low weight for age has been practically overcome in under 5-year-old children and the low height for age in this age group will follow a similar trend over the next 10 years if the current rate of reduction is maintained.17–24
One of the main reasons for this evolution is the improvement in the organization of basic care by the Brazilian National Healthcare System with the Family Healthcare Strategy. The evolution of primary healthcare is central to guarantee access and promote equity through closer contact of the population with healthcare services and measures to promote health and disease prevention.18–24
In this study, according to the BMI, the prevalence of malnutrition at the time of diagnosis was higher than in the general Brazilian population. This is probably due to the catabolism caused by the disease. The prevalence of malnutrition is also higher than reported in the international literature, probably due to the low income of the population.
Between 2000 and 2012, a 30% increase in the per capita income was observed in the Brazilian population. In 2010, the Brazilian per capita income was R$ 767.02, 80% higher than the medium per capita of our patients.19–22 Interestingly, besides the low income, the illiteracy rate (3.63%) among caregivers was lower than in the general population (9.3%).20–23
The results of the current study suggest that some types of tumors can mask malnutrition, mainly when only the BMI is used for evaluation. Therefore, other anthropometrical measurements based on TSF and MUAC measurements must be combined, as they more efficiently evaluate body composition and diagnose malnutrition in patients with pediatric cancer.18–24
The patients included in this study were not evaluated from the beginning of the symptoms up to admission in our service. Therefore, many would have been evaluated by other professionals in other health centers, before their final diagnosis and their first oncological consultation. In this study, nutritional evaluation was performed at the time of diagnosis, which is supposedly the most adequate time to prevent worsening of the nutritional status. In other words, at ‘onset’ of the disease, which is ideally the time when the oncological diagnosis is made, the level of malnutrition is expected to be similar to others in the population to which the patient belongs. Malnutrition worsens as the tumor evolves, that is, the later the diagnosis, the higher is the risk of malnutrition.25
Hence, the lack of protocols to evaluate and treat malnutrition, as well as the limited involvement of healthcare professionals in relation to early nutritional interventions are important factors contributing to the high incidence of malnutrition found in the literature. Thus, diagnosis of malnutrition and early intervention must be prioritized by all oncology teams in an attempt to solve at least part of the problem.
Currently, the investments in nutrition in developed countries have allowed earlier nutritional interventions and treatment and, probably because of this, the prevalence of malnutrition is lower in studies performed in those countries.26 Hence, nutritional therapy protocols adapted to the reality of our population should be immediately implemented in all Brazilian oncologic centers, so that these patients have at least the chance of receiving adequate treatment to avoid the need of reducing drug doses, delaying chemotherapy cycles or surgical procedures, and decreasing the risk of toxicity, infections and death.
ConclusionThe prevalence of malnutrition in our study population was almost three times higher than in the general population of Brazil. Accordingly, it is essential that policies that allow for earlier diagnosis and implementation of nutritional interventions and treatment are urgently required in order to offer more effective treatment for pediatric cancer.
Conflicts of interestThe authors declare no conflicts of interest.


