


The objective of this study was to evaluate the intestinal barrier function in leukemia patients before the start of the chemotherapy with an intestinal permeability test using lactulose and mannitol as markers.
MethodsThe study enrolled 20 patients diagnosed with leukemia (acute and chronic). Ten healthy volunteers were also submitted to the test as a control group.
ResultsThe median lactulose/mannitol ratio was 0.019 for the Leukemia Patient Group, whereas in healthy controls the median was 0.009 (p-value=0.244). The median lactulose/mannitol ratio in acute leukemia patients was 0.034 giving a p-value of 0.069 when compared to healthy controls. This same comparison was made between acute myeloid leukemia patients and healthy controls with a p-value of 0.149. There was no significant difference in the intestinal permeability between acute and chronic leukemia patients (p-value=0.098).
ConclusionThe intestinal barrier function measured using the intestinal permeability test was similar in leukemic patients overall and healthy controls, but a tendency toward a different pattern was found in the intestinal barrier function of acute leukemia patients.
Leukemias are diseases characterized by neoplastic proliferation that affect the bone marrow and inhibit hematopoiesis, causing abnormalities in peripheral blood and sometimes infiltrating non-hematopoietic tissues.1 The gastrointestinal tract may be affected, either by leukemic infiltration or by therapy-associated complications.2 Leukemia cell infiltration may occur in any segment of the gastrointestinal tract and may cause stomatitis, gingivitis or gum hypertrophy, oropharyngeal dysphagia and the formation of masses in the esophagus, stomach, small intestines and colon which, in turn, are associated to obstruction, hemorrhage, intussusception or enterocolitis. In the small gut, leukemia infiltration may reduce the integrity of the mucosal barrier, allowing antigen permeation and reduction of absorption area.3 The involvement of this organ is most often seen in acute myeloid leukemia (AML).2,4
These changes in the intestinal barrier can be studied through intestinal permeability; the most commonly used markers are sugars such as lactulose and mannitol, since they do not require the use of radioactive techniques.5–7
The intestinal permeability test (TL/M) is a useful method to evaluate the integrity of the intestinal mucosa in any condition which would cause the loosening of tight junctions, including those affecting the small gut, such as in Crohn's and celiac diseases and diseases which are associated to a secondary infiltration of this organ such as leukemia.8 By using this method, it is also possible to study mucositis secondary to the use of chemotherapeutic agents.9 Changes in intestinal permeability, detected before chemotherapy in leukemia patients and their eventual clinical consequences, such as a greater antigen permeation, may contribute to elucidate pathophysiological mechanisms involved in the context of the disease and its therapy, and possibly, come up with more specific solutions to problems related to these changes, such as infection and graft versus host disease (in the case of marrow transplantation).
ObjectiveThe aim of the study was to evaluate the intestinal barrier function in leukemic patients prior to chemotherapy, by testing intestinal permeability by the determination of urinary lactulose and mannitol concentrations by high performance liquid chromatography (HPLC).
MethodsPatientsBetween April 2010 and September 2011, this study enrolled 20 patients aged 18 years or above, of both genders, with initial diagnoses of AML, chronic myeloid leukemia (CML), acute lymphoblastic leukemia (ALL) and chronic lymphocytic leukemia (CLL) admitted in the Hematology Outpatient Clinic and Emergency Department of the Hospital das Clínicas da Universidade Federal de Minas Gerais, before undergoing chemotherapy induction. The use of the TL/M did not result in any change in medical management. Ten over 18-year-old healthy volunteers, of both genders, also underwent the TL/M.
Patients diagnosed with bowel disease, cirrhosis, congestive heart failure, nephrotic syndrome, thyroid diseases or diabetes mellitus, diseases that could interfere with absorption or flow of water and solutes and/or gastrointestinal motility were excluded from the research as were patients who drank alcoholic beverages within three days and took nonsteroidal anti-inflammatory drugs (NSAIDs) within seven days prior to urine collection.
MethodsThe study was approved by the Research Ethics Committee of the Universidade Federal de Minas Gerais (ETIC 0079.0.203.000-11). All participants signed an informed consent term before the study was initiated.
Diagnosis of leukemia was confirmed by myelogram, bone marrow biopsy and cytogenetic or genetic studies when necessary.
In order to perform the TL/M, patients fasted for eight hours. Subsequently, they were instructed to eliminate any residual urine and a 120mL iso-osmolar solution containing 6.25g of lactulose (95%) (Sigma–Aldrich, Missouri, USA) and 3.0g of mannitol (PA) (Sigma–Aldrich, Missouri, USA) diluted in water was given. Fasting was maintained for the following two hours. All urine volume was collected during a period of five hours. Subsequently, the urine was homogenized and the total volume was recorded. Aliquots of 50mL were stored in labeled in sealed flasks after adding 10mg of thimerosal (Synth, Diadema, Brazil) to inhibit bacterial growth. Samples were filtered using a millipore filter (0.22μm) (Millipore, Billerica, USA), and the ion-exchange resin and the material were stored in properly labeled cryotubes at −20°C.
The mannitol and lactulose concentrations were measured in the urine using HPLC equipment (Schimadzu®, Japan) comprising an injection pump, an autoinjector, a controller with software that allows readings to be interpreted at a workstation, and a refractive index gauge. Fifty microliters of urine were introduced after thawing using the autoinjector. To achieve better separation from other substances in the urine, lactulose and mannitol were read using two different columns utilizing two distinct mobile phases. A Phenomenex H+ column (Phenomenex, USA) with a mobile phase of pure milli-Q sonicated water at a flow of 0.6mL/min was used to separate the mannitol and a Supelcogel NH2 column (Sigma Aldrich, Bellefonte, USA) with a mobile phase of a solution of acetonitrile and milli-Q sonicated water (ratio of 75/25) with a flow of 1.0mL/min was employed to separate the lactulose. A Supelcogel H+ precolumn (Sigma Aldrich, Bellefonte, USA) was the same for both readings. Different amplitudes of the waves generated by the solution containing lactulose and mannitol were captured at the workstation, generating graphs in the form of curves, which were then recorded. Analyses were carried out at room temperature.
To test reproducibility and to standardize measurements, solutions of lactulose were prepared at known concentrations of 0.1g/L, 0.2g/L, 0.4g/L and 0.8g/L, as were solutions of mannitol at concentrations of 0.625g/L, 1.25g/L and 2.5g/L and a simple linear regression was performed in order to obtain a straight line equation for both.
By correcting for the urine volume, the amount excreted was obtained for lactulose and mannitol, which was then divided by the amount ingested to calculate an excreted percentage of each sugar. The percentage of lactulose was divided by the percentage of mannitol in order to obtain the lactulose/mannitol excretion ratio (TL/M).
Clinical and laboratory variables were recorded. Statistical analyses were performed using the Statistics Program for Social Sciences (SPSS version 18.0). Student's t test was employed to compare independent sample means and when data did not have a Gaussian distribution, the Mann–Whitney test was used to compare medians. An alpha error of 5% (p-value<0.05) was considered the threshold for statistical significance.
ResultsInitially, 26 patients with suspected diagnoses of leukemia before the beginning of the treatment were invited to take part in the study. After the results of the confirmatory tests, two patients were excluded as they were diagnosed with myelofibrosis. Four other patients refused to take part in the research. Thus, 20 patients, nine males (45%) and 11 females (55%), with confirmed diagnosis of leukemia participated in the research. Ages ranged from 18 to 81 years, with a mean of 47.2 years. Sixteen patients (80%) had acute (11 AML and five ALL) and four (20%) had chronic leukemia (three CML and one CLL).
Gastrointestinal manifestations such as nauseas, vomits, abdominal pain or discomfort and diarrhea were present in eight (40%) patients, seven with AML and one with CML. Fever was present in nine (45%) patients, six with AML, one with ALL and two with CML.
The mean TL/M in leukemia patients, calculated from the relationship between lactulose and mannitol excretion rates, was 0.061±0.115 and the median was 0.019 (0.001 to 0.483) and the mean TL/M in healthy volunteers was 0.012±0.010 and the median was 0.009 (0.001–0.027) (Table 1).
Intestinal permeability test between leukemia patients and healthy volunteers.
| Mean % | Standard deviation | Median % (range) | p-Value | |
| Percentage lactulose | ||||
| Healthy volunteers | 0.14 | 0.14 | 0.09 (0.02–0.48) | 0.311 |
| Leukemia patients | 0.27 | 0.26 | 0.23 (0.01–0.97) | |
| Percentage mannitol | ||||
| Healthy volunteers | 11.44 | 4.34 | 11.60 (4.70–18.0) | 0.403 |
| Leukemia patients | 9.78 | 5.37 | 10.55 (0.60–21.70) | |
| TL/M | ||||
| Healthy volunteers | 0.012 | 0.010 | 0.009 (0.001–0.027) | 0.244 |
| Leukemia patients | 0.061 | 0.115 | 0.019 (0.001–0.488) | |
TL/M: lactulose/mannitol ratio.
Comparisons of the TL/M between acute leukemia patients and healthy volunteers, and between AML patients and healthy volunteers were also performed. In patients with acute leukemia, the median TL/M was 0.034 (0.001–0.483) giving a p-value of 0.069 compared to the median of healthy volunteers (Table 2). On comparing the median TL/M of AML patients (0.042) and the median of healthy volunteers (0.009) the p-value was 0.149 (Table 3).
Intestinal permeability test between acute leukemia patients and healthy volunteers.
| n | Mean % | Standard deviation | Median % (range) | p-Value | |
| Percentage lactulose | |||||
| Healthy volunteers | 10 | 0.14 | 0.14 | 0.09 (0.02–0.48) | 0.170 |
| Leukemia patients | 16 | 0.31 | 0.27 | 0.26 (0.01–0.97) | |
| Percentage mannitol | |||||
| Healthy volunteers | 10 | 11.44 | 4.34 | 11.60 (4.70–18.0) | 0.215 |
| Acute leukemia patients | 16 | 8.97 | 5.07 | 8.75 (0.60–16.80) | |
| TL/M | |||||
| Healthy volunteers | 10 | 0.012 | 0.010 | 0.009 (0.001–0.027) | 0.069 |
| Acute leukemia patients | 16 | 0.074 | 0.126 | 0.034 (0.001–0.483) | |
TL/M: lactulose/mannitol ratio.
Intestinal permeability test between acute myeloid leukemia patients and healthy volunteers.
| n | Mean % | Standard deviation | Median % (range) | p-Value | |
| Percentage lactulose | |||||
| Healthy volunteers | 10 | 0.14 | 0.14 | 0.09 (0.02–0.48) | 0.204 |
| AML patients | 11 | 0.33 | 0.30 | 0.29 (0.01–0.97) | |
| Percentage mannitol | |||||
| Healthy volunteers | 10 | 11.44 | 4.34 | 11.60 (4.70–18.0) | 0.397 |
| AML patients | 11 | 9.66 | 4.99 | 9.90 (0.60–16.80) | |
| TL/M | |||||
| Healthy volunteers | 10 | 0.012 | 0.010 | 0.009 (0.001–0.027) | 0.149 |
| AML patients | 11 | 0.077 | 0.138 | 0.042 (0.001–0.483) | |
TL/M: lactulose/mannitol ratio.
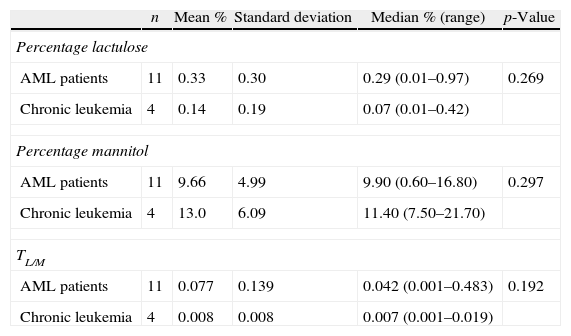
The TL/M was also compared between acute leukemia and chronic leukemia patients. The median TL/M for acute leukemia patients was 0.034, whereas it was 0.007 for chronic leukemia patients (p-values=0.098) (Table 4). The median TL/M was 0.042 and 0.007 for AML and chronic leukemia patients, respectively (p-value=0.192) (Table 5).
Intestinal permeability test between acute leukemia patients and chronic leukemia patients.
| n | Mean % | Standard deviation | Median % (range) | p-Value | |
| Percentage lactulose | |||||
| Acute leukemia | 16 | 0.30 | 0.27 | 0.26 (0.01–0.97) | 0.275 |
| Chronic leukemia | 4 | 0.14 | 0.19 | 0.07 (0.01–0.42) | |
| Percentage mannitol | |||||
| Acute leukemia | 16 | 8.97 | 5.07 | 8.75 (0.60–16.80) | 0.187 |
| Chronic leukemia | 4 | 13.0 | 6.09 | 11.40 (7.50–21.70) | |
| TL/M | |||||
| Acute leukemia | 16 | 0.074 | 0.126 | 0.034 (0.001–0.483) | 0.098 |
| Chronic leukemia | 4 | 0.008 | 0.008 | 0.007 (0.001–0.019) | |
TL/M: lactulose/mannitol ratio.
Intestinal permeability test between acute myeloid leukemia patients and chronic leukemia patients.
| n | Mean % | Standard deviation | Median % (range) | p-Value | |
| Percentage lactulose | |||||
| AML patients | 11 | 0.33 | 0.30 | 0.29 (0.01–0.97) | 0.269 |
| Chronic leukemia | 4 | 0.14 | 0.19 | 0.07 (0.01–0.42) | |
| Percentage mannitol | |||||
| AML patients | 11 | 9.66 | 4.99 | 9.90 (0.60–16.80) | 0.297 |
| Chronic leukemia | 4 | 13.0 | 6.09 | 11.40 (7.50–21.70) | |
| TL/M | |||||
| AML patients | 11 | 0.077 | 0.139 | 0.042 (0.001–0.483) | 0.192 |
| Chronic leukemia | 4 | 0.008 | 0.008 | 0.007 (0.001–0.019) | |
TL/M: lactulose/mannitol ratio.
Leukemia patients with gastrointestinal symptoms or fever did not present different TL/M values from the leukemia subgroups without these manifestations.
DiscussionIn this study, leukemia patients had higher median TL/M values (0.019) when compared to the median of healthy volunteers (0.009), however, the difference was not statistically significant (p-value=0.244). This finding may be explained by the small sample size and by the wide range of results found in leukemia patients (0.001–0.483). However, in this sample, some leukemia patients did not have changes in the function of the intestinal barrier, which is perfectly understandable, since not all leukemia patients have infiltration of the small intestinal wall. It is assumed that there are differences between subgroups of leukemia and this may involve a greater or lesser number of complications, primarily those associated to sepsis resulting from greater permeation of antigens in patients with higher TL/M values.10 In 1998, Sundström et al.11 compared intestinal permeability in AML patients before chemotherapy with results obtained from health volunteers and observed higher values in the first group, however, some patients also had their intestinal barrier function preserved.11 In this study, the median of the TL/M of AML patients before beginning the treatment (0.043) was significantly higher (p-value=0.02) when compared to the median of healthy volunteers (0.025). Bow and Meddings9 also evaluated the intestinal barrier function in AML patients before the induction of chemotherapy and found that the TL/M was also higher before beginning the therapy (0.03) compared to the mean reference score mentioned by the authors (TL/M<0.028).9
The median TL/M of acute leukemia patients was 0.034 whereas it was 0.009 in healthy volunteers (p-value=0.069). Although the difference was not statistically significant, it is possible that there is a tendency for the intestinal barrier to be different between the two groups. This comparison was also performed exclusively among AML patients. The median TL/M in AML patients was also higher (0.042) compared to the control group (0.009), however, the p-value was 0.149. When analyzing these results, it was again found that results from AML patients varied considerably. In these patients, the minimum and the maximum values were 0.001 and 0.483, respectively. In addition, the results overlapped, i.e. some AML patients also initially had an intestinal barrier function similar to that of the healthy volunteers.
AMLs are more associated to intestinal injury than other types of leukemia.2,4 In this study, the median TL/M of acute leukemia patients was 0.034. When compared to the median of the group of chronic leukemia patients (median TL/M=0.007; range: 0.001–0.019), the p-value was 0.098. However, one can also infer that there is a tendency to behave differently between the two groups of patients. All TL/M results in chronic leukemia were within the range of the healthy controls. The median TL/M in AML patients was even higher (0.042), but not significantly different compared to the results of chronic leukemia patients (p-value=0.192); this may also have been influenced by the wide range of results of the first group.
Although there are few studies in the literature analyzing intestinal changes associated to leukemias using the TL/M in adults before chemotherapy, it is possible to suppose that a subgroup of acute leukemia patients may have higher values compared to healthy individuals. Although most studies have aimed to show the damage caused by chemotherapy, the intestinal barrier function is likely to have already been impaired and so further changes may add to the lesions caused by chemotherapeutic agents. Evidence of changes in intestinal permeability indicating changes of the intestinal mucosal barrier in a subset of leukemia patients before chemotherapy may correlate with prognosis and so future investigations should try to identify interventions to minimize these effects.
Conflicts of interestThe authors declare no conflicts of interest.

