


To date, 340 antigen-organized 43 blood group systems are recognized, being ABO, Rh, Kell, Duffy, Kidd, MNS and Diego the most clinically relevant. The aim of this study was to assess the distribution of alleles and genotypes of the blood group systems Rh, Kell, Duffy, Kidd, MNS and Diego in 810 blood donors registered in the hemotherapy unit in northwest Rio Grande do Sul, Brazil
MethodsWe evaluated the genetic variability of blood groups Rh (c.676G>C and c.307C>T), Kell (c.578C>T), Kidd (c.838A>G), Duffy (c.125A>G and c.1-67T>C), Diego (c.2561C>T) and MNS (c.143T>C) in 810 volunteer blood donors of Rio Grande do Sul, southern Brazil. The genetic profiling was performed through allelic discrimination assays using hydrolysis probes (TaqMan®) real-time PCR system.
ResultsThe most frequent blood group genotypes found in our study population were: RHC*Cc (51.5%), RHC*ee (70.1%), FY*A/FY*B (49.3%), GATA -67T/T (93.5%), KEL*2/KEL*2 (93.4%), JK*A/JK*B (53.2%) and DI*02/DI*02 (95.4%). Some statistical differences were observed on comparing the population of this study with populations from other states in Brazil, mainly with population of Minas Gerais, Bahia and Paraná, which showed some differences from the population of Porto Alegre, which was more similar to those of Santa Catarina and São Paulo
ConclusionThe frequency of red blood cell polymorphisms in our study is different from that of blood donors in other regions of Brazil. The results showed the importance of extended genotyping in adequate blood screening and the existence of rare genotypes in Brazilian regular blood donors
Erythrocyte antigens are polymorphic structures that can induce an immune response with a risk of hemolytic transfusion reactions. Currently, the International Society for Blood Transfusion (ISBT) recognizes 340 antigens organized into 43 blood group systems, with ABO, Rh, Kell, Duffy, Kidd, MNS and Diego being the most clinically relevant.1 The molecular mechanisms responsible for these polymorphisms are diverse, although the majority represent single nucleotide polymorphisms (SNPs) encoding amino acid substitutions.2 The clinical relevance of an erythrocyte antigen in transfusion depends on the incidence of the antigen in the population, which can vary in different ethnic groups, and Brazil is characterized by its mixture of ethnicities with specific characteristics for each region of the country.3,4 The frequency of these antigens is also quite variable across the country.5,6 The most implicated antibodies in delayed hemolytic transfusion reactions are directed against antigens D, K, E, C, c, Fya, Dia, S and Jka.7,8
In transfusion practice, knowing the blood profiles of donors/recipients can contribute to transfusion safety, as knowing the frequencies of antigens of the main blood groups in each population can help in the search for compatible donors. Although there are data on allelic variability and genotypic frequency of erythrocyte antigens in the country,5,6,8–11 these data are still scarce in Rio Grande do Sul (RS) in southern Brazil.12 The colonization of the capital and the metropolitan region is different from that in the interior of the state; thus, our study is the first carried out in a population in the northwest region of the state of Rio Grande do Sul.
The aim of this study was to determine the allelic and genotypic frequencies of variants in genes of blood groups, including Diego c.2561C>T (DI*01/*02), Kell c.578 C>T (KEL*01/*02), Duffy c.125 A>G and c.67T>C (FY*01/*02 and FY*02N.01) and Kidd c.838G>A (JK*01/*02), MNS c.143C>T (GYPB*S/s), Rh c.676G>C (RHCE*E/e) and c.307C >T (RCHE*C/c) in blood donors in a city in northwestern Rio Grande do Sul, Brazil and compare these frequencies between donors and patients with those found in other Brazilian regions.
MethodsSample selectionAll donors participating in this study agreed to participate through written informed consent. This study was approved by the Ethics Research Committee of the Hemocentro Regional de Santa Rosa (HEMOSAR) (No: 1964/2018) and the Universidade Federal de Ciências da Saúde de Porto Alegre (UFCSPA) (No: 3.225.821). The sample consisted of individuals of both sexes between 18 and 70 years of age. Considering an error of 5% and a confidence level of 95%, the sample size for estimating the frequency of antigens must be greater than 400. A total sample of 818 regular voluntary blood donors of both sexes was collected from the Blood Bank of Hemocentro Regional de Santa Rosa (HEMOSAR), Rio Grande do Sul, Brazil (“54°28′53 S, 27°52′15 W”), between April 2019 and August 2019.
Sample collection and DNA extractionTo obtain the DNA, 5 mL of peripheral blood was collected in tubes containing ethylenediaminetetraacetic acid (EDTA) and centrifuged (2,500 rpm for 10 min.) to obtain the buffy coat. Genomic DNA was extracted from peripheral whole blood using a standard salting-out procedure.13 The concentration and purity of DNA samples were analyzed by optical density at 260/280 nm (BioSpec-Nano, Shimadzu, Columbia, MD), diluted to 10 ng/μL and kept at −20°C for long-term storage.
GenotypingThe genotypes of blood group polymorphisms were determined by allele discrimination using a hydrolysis probe with TaqMan 5′-nuclease assays on a real-time PCR system (StepOnePlus, Applied Biosystems, Foster City, CA, USA). The following assays were used: (Thermo Fischer Scientific, Waltham, MA): C__26654865_10 (DI*01/*02 – rs2285644), AHABI4V (KEL*01/*02 - rs8176058), C___2493442_20 (FY*01/*02 – rs12075), C__15769614_10 (FY*02N.01 – rs2814778), C___1727582_10 (JK*01/*02 – rs1058396), ANMF7P2 (GYPB*S/GYPB*s – rs7683365), AH6R2NT (RHCE*C/c - rs676785) and AH5I4HL (RHCE*E/e - rs609320). The reactions were performed with fast thermal cycling conditions and the reagent concentrations were as follows: 10 ng of DNA, 1X TaqMan genotyping assay, 1X TaqMan genotyping master mix and nuclease-free water (final volume 8 µL).
The polymorphisms chosen were those that define the evaluated blood groups, based on the genotype-phenotype correlation, according to the International Society of Blood Transfusion (https://www.isbtweb.org/isbt-working-parties/rcibgt.html).
Statistical analysisCategorical variables are presented as absolute numbers and proportions. The Chi-square test (χ2), or Fisher's exact test, was used to determine the differences between genotypic and allelic frequencies in the present study and data from populations (POPs) in other regions of Brazil: POP-Porto Alegre (RS)12; POP-Santa Catarina (SC)6,14; POP-Paraná (PR)9; POP-São Paulo (SP)10; POP-Minas Gerais (MG)15; and; POP-Bahia (BA).6,14 A p-value < 0.05 was considered significant and comparisons were performed using the Winpepi version 11.65 software.16 The Arlequin computer version 3.5.2.2, available at (http://cmpg.unibe.ch/software/arlequin35/), was used to test the Hardy-Weinberg equilibrium. Pairwise Nei's DST genetic distances17 were employed to estimate genetic distances between populations, using the Poptree2.18 The nonmetric multidimensional scaling (MDS) for distances was performed to visualize the populations in a two-dimensional frame. A stress (distortion) lower than 0.05 was considered to be acceptable. To conduct the MDS, we employed the Statistical Package for Social Sciences Version 23.0 software (SPSS, Chicago, IL). For the statistical tests, a p-value < 0.05 was considered significant. The sample power was calculated using the WinPepi v. 11.65 (http://www.brixtonhealth.com/pepi4windows.html). Considering our sample and the smallest comparison sample (POP-BA), the study has a power of 80% to detect a difference of 8 percentage points and 93% for 10 percentage points. Considering the study sample and the largest comparison population (POP-SP), the study has a power of 83% to detect a difference of 5 percentage points and 100% to detect a difference of 10 percentage points.
ResultsIn total, 818 blood samples were collected from the HEMOSAR donors. Eight samples that did not have good performance in the DNA extraction were discarded, totaling 810 individuals analyzed. The donors were between 18 and 70 years old (38.48 ± 11.91 years) and from both sexes (male, 59.5% and female, 40.5%). Regarding ethnicity, according to the Brazilian Institute of Geography and Statistics (IBGE), 81.5% declared themselves white, 13.7% brown, 1.2% black, 2.1% yellow, 0.4% indigenous (native-American) and 1.1% did not declare their ethnicity.
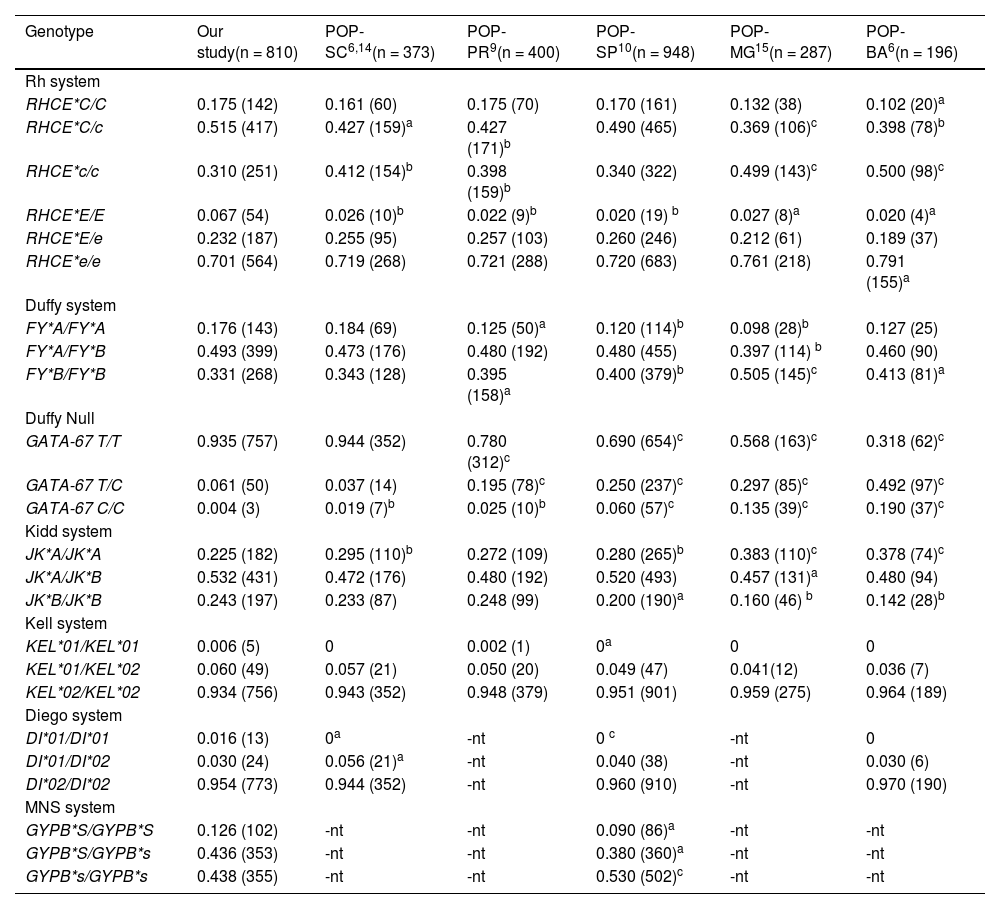
The Rh systemAccording to the HEMOSAR database, 25.4% of the donors were classified as negative for the RHD phenotype and 74.6%, positive for the RHD phenotype. The frequencies for the RHCE gene, producing the Cc and Ee antigens, were 17.5% for the RHCE*C/C genotype, 51.5% for the RHCE*C/c, 31.0% for the RHCE*c/c and 6.7% for the RHCE*E/E, 23.2% for the RHCE*E/e and 70.1% for the RHCE*e/e. Compared to other regions of Brazil, the RHCE*c/c was more frequent in Santa Catarina and Paraná (p < 0.01) and Minas Gerais and Bahia (p < 0.001). The comparison with the RHCE*E/E was different in Minas Gerais and Bahia (p < 0.01), Santa Catarina and Paraná (p < 0.01) and São Paulo (p < 0.001) (Table 1).
Comparison of genotype frequencies for the Rh, Duffy, Kell, Kidd, MNS and Diego blood group systems in voluntary blood donors in the population of northwest Rio Grande do Sul with other populations of Brazil.
| Genotype | Our study(n = 810) | POP-SC6,14(n = 373) | POP-PR9(n = 400) | POP-SP10(n = 948) | POP-MG15(n = 287) | POP-BA6(n = 196) |
|---|---|---|---|---|---|---|
| Rh system | ||||||
| RHCE*C/C | 0.175 (142) | 0.161 (60) | 0.175 (70) | 0.170 (161) | 0.132 (38) | 0.102 (20)a |
| RHCE*C/c | 0.515 (417) | 0.427 (159)a | 0.427 (171)b | 0.490 (465) | 0.369 (106)c | 0.398 (78)b |
| RHCE*c/c | 0.310 (251) | 0.412 (154)b | 0.398 (159)b | 0.340 (322) | 0.499 (143)c | 0.500 (98)c |
| RHCE*E/E | 0.067 (54) | 0.026 (10)b | 0.022 (9)b | 0.020 (19) b | 0.027 (8)a | 0.020 (4)a |
| RHCE*E/e | 0.232 (187) | 0.255 (95) | 0.257 (103) | 0.260 (246) | 0.212 (61) | 0.189 (37) |
| RHCE*e/e | 0.701 (564) | 0.719 (268) | 0.721 (288) | 0.720 (683) | 0.761 (218) | 0.791 (155)a |
| Duffy system | ||||||
| FY*A/FY*A | 0.176 (143) | 0.184 (69) | 0.125 (50)a | 0.120 (114)b | 0.098 (28)b | 0.127 (25) |
| FY*A/FY*B | 0.493 (399) | 0.473 (176) | 0.480 (192) | 0.480 (455) | 0.397 (114) b | 0.460 (90) |
| FY*B/FY*B | 0.331 (268) | 0.343 (128) | 0.395 (158)a | 0.400 (379)b | 0.505 (145)c | 0.413 (81)a |
| Duffy Null | ||||||
| GATA-67 T/T | 0.935 (757) | 0.944 (352) | 0.780 (312)c | 0.690 (654)c | 0.568 (163)c | 0.318 (62)c |
| GATA-67 T/C | 0.061 (50) | 0.037 (14) | 0.195 (78)c | 0.250 (237)c | 0.297 (85)c | 0.492 (97)c |
| GATA-67 C/C | 0.004 (3) | 0.019 (7)b | 0.025 (10)b | 0.060 (57)c | 0.135 (39)c | 0.190 (37)c |
| Kidd system | ||||||
| JK*A/JK*A | 0.225 (182) | 0.295 (110)b | 0.272 (109) | 0.280 (265)b | 0.383 (110)c | 0.378 (74)c |
| JK*A/JK*B | 0.532 (431) | 0.472 (176) | 0.480 (192) | 0.520 (493) | 0.457 (131)a | 0.480 (94) |
| JK*B/JK*B | 0.243 (197) | 0.233 (87) | 0.248 (99) | 0.200 (190)a | 0.160 (46) b | 0.142 (28)b |
| Kell system | ||||||
| KEL*01/KEL*01 | 0.006 (5) | 0 | 0.002 (1) | 0a | 0 | 0 |
| KEL*01/KEL*02 | 0.060 (49) | 0.057 (21) | 0.050 (20) | 0.049 (47) | 0.041(12) | 0.036 (7) |
| KEL*02/KEL*02 | 0.934 (756) | 0.943 (352) | 0.948 (379) | 0.951 (901) | 0.959 (275) | 0.964 (189) |
| Diego system | ||||||
| DI*01/DI*01 | 0.016 (13) | 0a | -nt | 0 c | -nt | 0 |
| DI*01/DI*02 | 0.030 (24) | 0.056 (21)a | -nt | 0.040 (38) | -nt | 0.030 (6) |
| DI*02/DI*02 | 0.954 (773) | 0.944 (352) | -nt | 0.960 (910) | -nt | 0.970 (190) |
| MNS system | ||||||
| GYPB*S/GYPB*S | 0.126 (102) | -nt | -nt | 0.090 (86)a | -nt | -nt |
| GYPB*S/GYPB*s | 0.436 (353) | -nt | -nt | 0.380 (360)a | -nt | -nt |
| GYPB*s/GYPB*s | 0.438 (355) | -nt | -nt | 0.530 (502)c | -nt | -nt |
n = number of subjects, n = number of subjects with genotype, -nt = not-tested.
The FY*A/FY*A genotype was observed in 143 (17.6%) samples, FY*A/FY*B, in 399 samples (49.3%) and FY*B/FY*B, in 268 (33.1%) samples. The FY*B/FY*B compared frequencies were different, mainly in Minas Gerais (p < 0.001), São Paulo (p < 0.01) and Bahia (p < 0.05) (Table 1). The mutation (c.1-67T>C), which occurs in the GATA-box gene promoter region and prevents the expression of the FY*B allele on the membrane of red blood cells, was evaluated. For this polymorphism, 3 (0.4%) samples were genotyped as being homozygous (GATA-67C/C), 50 (6.1%), as heterozygous (GATA-67T/C) and the vast majority, 757 samples (93.5%), without this mutation (GATA-67T/T). All of the homozygous samples (GATA-67C/C) had the FY*B/FY*B genotype, which corresponds to the Fy(a-b-) phenotype. The GATA-67C/C genotype was more frequent in other regions than in our study (p < 0.01).
The Kidd systemThe genotype distribution for the Kidd system for the genotype JK*A/JK*A was observed in 182 (22.5%) samples, JK*A/JK*B, in 431 (53.2%) and JK*B/JK*B, in 197 (24.3%). For comparisons, the JK*A/JK*A was more frequent in Santa Catarina, São Paulo (p < 0.01) and Minas Gerais, Bahia (p < 0.001) (Table 1).
The Kell systemFor the Kell system, 5 samples (0.6%) were genotyped for the rare KEL*01/KEL*01 genotype, 49 samples (6.0%), for the KEL*01/KEL*02 genotype and 756 genotyped samples (93.4%), for the KEL*02/KEL*02 genotype. The Kell values were not different from those of the other regions.
The Diego systemThe genotype frequencies for the Diego blood group were 13 samples (1.6%) for DI*01/DI*01, 24 samples (3%), for DI*01/DI*02 and 773 samples (95.4%), for DI*02/DI*02. The presence of genotype DI*01/DI*01 was higher in our study than in Santa Catarina (p < 0.05) and São Paulo (p < 0.001) (Table 1).
The MNS systemThe genotype distribution for the MNS system for the genotype GYPB*S/GYPB*S was observed in 102 (12.6%) samples, GYPB*S/GYPB*s, in 353 (43.6%) and GYPB*s/GYPB*s, in 355 (43.8%). The genotype GYPB*s/GYPB*s was more common in relation to São Paulo (p < 0.001) (Table 1).
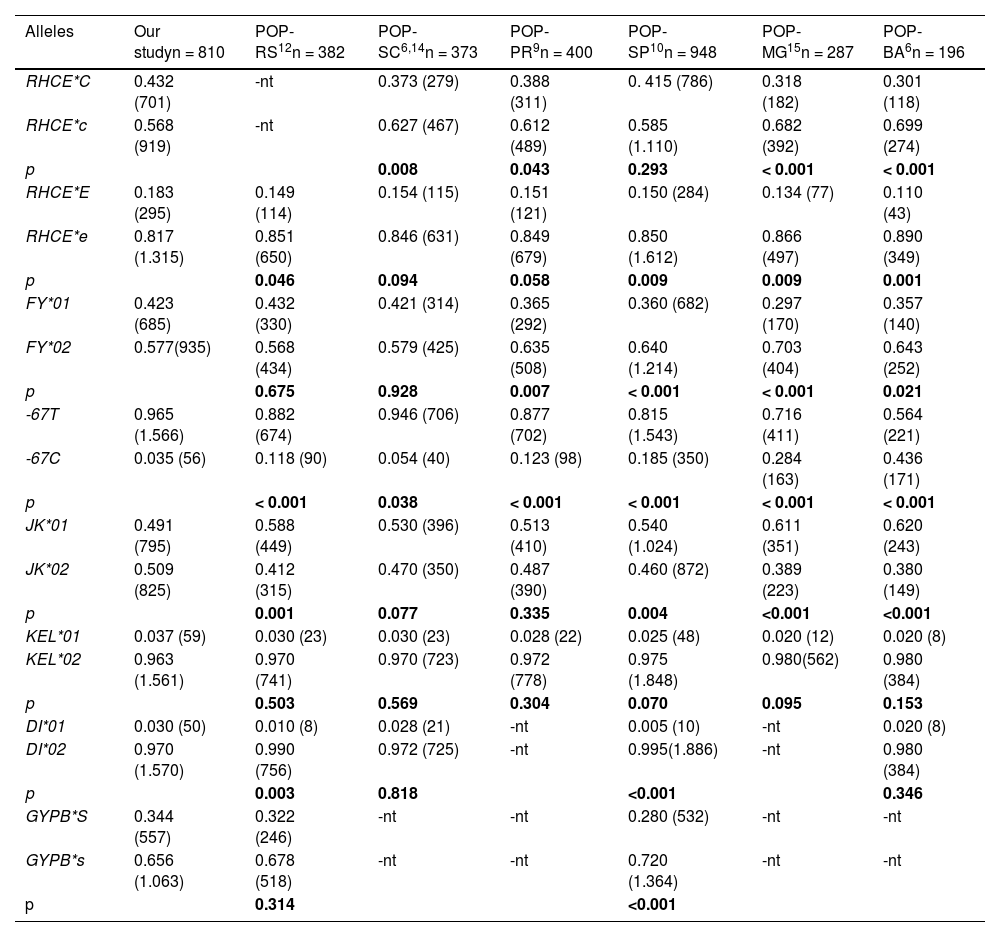
Comparison of allelic frequencies with other Brazilian populationsThe allelic frequencies are shown in Table 2. For the Rh system, allele c was the most frequent (56.8%) for comparisons and was significantly different from all other regions, except São Paulo (p = 0.293). The allele e was the most frequent (81.7%) and was significantly different from Porto Alegre (p = 0.046), São Paulo, Minas Gerais (p = 0.009) and Bahia (p < 0.001).
Comparison of allelic frequencies for the Rh, Duffy, Kell, Kidd, MNS and Diego blood group systems in voluntary blood donors in the population in northwest Rio Grande do Sul with other regions of Brazil.
| Alleles | Our studyn = 810 | POP-RS12n = 382 | POP-SC6,14n = 373 | POP-PR9n = 400 | POP-SP10n = 948 | POP-MG15n = 287 | POP-BA6n = 196 |
|---|---|---|---|---|---|---|---|
| RHCE*C | 0.432 (701) | -nt | 0.373 (279) | 0.388 (311) | 0. 415 (786) | 0.318 (182) | 0.301 (118) |
| RHCE*c | 0.568 (919) | -nt | 0.627 (467) | 0.612 (489) | 0.585 (1.110) | 0.682 (392) | 0.699 (274) |
| p | 0.008 | 0.043 | 0.293 | < 0.001 | < 0.001 | ||
| RHCE*E | 0.183 (295) | 0.149 (114) | 0.154 (115) | 0.151 (121) | 0.150 (284) | 0.134 (77) | 0.110 (43) |
| RHCE*e | 0.817 (1.315) | 0.851 (650) | 0.846 (631) | 0.849 (679) | 0.850 (1.612) | 0.866 (497) | 0.890 (349) |
| p | 0.046 | 0.094 | 0.058 | 0.009 | 0.009 | 0.001 | |
| FY*01 | 0.423 (685) | 0.432 (330) | 0.421 (314) | 0.365 (292) | 0.360 (682) | 0.297 (170) | 0.357 (140) |
| FY*02 | 0.577(935) | 0.568 (434) | 0.579 (425) | 0.635 (508) | 0.640 (1.214) | 0.703 (404) | 0.643 (252) |
| p | 0.675 | 0.928 | 0.007 | < 0.001 | < 0.001 | 0.021 | |
| -67T | 0.965 (1.566) | 0.882 (674) | 0.946 (706) | 0.877 (702) | 0.815 (1.543) | 0.716 (411) | 0.564 (221) |
| -67C | 0.035 (56) | 0.118 (90) | 0.054 (40) | 0.123 (98) | 0.185 (350) | 0.284 (163) | 0.436 (171) |
| p | < 0.001 | 0.038 | < 0.001 | < 0.001 | < 0.001 | < 0.001 | |
| JK*01 | 0.491 (795) | 0.588 (449) | 0.530 (396) | 0.513 (410) | 0.540 (1.024) | 0.611 (351) | 0.620 (243) |
| JK*02 | 0.509 (825) | 0.412 (315) | 0.470 (350) | 0.487 (390) | 0.460 (872) | 0.389 (223) | 0.380 (149) |
| p | 0.001 | 0.077 | 0.335 | 0.004 | <0.001 | <0.001 | |
| KEL*01 | 0.037 (59) | 0.030 (23) | 0.030 (23) | 0.028 (22) | 0.025 (48) | 0.020 (12) | 0.020 (8) |
| KEL*02 | 0.963 (1.561) | 0.970 (741) | 0.970 (723) | 0.972 (778) | 0.975 (1.848) | 0.980(562) | 0.980 (384) |
| p | 0.503 | 0.569 | 0.304 | 0.070 | 0.095 | 0.153 | |
| DI*01 | 0.030 (50) | 0.010 (8) | 0.028 (21) | -nt | 0.005 (10) | -nt | 0.020 (8) |
| DI*02 | 0.970 (1.570) | 0.990 (756) | 0.972 (725) | -nt | 0.995(1.886) | -nt | 0.980 (384) |
| p | 0.003 | 0.818 | <0.001 | 0.346 | |||
| GYPB*S | 0.344 (557) | 0.322 (246) | -nt | -nt | 0.280 (532) | -nt | -nt |
| GYPB*s | 0.656 (1.063) | 0.678 (518) | -nt | -nt | 0.720 (1.364) | -nt | -nt |
| p | 0.314 | <0.001 |
n = number of subjects, -nt = not-tested.
ap < 0.05
bp < 0.01
cp < 0.001 with Chi-square test or Fisher's exact test, compared in our study. POP-RS: Blood donors in Porto Alegre, Rio Grande do Sul.12 POP-SC: Blood donors in Santa Catarina,6,14 POP-PR: Blood donors in Paraná, southern Brazil,9 POP-SP: Blood donors in São Paulo,10 POP-MG: Blood donors in Minas Gerais,15 POP-BA: Admixed population in Bahia.6,10
The FY*02 allele was more frequent (57.7%) and different from that in Paraná (p = 0.007), São Paulo, Minas Gerais (p < 0.001) and Bahia (p = 0.021). For variant c.1-67T>C, the allele -67T was most frequent (96.5%) and different from Porto Alegre, Paraná, São Paulo and Minas Gerais (p < 0.001). The JK*02 was 50.9% in our study and was different from Porto Alegre, Minas Gerais, Bahia (p < 0.001) and São Paulo (p = 0.004). The alleles KEL*01 and KEL*02 were not different from those in our study. The frequency of the allele DI*01 was 3% in our study and was different from Porto Alegre (p = 0.003) and São Paulo (p < 0.001). The GYPB*S were different in São Paulo (p < 0.001).
We also computed pairwise DST genetic distances between populations of the study. Multidimensional scaling was applied to DST distances to produce Figure 1. The main result of the genetic distance analysis showed that the populations of the states Paraná, Minas Gerais and Bahia are genetically different from other populations. The population in our study, on the other hand, is similar to populations in the states São Paulo and Santa Catarina and shows some differences from the population of Porto Alegre (RS).

Nonmetric multidimensional scaling of DA genetic distances among 7 population samples, based on the Rh, Kell, Kidd, MNs, Duffy and Diego red cell polymorphisms. OUR: Populations of this study, RS: Blood donors in Porto Alegre, Rio Grande do Sul,14 SC: Blood donors in Santa Catarina,5,16 PR: Blood donors in Paraná, southern Brazil,10 SP: Blood donors in São Paulo,11 MG: Blood donors in Minas Gerais,13 BA: Admixed population in Bahia.5,11
The Brazilian population is one of the most heterogeneous in the world, as a result of the intense process of miscegenation.3 The process of colonization was highly diverse in different regions; for instance, in the Rio Grande do Sul population, the composition of Europeans, Africans and Amerindians was 72.9%, 14% and 13%, respectively,4 which explains the high prevalence of European ancestry in this study.
The most frequent blood group genotypes found in this study population were RHC*Cc, RHC*ee, FY*A/FY*B, GATA-67 T/T, KEL*02/KEL*02, JK*A/JK*B and DI*02/DI*02. Some significant differences were observed when comparing the population in this study with populations from other states in Brazil, mainly with populations from Minas Gerais (MG), Bahia (BA) and São Paulo (SP) for the Rh, Duffy, Kidd, Diego and MNS blood group systems.10,15
In our study, the frequency of the RHCE*Cc genotype was higher, when compared to the populations of the studies from Santa Catarina and Paraná,6,9,14 which is also different from the study carried out in the southeast (Minas Gerais) and the study in the northeast (Bahia)6,15; in these populations, the most frequent genotype was the RHCE*cc. There is a high prevalence of the RHCE*cc in Afro-descendants,19 which can be explained by the southeast and northeast of the country having the greatest African presence.8,12 The RHC*ee genotype was more frequent, in relation to the RHC*Ee and RHC*EE, similar to those found in the other Brazilian populations studied.8,15
The most frequent genotype for the Duffy system was FY*A/FY*B, different from the studies in Minas Gerais and Bahia. In a study carried out in the population of the state of Pará, the frequency for the FY*A/FY*B was 29.1%,20 while the present study showed 49.3%. The Duffy glycoprotein is a receptor in the erythrocyte membrane for malaria protozoa in red blood cells (RBCs).21 The point mutation c.1-67T> C in the promoter region of the GATA-box gene impairs the expression of the Fyb antigen, causing the phenotype known as Fy (a-b-), which is also known as erythrocyte silent (Fybes).22 Comparing the allelic frequencies of our study, performed in northwest Rio Grande do Sul, with the study carried out in Porto Alegre, we observed differences for the null allele (FY*02N.01 or FY*BES) homozygotes. The frequency of this allele was higher in Porto Alegre,12 Paraná,9, São Paulo10 and Bahia.6,14 This difference can probably be explained by the fact that these studies present a population with a greater presence of African descent, as this allele has a frequency greater than 98% in Africans.23 On the other hand, in SC, the frequency of this allele was 5.3%, similar to that in our study.
For the Kidd system, the genotype JK*A/JK*B was more frequent, similar to the frequencies found in the studies in SC, PR and SP. However, the opposite was observed in the MG and BA studies, in which the JK*A/JK*A genotype was the most frequent. There was a significant difference in the presence of the JK*01 allele in São Paulo, Minas Gerais and Bahia in our study.
There were no differences in the Kell system antigens, both genotypic and allelic, when compared to the other Brazilian populations studied.
In transfusion practice, antibodies against the M and N antigens are not problematic and rarely cause hemolysis. On the other hand, antibodies against S, s and U antigens are clinically significant. There are few studies that report the frequency of the MNS system in blood donors in Brazil; comparing the frequency of the GYPB*S allele with the study performed with SP donors, we observed differences.10
The first antigen identified in the Diego blood system was the Dia antigen, in 1953, in a Venezuelan woman after the birth of a baby with hemolytic disease of the newborn (HDRN).24 Years later, the Dib antigen was identified.25 Since then, a total of 22 Diego antigens have been discovered dispersed; two alleles, DI*B and DI*A, responsible for the expression Dib and Dia antigens respectively. The Dia antigen (DI*01 allele) is considered an anthropological marker of Native American populations.26,27 In our study, the frequency of the genotype DI*01/DI*01 was 1.6%, different from studies carried out in SC, SP and BA, that did not observe the genotype in their work. In the study by Zacarias et al. (2016),8 which evaluated donors of Japanese descent in southwest Paraná, the frequency for the genotype was 0.4%.
In our work, the frequency found for the DI*01 allele was 3.0%, similar to the frequency found in SC (2.8%) and greater than those found in SP (0.5%) and BA (2%). The higher frequency of the DI*01 allele in our study can be explained by the possible presence of native Americans in our study population. Santa Rosa was a neighborhood in the territory of the “Sete Povos das Missões”, the name given to the group of seven indigenous villages founded by the Jesuits and Spaniards at the end of the 17th century and beginning of the 18th century. In the study performed by Rodrigues et al. (2021),27 which evaluated samples of native Americans, a frequency for the DI*01 allele of 11.8% was found in the Kaigang and 6.8% in the Guaranis, presenting a high frequency, when compared to the Brazilian population (range: 0.9% - 4.3%),27 except when compared to the study with the population of Japanese descent, which presented a frequency for the allele of 4.8%, similar to that of the Guarani.5
It is not always possible to phenotype all clinically relevant antigens in routine blood bank screening due to difficulties in finding specific anti-sera, such as for the Diego system antigens. Anti-serum for the Dia and Dib antigens is extremely expensive and has a short shelf life and low volume, which make them inefficient for use in routine immunohematology.28 Currently, the Brazilian legislation does not include research on Diego antigens in the phenotyping of erythrocytes, so these antigens are only researched in specific cases.29 In hemotherapy services, knowledge on the prevalence of blood group antigens is important to meet the transfusion needs of the population served; therefore, these services must be prepared for opportune cases or for low-frequency occurrences.8,27
In general, the analysis of the genetic distance is similar to those of the populations in the studies performed in São Paulo and Santa Catarina. Although the self-declaration of ethnicity does not accurately assess ancestry in the Brazilian population, our results indicate that the population of our study was not very close to the population of Porto Alegre, a city located in the same state. This was expected because, in our study, only 1.2% declared themselves black, while in the study in Porto Alegre, 12.5% declared themselves black. The same situation can be applied to studies in Paraná, Minas Gerais and Bahia, as they have a greater African presence.3,4
It is important that studies determining the frequencies of the genotypes be useful in transfusion medicine in creating a database of genotyped donors to facilitate the selection of suitable blood components for patients. Genotyping can also contribute to the identification of rare alleles. We highlight the importance of identifying rare alleles, such as the Dia (DI*01) and K (KEL*01) antigens and variation c.1-67T>C. Overall, the results obtained in our study can be used for anthropological comparisons and contribute to the knowledge of the distribution of genotypes and phenotypes in the donors in Rio Grande do Sul.
The authors are very grateful to nurse Rosane Werlang Schneider (in memorium) for her contribution and dedication to this study. We would also like to thank the nursing technicians at the Hemosar and the CAPES for their financial support.


