


Efficient classification of T-acute lymphoblastic leukemia (T-ALL) involves considering various factors, such as age, white blood cell count, and chromosomal alterations. However, studying protein markers are crucial to improving T-ALL patients' diagnosis and treatment. A study analyzing the expression of proteomes was conducted to identify promising early-stage biomarkers for T-ALL patients
MethodsLabel-free liquid chromatography-tandem mass spectrometry (LC-MS/MS) was used to analyze the blood proteins of both patients and healthy individuals to identify new biomarkers for T-ALL. The findings were validated by RT-PCR, ELISA and computational analysis
ResultsThe study identified 1467 proteins in the blood, of which nine were upregulated and 35 were downregulated by more than 2-fold. T-ALL patients showed a significant increase in specific disease-related proteins, such as eleven-nineteen lysine-rich leukemia protein, triggering receptor expressed on myeloid cells 1, cisplatin resistance-associated-overexpressed protein, X-ray radiation resistance-associated protein 1, tumor necrosis factor receptor superfamily member 10D, protein S100-A8, and copine-4, by more than 3-fold
ConclusionThe findings of this study provide a valuable protein map of leukemic cells and identify potential biomarkers for leukemic aggressiveness. However, further studies using larger T-ALL patient samples must confirm these preliminary results.
Acute leukemia is an outcome of genetic and phenotypic diseases that generally involve lineages of T-acute lymphoblastic leukemia (T-ALL - T-cell progenitors) and B-ALL (B-cell progenitors)1; it accounts for 25 % of all pediatric leukemia.2 However, T-ALL diagnosis involves a pre-examination based on white blood cell (WBC) counts, age and blast cells. In contrast, although a partial confirmation of this disease can be found by karyotyping, flow cytometry, fluorescence in situ hybridization (FISH) and translocations, further validated using reverse transcription polymerase chain reaction (RT-PCR) is necessary. The risk of this disease in the peripheral blood can be confirmed by all these techniques.3 At the same time, definitive confirmation is carried out by immunophenotyping and cytogenetic analysis of bone marrow aspirates.4 Currently, no option exists that can identify T-ALL at early stages. So in this study, some early-stage proteomic molecular markers in peripheral blood that might be involved in the pathophysiology of T-ALL were explored using more sophisticated techniques, such as label-free liquid chromatography-tandem mass spectrometry (LC-MS/MS), which are not operating as diagnostic perspectives in this disease. Using a proteomic registry, novel alternative potential biomarkers for diagnosing T-ALL were found, using different body fluids, thereby embracing a new era with the diagnostic perspective of noninvasive or minimally invasive fluid collected from patients.5–7 Blood is a complex fluid that consists of several excretory proteins that might play an essential role in the pathogenesis of T-ALL, so searching for diagnostic factors, especially for blood diseases, will prove more credential than genomic or transcriptomic factors.6,8 Extensive label-free detection of proteomic data by LC-MS/MS provides much information about the differential expression of proteins and can also detect absolute concentrations.
Proteomic studies can identify biological functions and help establish biochemical networks. Overall, it can be concluded that proteins are characteristic of the cells. Absolute concentrations of the proteins identify disease-specific biomarkers. In contrast, comparing protein expression levels can depict the expression in two groups, such as in healthy controls and cases.9 Early diagnosis of T-ALL is crucial for successful treatment and improved outcomes. One significant discovery that could aid in the early diagnosis of T-ALL is the identification of specific biomarkers associated with the disease. Biomarkers are biological molecules that indicate the presence of a disease; their identification can help to detect cancer at an early stage. Recent advances in genomic, proteomic, and other “-omic” technologies have led to the discovery of new potential biomarkers for various types of cancer, including T-ALL. For example, studies have identified genetic mutations and alterations in specific genes associated with T-ALL. These biomarkers can be used to develop more accurate diagnostic tests and targeted therapies for T-ALL patients. Another critical area of research is the development of new imaging techniques that can detect T-ALL at an early stage. For example, researchers are exploring the use of positron emission tomography (PET) scans and magnetic resonance imaging (MRI) to identify early signs of T-ALL in patients. Overall, a better understanding of the genetic and molecular basis of T-ALL and the development of new diagnostic tools and techniques are essential for early detection and improved outcomes for patients with this disease.
Since T-ALL is the leukemia subtype with the highest incidence, this study aimed to examine the peripheral blood proteome searching for potential biomarkers to identify early markers in order to improve the perspective for treatment.
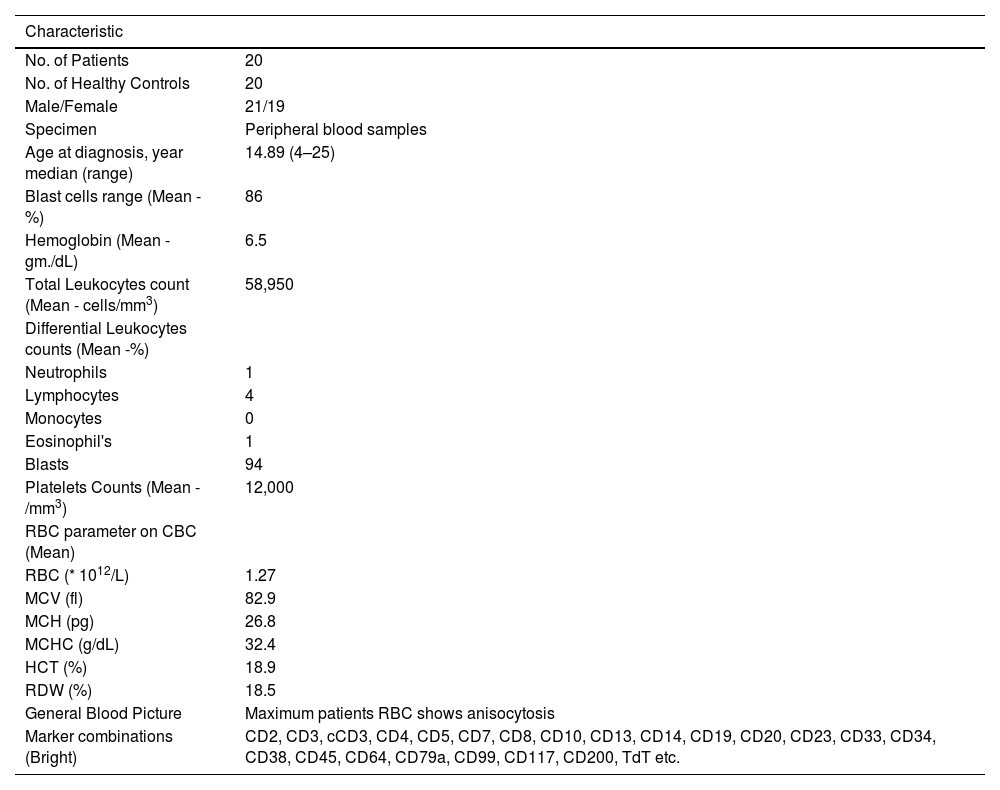
Materials and methodsPatient samples and clinical diagnosisT-ALL whole blood samples were obtained from the Department of Pathology and Clinical Haematology, registered under the Leukaemia and Lymphoma Society at King George's Medical University, Lucknow, U.P., India. Twenty whole blood samples were collected from each group (T-ALL patients and healthy controls) in an aseptic environment in ethylenediaminetetraacetic acid (EDTA) vials. Only patients who had not undergone any chemotherapy cycles were included in the study to ensure accuracy. Patients' diagnoses were based on age, symptoms, complete blood counts and bone marrow examination. Immunophenotyping markers, including CD34, CD33, CD14, CD20, CD10, CD19, HLA-DR, TdT, CD2, CD3, CD5, CD7, CD13, CD19, CD20, CD23, CD45, CD64, CD79a, CD117, and CD 200, were used. The pharmaceutical contents are listed in Table 1. The samples were sent to the Department of Biochemistry, KGMU, Lucknow, India, for the molecular study. Blood smears were prepared on glass slides and stained with Leishman stain for approximately two minutes until a pinkish tinge transformation occurred. In suspected leukemia cases, the films show turbid coats after Leishman staining.10
Overview of clinical characteristics of T-ALL patients.
Inclusion criteria: All under 18-year-old patients with a first-time diagnosis of T-ALL were included in this study.
Exclusion criteria: Smokers and patients with other acute or chronic diseases were excluded from this study.
T-ALL was further confirmed using CD markers (flow cytometry)A combination of monoclonal antibodies was used to confirm the T-ALL samples. These antibodies came in different types, such as anti-CD45, anti-CD34, anti-CD33, anti-CD79a, anti-CD13, anti-CD19, anti-CD25, anti-CD20, anti-CD7, anti-CD10, anti-CD14, anti-CD64, anti-CD117, HLA-DR, anti-CD3, anti-CD4 and anti-CD8. The antibodies were labeled with FITC, PE, PerCP, and PE-Cy7. All these reagents were obtained from BD Biosciences in San Jose, CA, USA.
The stain lyse method was used to confirm the disease. Each bone marrow or white blood sample (100 μL) was mixed with 20 μL of an antibody cocktail in each tube and incubated for 15 min in a dark environment. Fluorescence-activated cell sorting lysis solution was added to each tube and the samples were centrifuged at 200–300 g for five minutes. The supernatant was discarded and the samples were washed with sheath fluid three times before being resuspended in 0.5 mL of sheath fluid and run on a pre-calibrated flow cytometer. The data were analyzed and procured from FACSCanto (BD Biosciences).
Isolation and estimation of T-ALL proteins by using sodium dodecyl-sulfate polyacrylamide gel electrophoresis and bicinchoninic acid assaysProtein was isolated from whole blood and bone marrow samples using radioimmunoprecipitation assay (RIPA) buffer, and the integrity and purity were analyzed using ultraviolet spectrophotometry (quantitative analysis). The concentration of protein was measured by bicinchoninic acid (BCA) estimation (Abcam) (quantitative analysis) at 562 nm following the manufacturer's protocol and the integrity and purity of the protein were measured by sodium dodecyl-sulfate polyacrylamide gel electrophoresis (SDS-PAGE qualitative analysis).
Protein profiling was analyzed using liquid chromatography-tandem mass spectrometryProteins isolated from T-ALL samples (20 samples: 20 whole blood and two bone marrow samples) and healthy controls (20 whole blood samples) were analyzed by LC-MS/MS. Ten random protein samples were selected from 20 sets of isolated proteins from whole blood and bone marrow tissues from T-ALL and ten from healthy controls. These were pooled and each sample tagged with a code to see the individual data sets. The BCA method normalized the sample concentration and then the samples were pooled using the same volume (100 µL from each protein sample) and 200 µL of each sample was sent in separate vials for the LC-MS/MS analysis.
In solution protein digestion before liquid chromatography-tandem mass spectrometryOne hundred micrograms of protein samples were digested and diluted with 50 mM NH4HCO3. The samples were treated with 100 mM dithiothreitol for 1 hour at 95 °C and 250 mM IDA was added in a dark environment for 45 min at room temperature. After digestion, the samples were incubated with trypsin overnight at 37 °C. The samples were mixed with 50 μL of 0.1 % formic acid in water and dried under vacuum. Finally, the samples were centrifuged at 10,000 rpm and the supernatant collected in Eppendorf tubes.
Protein identification by liquid chromatography-tandem mass spectrometryTen microliters of the cleaned sample was separated into peptides using a BHE C18 ultra-performance liquid chromatography UPLC column. The peptides were then analyzed using a Waters Synapt G2 Q-TOF instrument with an electrospray ionization source to obtain the complete integrated sequence of the sample. The MassLynx 4.1 WATERS peptide editor software was used to analyze the raw data. Using PLGS software, WATERS, individual peptide MS/MS spectra were matched to the database sequence. The decoy database strategy filters peptide and protein identifications at a false discovery rate of 1 %. Proteins that could not be differentiated based on MS/MS spectra alone were grouped into protein groups. UPLC connected with a Waters Synapt G2 (QTOF) was used to acquire mass spectrometry data. During the processing of the sample, cysteine sites were modified to carbamidomethylated cysteine, and the methionine sites were prone to oxidation, which was considered a variable modification to the mass.11–13 Quantitative details are given in Table S1.
Protein-protein interaction network analysisIn this study, the functional interactions of proteins were predicted using the STRING database. This database integrates both known and predicted protein-protein interactions (PPIs). Only human experimental proteins with an interaction score greater than 0.4 were included to construct the PPI networks. The proteins are represented as network nodes and their interactions are illustrated as edges.
Gene expressionRNA was extracted from whole blood and bone marrow tissues using the TRIzol method from Ambion. The concentration and integrity of the RNA were confirmed using a Nanodrop 2000 UV–Vis spectrophotometer (Thermo Scientific). RNA with an absorbance ratio of 1.9–2.0 at 260/280 nm was utilized. The isolated mRNA was reverse-transcribed using a high-capacity cDNA reverse transcription kit from a specific manufacturer. Quantitative reverse transcription-polymerase chain reaction (qRT-PCR) was carried out using PowerUp SYBR green master mix from ABI on a 7500 fast real-time polymerase chain reaction system (Applied Biosystem, Thermo Scientific). Quantification was executed using the ΔΔ Ct method with β-actin as a reference gene, and the RT-PCR outcomes were analyzed by DataAssist software (Thermo Scientific). Oligonucleotide primers are listed in Table S2. All primers were analyzed with positive controls by performing melting profiles after qRT-PCR, and product sizes were verified by 2.2 % agarose gel electrophoresis. The PCR conditions were 40 cycles of 15 s at 95 °C, 15 s at the annealing temperature (60 °C for all other genes), and 15 s at 72 °C. Specimens were assayed in duplicate in at least three independent experiments.
Enzyme-linked immunosorbent assayWhole blood samples were also collected in a plain vial for serum analysis. Serum samples were analyzed using a commercially available enzyme-linked immunosorbent assay (ELISA) kit (ELL ELISA kit abx387124, Human copine (CPNE4) ELISA kit- MBS7204256, TNFRSF10D ELISA Kit MBS700345, S100A8 ELISA Kit LS-F4982) following the manufacturer's instructions.
Statistical analysisThe data analysis was conducted using GraphPad Prism-9 and SPSS version 16.0. Controls were used for all comparisons and any differences observed were denoted by *p-value <0.01, **p-value <0.001, ***p-value <0.0001, ****p-value <0.00001. The quantitative data are the mean ± standard deviation (SD) derived from at least three samples per data point.
ResultsClinical diagnosis of human T-ALLIn this study, blood and bone marrow samples were analyzed from patients with T-ALL. The morphology of blast crisis cells from peripheral blood smears, bone marrow aspirate smears, bone marrow trephine biopsy specimens, immunophenotypic findings and flow cytometry are presented in Figure 1(A). Leishman dye was used to stain the blast cells. Different biomarkers, such as CD34, CD33, CD14, CD20, CD10, CD19, HLA-DR, TdT, CD2, CD3, CD5, CD7, CD13, CD19, CD20, CD23, CD45, CD64, CD79a, CD117, and CD 200, were also identified using flow cytometry. The expressions of T-lymphoid markers (CD3, cytoplasmic CD3, CD2, CD5, CD7) and immaturity markers (CD34, TdT, HLA-DR) were also studied. The analysis of different patients' flow cytometry data is presented in Figure 1 (B-I) and summarized in Table 1. The results showed that 95 % of patients had approximately 14,000 blast cells in 20,000 events, with 90 % of blast cells gated on dim CD45 and extended to the monocytic region on CD45 versus the side scatter plot. The findings of flow cytometry analysis confirmed the presence of blast cells in T-ALL patients.
 Representative images of Leishman staining of the blood of T-ALL patients, in which the majority of cells were in the blast crisis phase (arrows show blast cells). (B-I) Flow cytometry results show the blast cells in T-ALL patients, which were plotted on CD45 with side scatter and plotted on the marker and marker vs. marker for the confirmation of T-ALL. Blast cells were gated on CD45 vs. side scatter. The expressions of T-lymphoid markers (CD3, cytoplasmic CD3, CD2, CD5, CD7) and immaturity markers (CD34, TdT, HLA-DR) were studied.")
The clinical diagnosis of T-ALL patients was confirmed by peripheral blood and bone marrow tissues. (A) Representative images of Leishman staining of the blood of T-ALL patients, in which the majority of cells were in the blast crisis phase (arrows show blast cells). (B-I) Flow cytometry results show the blast cells in T-ALL patients, which were plotted on CD45 with side scatter and plotted on the marker and marker vs. marker for the confirmation of T-ALL. Blast cells were gated on CD45 vs. side scatter. The expressions of T-lymphoid markers (CD3, cytoplasmic CD3, CD2, CD5, CD7) and immaturity markers (CD34, TdT, HLA-DR) were studied.
This study examined the proteomes of twenty T-ALL patients and twenty healthy controls, with 1467 proteins quantified in the label-free analysis. Protein isolation from blood samples was validated by BCA and SDS-PAGE tests. A differential protein level comparison was then made between blood samples from healthy controls and T-ALL patients. Proteins upregulated by >2-fold or downregulated by <2-fold in blood were deemed significant. The outcomes revealed nine upregulated proteins and 35 downregulated proteins, with a heat map created to illustrate the changes in blood proteins. This heat map indicated 35 differentially expressed proteins and nine signature proteins unique to T-ALL patients all of which were not found in healthy controls. These findings suggest that these proteins have a distinct signature in T-ALL only, as shown in Figure 2 (A-Q). The study also found that several proteins significantly decreased by 1.5-fold, including WD repeat-containing protein 26, interleukin 1, CD99 antigen, caspase recruitment domain-containing protein 9, NADPH oxidase, RING-type E3 ubiquitin-protein ligase, circadian locomotor output cycles protein kaput, a disintegrin and metalloproteinase domain-containing protein 8, neurogenic locus notch homolog protein 4, integrin beta-2, gamma-interferon-inducible protein 16, zinc finger protein Aiolos, mitogen-activated protein kinase, interferon-responsive finger protein 1, interleukin-1 receptor-associated kinase-like 2, and interleukin-18 receptor accessory protein. On the other hand, eleven lysine-rich leukemia proteins, triggering receptor expressed on myeloid cells 1, cisplatin resistance-associated-overexpressed protein, X-ray radiation resistance-associated protein 1 (XRRA1), tumor necrosis factor receptor superfamily member 10D, protein S100-A8, and copine-4, were significantly increased by more than 3-fold in T-ALL patients compared to healthy controls. All other proteins are shown in Supplementary Table S3.
. (A) shows the integrity of proteins isolated from healthy controls and T-ALL patients (Lanes 1–4 show healthy controls, and Lanes 5–9 show T-ALL patients), whereas (B-I) shows protein estimation, which was analyzed by the bicinchoninic acid kit. (J-M) shows the LC-MS/MS spectra of healthy controls and T-ALL patients. (N-P) shows 35 differentially expressed proteins in healthy controls and T-ALL patients, whereas the heatmap also shows the overall cumulative differential expression of proteins expressed in both groups. (Q) Nine signature proteins were found only in T-ALL patients and not in healthy controls.")
. (A) shows the integrity of proteins isolated from healthy controls and T-ALL patients (Lanes 1–4 show healthy controls, and Lanes 5–9 show T-ALL patients), whereas (B-I) shows protein estimation, which was analyzed by the bicinchoninic acid kit. (J-M) shows the LC-MS/MS spectra of healthy controls and T-ALL patients. (N-P) shows 35 differentially expressed proteins in healthy controls and T-ALL patients, whereas the heatmap also shows the overall cumulative differential expression of proteins expressed in both groups. (Q) Nine signature proteins were found only in T-ALL patients and not in healthy controls.")
. (A) shows the integrity of proteins isolated from healthy controls and T-ALL patients (Lanes 1–4 show healthy controls, and Lanes 5–9 show T-ALL patients), whereas (B-I) shows protein estimation, which was analyzed by the bicinchoninic acid kit. (J-M) shows the LC-MS/MS spectra of healthy controls and T-ALL patients. (N-P) shows 35 differentially expressed proteins in healthy controls and T-ALL patients, whereas the heatmap also shows the overall cumulative differential expression of proteins expressed in both groups. (Q) Nine signature proteins were found only in T-ALL patients and not in healthy controls.")
. (A) shows the integrity of proteins isolated from healthy controls and T-ALL patients (Lanes 1–4 show healthy controls, and Lanes 5–9 show T-ALL patients), whereas (B-I) shows protein estimation, which was analyzed by the bicinchoninic acid kit. (J-M) shows the LC-MS/MS spectra of healthy controls and T-ALL patients. (N-P) shows 35 differentially expressed proteins in healthy controls and T-ALL patients, whereas the heatmap also shows the overall cumulative differential expression of proteins expressed in both groups. (Q) Nine signature proteins were found only in T-ALL patients and not in healthy controls.")
. (A) shows the integrity of proteins isolated from healthy controls and T-ALL patients (Lanes 1–4 show healthy controls, and Lanes 5–9 show T-ALL patients), whereas (B-I) shows protein estimation, which was analyzed by the bicinchoninic acid kit. (J-M) shows the LC-MS/MS spectra of healthy controls and T-ALL patients. (N-P) shows 35 differentially expressed proteins in healthy controls and T-ALL patients, whereas the heatmap also shows the overall cumulative differential expression of proteins expressed in both groups. (Q) Nine signature proteins were found only in T-ALL patients and not in healthy controls.")
Label-free screening of differential proteins in T-ALL by using liquid chromatography-tandem mass spectrometry (LC-MS/MS). (A) shows the integrity of proteins isolated from healthy controls and T-ALL patients (Lanes 1–4 show healthy controls, and Lanes 5–9 show T-ALL patients), whereas (B-I) shows protein estimation, which was analyzed by the bicinchoninic acid kit. (J-M) shows the LC-MS/MS spectra of healthy controls and T-ALL patients. (N-P) shows 35 differentially expressed proteins in healthy controls and T-ALL patients, whereas the heatmap also shows the overall cumulative differential expression of proteins expressed in both groups. (Q) Nine signature proteins were found only in T-ALL patients and not in healthy controls.
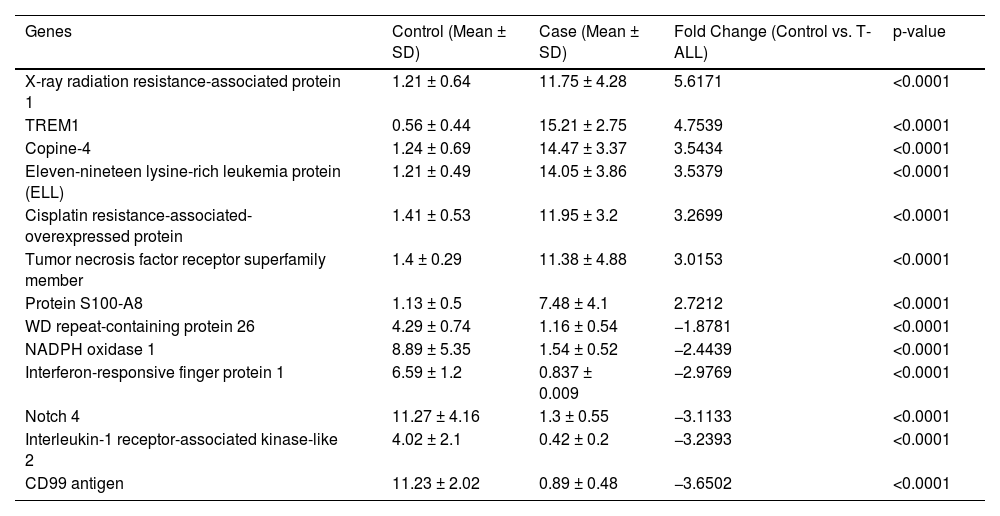
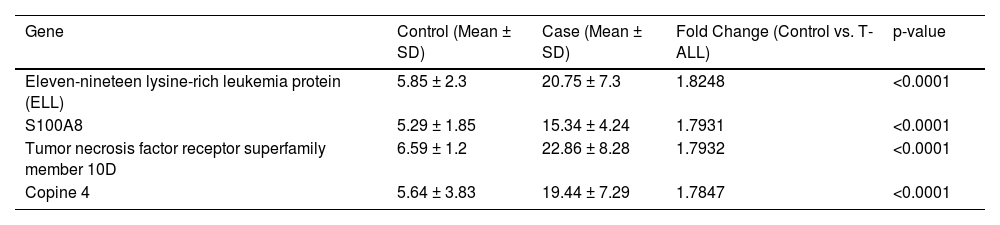
The molecular factors specific to T-ALL were validated by mRNA and protein level analysis. The genes included in this section were explicitly activated in T-ALL. The quantitative LC-MS/MS data were further validated by RT-PCR, which included XRRA1, TREM1, Copine-4, Eleven-nineteen lysine-rich leukemia protein (ELL), Cisplatin resistance-associated-overexpressed protein, tumor necrosis factor receptor superfamily member, Protein S100-A8, WD repeat-containing protein 26, NADPH oxidase 1, Interferon-responsive finger protein 1, Notch 4, Interleukin-1 receptor-associated kinase-like 2 and the CD99 antigen. The fold changes (control vs. TA-LL) for these genes were 5.6171, 4.7539, 3.5434, 3.5379, 3.2699, 3.0153, 2.7212, −1.8781, −2.4439, −2.9769, −3.1133, −3.2393 and −3.6502, respectively (p-value >0.0001) as shown in Figure 3 (A-M) and Table 2. The most significant factors were further validated by ELISA, which included eleven-nineteen lysine-rich leukemia protein (ELL), S100A8, tumor necrosis factor receptor superfamily member 10D, and copine 4 with fold changes of 1.8248, 1.7931, 1.7932, and 1.7847, respectively, as shown in Figure 4 (A-D) and Table 3.
. (A-M) Gene expression was quantified using RT-PCR in T-ALL patients (n = 20) and healthy controls (n = 20), where X-ray radiation resistance-associated protein 1, TREM1, Copine-4, Eleven-nineteen lysine-rich leukemia protein (ELL), Cisplatin resistance-associated-overexpressed protein, Tumor necrosis factor receptor superfamily member, Protein S100-A8, WD repeat-containing protein 26, NADPH oxidase 1, Interferon-responsive finger protein 1, Notch 4, Interleukin-1 receptor-associated kinase-like 2, and CD99 antigen had fold changes (Control vs. T-ALL) of 5.6171, 4.7539, 3.5434, 3.5379, 3.2699, 3.0153, 2.7212, −1.8781, −2.4439, −2.9769, −3.1133, −3.2393, and −3.6502, respectively (p-value >0.0001). All quantitative data are the mean ± standard deviation (SD), ****p-value <0.00001 and Student")
Selected gene expression was confirmed at the mRNA level using reverse transcription polymerase chain reaction (RT-PCR). (A-M) Gene expression was quantified using RT-PCR in T-ALL patients (n = 20) and healthy controls (n = 20), where X-ray radiation resistance-associated protein 1, TREM1, Copine-4, Eleven-nineteen lysine-rich leukemia protein (ELL), Cisplatin resistance-associated-overexpressed protein, Tumor necrosis factor receptor superfamily member, Protein S100-A8, WD repeat-containing protein 26, NADPH oxidase 1, Interferon-responsive finger protein 1, Notch 4, Interleukin-1 receptor-associated kinase-like 2, and CD99 antigen had fold changes (Control vs. T-ALL) of 5.6171, 4.7539, 3.5434, 3.5379, 3.2699, 3.0153, 2.7212, −1.8781, −2.4439, −2.9769, −3.1133, −3.2393, and −3.6502, respectively (p-value >0.0001). All quantitative data are the mean ± standard deviation (SD), ****p-value <0.00001 and Student's t-test (paired).
Differential expression of T-ALL genes by reverse transcription polymerase chain reaction.
SD: standard deviation.
 and western blotting (qualitative analysis). (A-D) Quantitative estimation (ELISA) of proteins that were found to be significantly high in T-ALL samples, such as eleven-nineteen lysine-rich leukemia protein (ELL), S100A8, tumor necrosis factor receptor superfamily member 10D, and Copine 4, with fold changes of 1.8248, 1.7931, 1.7932, and 1.7847 (p-value >0.0001), respectively.")
The expressions of genes were further validated using enzyme-linked immunosorbent assay (ELISA - quantitative estimation) and western blotting (qualitative analysis). (A-D) Quantitative estimation (ELISA) of proteins that were found to be significantly high in T-ALL samples, such as eleven-nineteen lysine-rich leukemia protein (ELL), S100A8, tumor necrosis factor receptor superfamily member 10D, and Copine 4, with fold changes of 1.8248, 1.7931, 1.7932, and 1.7847 (p-value >0.0001), respectively.
Differential expression of serum proteins by enzyme-linked immunosorbent assay (Quantitative analysis).
SD: Standard deviation.
The LC-MS/MS data were analyzed using STRING tools with humans as the background library, followed by gene ontology (GO) annotations to identify significantly differentially expressed proteins. The analysis revealed notable changes in T-ALL patients, including positive regulation of nuclear factor-kappa B (NF-kB) transcription factor activity, response to stimulus, signal transduction, metabolic process, molecular function, cellular metabolic process, intracellular signal transduction, cellular process, macromolecule metabolic process, nucleic acid-templated transcription, nitrogen compound metabolic process, cell death, neutrophil extravasation, mapk cascade and gene expression. Moreover, reactome pathway analysis showed significant changes in the immune system, innate immune system, cell surface interactions at the vascular wall, cytokine signaling in the immune system, signaling by NOTCH and the NOD1/2 signaling pathway. In contrast, tissue enrichment analysis revealed changes in chronic lymphocytic leukemia cells, lymphoid tissue, the hematopoietic system and leukocytes. GO analysis confirmed significant differences in protein function, particularly those associated with cell proliferation, differentiation and metastasis, in T-ALL patients. Detailed GO results are shown in Supplementary Table S4 (a-n).
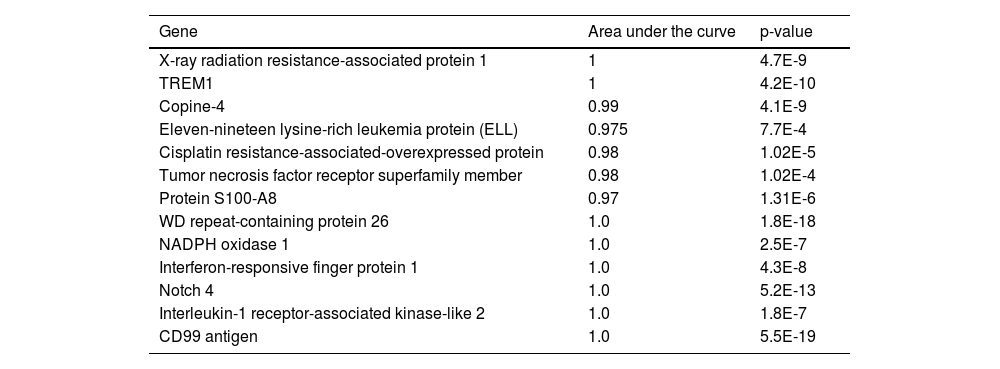
Receiver operating characteristic analysis of the mRNA expression of shortlisted significant genes in T-ALL patients depicting the diagnostic potential of the genesSelected genes that showed high expression levels in T-ALL patients were studied to determine their potential diagnostic value. Nonparametric receiver operating characteristic (ROC) curve analysis for 13 significant genes using relative expression (RQ) of T-ALL cases to plot the curve showed that all genes significantly differed from the diagonal line, differentiating healthy controls from T-ALL patients. The RQ value cutoff for the significant genes where the ROC curve was closest to 0.1, corresponding to 100 % sensitivity and specificity, was analyzed to identify potential diagnostic markers that correctly identify healthy individuals and T-ALL patients. Susceptible genes while not compromising specificity at the optimal cutoff were selected. This analysis identified eleven-nineteen lysine-rich leukemia protein (cutoff = 0.977; sensitivity = 0.8; specificity = 1), triggering receptor expressed on myeloid cells 1 (cutoff = 0.98; sensitivity = 1; specificity = 1), cisplatin resistance-associated-overexpressed protein (cutoff = 1.09; sensitivity = 1; specificity = 0.9), XRRA1 (cutoff = 0.635; sensitivity = 1; specificity = 1), tumor necrosis factor receptor superfamily member 10D (cutoff = 1.08; sensitivity = 1; specificity = 0.9), protein S100-A8 (cutoff = 1.09; sensitivity = 1; specificity = 0.8), copine-4 (cutoff = 12.2; sensitivity = 1; specificity = 1) and other significant genes. The findings suggest that these genes hold potential as diagnostic markers for T-ALL, as shown in Figure 6 (A-M) and Table 4.
Area under the receiver operating characteristic (AUROC) analysis.
Vital blood proteins that differed in expression between T-ALL patients and healthy control subjects were identified using label-free LC-MS/MS quantification. Statistical analysis found 44 significant blood proteins in T-ALL with a > 2-fold change compared to normal healthy control subjects. These protein profiles are all listed in Tables 2 and S1-S3. Some of the identified proteins have previously been reported in blood, tissue, and human T-ALL cell lines, indicating their association with T-ALL. The present study focused on unreported proteins with levels that change in T-ALL and their biological significance. WDR26 (G-beta-like protein) regulates the signaling pathways that lead to cancer pathogenesis,14–19 while it negatively regulates the MAPK pathways14 and helps in folding the protein scaffolds by promoting G beta-gamma-mediated PLCB2 in the plasma membrane and consequently activating leukocytes.16,17 However, the CTLH (E3 ubiquitin-protein ligase) complex helps trigger ubiquitination. It ultimately leads to proteasomal degradation of the HMG-box transcription factor (HBP1), which generally shows tumor-suppressive behavior in various cancers and leads to apoptosis by downregulating the Wnt pathway.20 It negatively regulates the Wnt pathway by inhibiting the ubiquitination of β-catenin CTNNB120 and it also helps in cell proliferation and differentiation by activating the PI3K/AKT pathway.19 This protects cells from oxidative stress and hypoxia induces death.15,21 Interleukin-1 family member 10 triggers the production of different kinds of cytokines; basically, it enhances the production of interleukin-8 (IL-8) by downregulating the expression of IL36G.22 The CD99 antigen regulates rosette formation with erythrocytes and is involved in the T-cell adhesion mechanism, which consequently helps in leukocyte leakage with the help of PECAM1.23 Caspase recruitment domain-containing protein 9 (CARD9) helps to trigger the innate immune system against different kinds of fungal infection by downregulating C-type lectin receptors24–27 and activating interleukin 17-producing T helper (Th17) cells.26,28 Zinc finger protein Aiolos (IKZF3) is a DNA-binding transcription factor that regulates the differentiation, proliferation and maturation of B-cells and T-cells and controls apoptosis in T-cells.29 Interleukin-18 (IL-18) receptor protein induces the activation of different pathways, such as NF-kB and JNK.30 Interleukin-1 receptor-associated kinase-like 2 (IRAK2) binds to its receptors and upregulates transcription by stabilizing mRNA, but in most cancers, its function is altered.31 Notch 4 generally regulates cell fate, but it was found to be a tumor suppressor in various cancers and follows the same tangent in T-ALL cells. In contrast, another Notch promotes tumor differentiation.32 NADPH oxidase 1 (NOX1) triggers the hydrogen ion current in latent tissues by maintaining cellular pH, and any dysregulation leads to cancer progression.33 RING-type E3 ubiquitin-protein ligase mediates the proteasomal degradation of proteins by polyubiquitination mediated by "Lys-48″.34 It is a well-known chaperone that helps properly fold different proteins. Downregulation of this protein affects the normal cellular machinery.35,36 Interferon induces an antiviral tripartite motif-containing protein 6/22/34/E3 ubiquitin-protein ligase (TRIM22), which regulates innate immunity. In contrast, the molecular mechanism of this protein is to ubiquitinate the viral capsid and lead to the degradation of different kinds of viruses, such as HIV1, encephalomyocarditis virus and hepatitis B virus (it suppresses the promoter part).37 IFI16 is a DNA-binding protein that suppresses the transcription of downstream genes and activates hematopoiesis by targeting unknown genes.38 CLOCK is a transcriptional activator of all circadian genes. It is involved in the 24-hour regulation of normal biological, molecular, cellular, and physiological processes. Aberrant expression of these genes leads to different diseases, such as metabolic syndrome, cardiac diseases, and cancers.39 Disintegrin and metalloproteinase domain-containing protein 8 (ADAM8) is involved in leukocyte extravasation.40 Integrin (ITGAL/ITGB2) is one of the major receptors for the ICAM family, ubiquitin-like protein ISG15, and iC3b fragments, which are part of fibrinogen. All these factors are involved in cell cytotoxicity at any aberration.41,42 These factors are involved in apoptotic neutrophil phagocytosis mediated by macrophages associated with ICAM3.43–46 Interaction of the alpha subunit with ITGAM/CD11b activates TNF neutrophils mediated by CD177-PRTN3.47 All these proteins are negative regulators in the pathogenesis of cancers. In contrast, in T-ALL, the differential expression of these proteins (LC-MS/MS) is downregulated and helps in the pathogenesis of T-ALL. Other results were validated by RT-PCR at the gene level and found to be in line with proteomic data. Next, this study found that some proteins that are highly specific to T-ALL were upregulated during the progression of T-ALL and had the potential to act as molecular biomarkers in T-ALL. Elongation factor (ELL) enhances the catalytic activity of RNA polymerase II and III transcription factors and regulates small nuclear RNA, which stimulates transcription in cancer conditions.48,49 Triggering receptor expressed on myeloid cells 1 (TREM 1) increases the level of neutrophils and monocytes, consequentially leading to an inflammatory response that helps in the surface expression of activational markers. It also helps in bacterial and fungal invasion during sepsis.50 The S100A8 protein regulates the inflammatory response and immune response during the pathogenesis of cancer and simultaneously induces chemotaxis and cellular adhesion. It is mainly found as calprotectin (S100A8/A9), which has intra- and extra-cellular functions. The intracellular function of this protein is to facilitate leukocyte arachidonic acid trafficking and metabolism, modulation of the tubulin-dependent cytoskeleton during the migration of phagocytes, and activation of neutrophilic NADPH oxidase. In contrast, its extracellular function involves inflammation, which promotes cytokine production and chemokines, and regulates leukocyte adhesion and migration. On the one hand, it helps in oxidant scavenging, thereby helping protect cellular integrity in cancer cells. It also acts as an alarmin or a danger-associated molecular pattern (DAMP) molecule that triggers the innate immune response by binding to pattern recognition receptors such as Toll-like receptor 4 (TLR4) and receptor for advanced glycation end products (AGER). The interaction of TLR4 and AGER activates the MAPK and NF-kB signaling pathways, consequently leading to a rejuvenation cascade. It also helps in the survival of cancer cells by altering the molecular mechanism of antiapoptotic genes through ITGAM/ITGB and TLR4 and a signaling mechanism involving MEK-ERK. It is a potent inducer of cancer in aberrant cells.51 XRRA1 is involved in the response of cells to X-ray radiation. TNF receptor superfamily member 10D T (TNFRSF10D) acts as a receptor for the cytotoxic ligand TRAIL and is generally found to be activated, which ultimately protects against TRAIL-mediated apoptosis. Some literature shows that it induces the NF-kB pathway in cancer cells.52–57 Copine-4 (CPNE4) is a calcium-dependent phospholipid-binding protein generally involved in metastasis.58
RT-PCR and ELISA further validated the above results, following the same trend as LC-MS/MS outcomes. Blood proteins can indicate the presence of T-ALL cells during screening, which could assist with direct examination and pathology testing for final diagnosis. For over 20 years, an important goal has been developing a noninvasive T-ALL risk test. Our current study presents potential protein biomarkers related to T-ALL that can be used for early diagnosis and monitoring of cancer progression in blood. These novel protein markers in blood require further evaluation in T-ALL tissues and an independent group of T-ALL blood samples to test their specificity and sensitivity so that they can be used for early diagnosis. This could lead to potential applications in cancer surveillance and prevention. Figures 5, and 7.
 were analyzed based on molecular function, cellular function, and tissue specification. Significantly differentially expressed proteins from the liquid chromatography-tandem mass spectrometry were analyzed by STRING tools with humans as the background library, followed by gene ontology annotations, including biological process (BP), reactome pathway, and tissue enrichment. (A, B) shows the PPI in all the proteins that were included in this study and their ontology; their functions are shown in supplementary Table S4 a-n. (C) Significant changes in T-ALL patients, including the immune system, innate immune system, cell surface interactions at the vascular wall, cytokine signaling in the immune system, signaling by NOTCH, and NOD1/2 signaling pathway. (D) In the tissue enrichment analysis, changes in chronic lymphocytic leukemia cells, lymphoid tissue, the hematopoietic system, and leukocytes were observed. (E) shows that these factors are associated with biological processes involved in apoptosis and the Nuclear factor kappa-B signaling pathway.")
 were analyzed based on molecular function, cellular function, and tissue specification. Significantly differentially expressed proteins from the liquid chromatography-tandem mass spectrometry were analyzed by STRING tools with humans as the background library, followed by gene ontology annotations, including biological process (BP), reactome pathway, and tissue enrichment. (A, B) shows the PPI in all the proteins that were included in this study and their ontology; their functions are shown in supplementary Table S4 a-n. (C) Significant changes in T-ALL patients, including the immune system, innate immune system, cell surface interactions at the vascular wall, cytokine signaling in the immune system, signaling by NOTCH, and NOD1/2 signaling pathway. (D) In the tissue enrichment analysis, changes in chronic lymphocytic leukemia cells, lymphoid tissue, the hematopoietic system, and leukocytes were observed. (E) shows that these factors are associated with biological processes involved in apoptosis and the Nuclear factor kappa-B signaling pathway.")
 were analyzed based on molecular function, cellular function, and tissue specification. Significantly differentially expressed proteins from the liquid chromatography-tandem mass spectrometry were analyzed by STRING tools with humans as the background library, followed by gene ontology annotations, including biological process (BP), reactome pathway, and tissue enrichment. (A, B) shows the PPI in all the proteins that were included in this study and their ontology; their functions are shown in supplementary Table S4 a-n. (C) Significant changes in T-ALL patients, including the immune system, innate immune system, cell surface interactions at the vascular wall, cytokine signaling in the immune system, signaling by NOTCH, and NOD1/2 signaling pathway. (D) In the tissue enrichment analysis, changes in chronic lymphocytic leukemia cells, lymphoid tissue, the hematopoietic system, and leukocytes were observed. (E) shows that these factors are associated with biological processes involved in apoptosis and the Nuclear factor kappa-B signaling pathway.")
Protein-protein interactions (PPIs) were analyzed based on molecular function, cellular function, and tissue specification. Significantly differentially expressed proteins from the liquid chromatography-tandem mass spectrometry were analyzed by STRING tools with humans as the background library, followed by gene ontology annotations, including biological process (BP), reactome pathway, and tissue enrichment. (A, B) shows the PPI in all the proteins that were included in this study and their ontology; their functions are shown in supplementary Table S4 a-n. (C) Significant changes in T-ALL patients, including the immune system, innate immune system, cell surface interactions at the vascular wall, cytokine signaling in the immune system, signaling by NOTCH, and NOD1/2 signaling pathway. (D) In the tissue enrichment analysis, changes in chronic lymphocytic leukemia cells, lymphoid tissue, the hematopoietic system, and leukocytes were observed. (E) shows that these factors are associated with biological processes involved in apoptosis and the Nuclear factor kappa-B signaling pathway.

.")
Vivek Singh & Ranjana Singh are part of Conceptualization, Data curation, Formal analysis, Funding acquisition, Investigation, Methodology, Project administration, Resources, Software, Supervision, Vivek Singh, Ranjana Singh & Rashmi Kushwaha are part of Validation, Visualization, Writing - original draft, Writing - review & editing.
Ethics approvalThis study was approved by the ethics committee of King George's Medical University, Lucknow, with reference code 96th ECM II A/P22. The Department of Pathology, King George's Medical University, Lucknow, collected written informed consent and diagnosis forms.
The work was supported by the Department of Biotechnology (BT/IN/Indo-US/Foldscope/39/2015) and ICMR (45/3/2019-Hae/BMS), and ICMR (56/6/2019-HAE/BMS) India.


