


By applying receiver operating characteristic curve analysis, the objective of this study was to see whether hemoglobin levels reflect body iron stores in a group of pregnant women at term who, by using serum ferritin as the reference test, had a high pre-test probability of having iron deficiency anemia. Likewise, we evaluated the ability of hemoglobin and maternal serum ferritin levels to predict iron deficiency anemia in newborns.
MethodsHemoglobin and serum ferritin were measured in 187 pregnant women at term belonging to a group with a high pre-test probability of iron deficiency anemia and their newborns. Women with Hb <11.0g/dL and newborns with cord Hb <13.0g/dL were classified as anemic. A serum ferritin <12.0μg/L in women and a cord blood serum ferritin <35.0μg/L were considered to reflect empty iron stores. Receiver operating characteristic curve analysis was applied to select the cut-off points that better reflected iron stores.
ResultsThe Hb cut-off point selected by receiver operating characteristic curve analysis in women was <11.5g/dL (sensitivity: 60.82, specificity: 53.33%, Youden Index: 0.450). Most of the newborns had normal Hb which precluded this analysis. Maternal Hb <11.0g/dL was the cut-off point that best reflected iron deficiency anemia in newborns (sensitivity: 55.88%, specificity: 57.24%, Youden Index: 0.217). The best cut-off point of maternal serum ferritin to reflect empty iron stores in newborns was <6.0μg/L (sensitivity: 76.47%, specificity: 31.58%, Youden Index: 0.200).
ConclusionHemoglobin concentration performed poorly to detect iron deficiency anemia in women at term with high risk for iron deficiency and their newborns.
Receiver operating characteristic (ROC) curve analysis is used to evaluate the diagnostic performance of a test.1 The ROC curve provides accurate information about the trade-off between the two most important aspects of diagnostic performance: sensitivity (the probability that a test result will be positive when the disease is present) and specificity (the probability that a test result will be negative when the disease is not present).1 In addition, the area under the ROC plot can be expressed as a quantitative index, A(z), that summarizes the diagnostic performance described by the entire ROC curve. The value of the A(z) index varies from 0.5 (no apparent accuracy, the ROC curve will coincide with the diagonal) to 1.0 (perfect accuracy).2
Iron-deficiency (ID) anemia is the most common nutritional disorder in the world. At least 2 billion people, that is, over 30% of the world's population are anemic, many due to ID.3 The prevalence of ID anemia is remarkably high in pregnant women, because of the increase of iron requirements during the second and third trimesters with the expansion of maternal blood volume and fetal red cell mass.4 This disease particularly affects pregnant women and infants in developing countries.5 Although there is strong evidence demonstrating that the acquisition of iron by the fetus is limited by the presence of ID in the mother,6 numerous studies have shown that the fetus can accumulate enough iron despite mild to moderate maternal ID.7
The most commonly used test to screen for ID is the hemoglobin (Hb) concentration, which reflects the amount of functional iron in the body. Although it is a late indicator of ID, the level of Hb is essential for the diagnosis of ID anemia.8 The Centers for Disease Control and Prevention (CDC) define gestational anemia during the third trimester of pregnancy as a Hb level <11.0g/dL at sea level9 and a level of serum ferritin (SF) <12.0mg/L is considered to be the gold standard for the diagnosis of ID in pregnant women.9
Iron is transferred to the fetus through the placenta against a concentration gradient, particularly during the later stages of pregnancy, with the amount of iron transported across the placenta increasing as pregnancy progresses.4 Several factors influence the concentration of Hb at birth, including gestational age, gender, state of maternal iron reserves, and other factors affecting the maternal-fetal iron exchange.
In term pregnancies, 70–80% of fetal iron is present in the red cells as Hb.4 Anemia in newborns is established with a cord blood Hb concentration <13.0g/dL.5 The cutoff cord blood serum ferritin (CSF) indicating iron deficiency in the newborn is set at <35.0mg/L at which point the iron available to meet normal brain requirements is restricted.4 SF is, in addition to the direct examination of stainable iron in bone-marrow smears, the most specific indicator of body iron reserves.10 By using SF as the reference test and applying ROC curve analysis, the objective of this study was to determine whether Hb levels reflect the body iron stores in a group of pregnant women at term with a high pre-test probability of having ID. Likewise, the usefulness of maternal Hb and SF levels to predict ID in newborns was evaluated.
MethodsOne hundred and eighty-seven pregnant women at term of normal pregnancies and their newborns attended at the Hospital Universitario Dr. José E. González of the Universidad Autónoma de Nuevo León, Monterrey, AC, Mexico, were enrolled in this study. Informed consent was obtained from all mothers and the principles of the Declaration of Helsinki were followed. All of the women had a single pregnancy, were uninsured and belonged to the low-income urban population of Monterrey, Mexico, (altitude: 524 meters above sea level). Women with comorbidities, including diabetes and infections, were excluded.
Samples of blood for Hb and SF measurement were obtained from the mother and the newborn's cord. The Hb concentration was determined in an automated blood cell counter. Women with a value lower than 11.0g/dL were classified as anemic.7 Newborns with cord Hb value <13.0g/dL were also classified as anemic.5 After being separated by centrifugation, serum was stored at −20°C and the SF concentration was measured in duplicate within two weeks of collection by an enzyme-linked immunosorbent assay (Ferrizyme, Abbott Laboratories, North Chicago, IL) based on a previously described modification of a method.11 A value lower than 12.0mg/L of SF is considered to reflect empty iron stores in pregnant women at term;12 in newborns the cutoff for CSF of severe ID is <35.0mg/L.4 No other red blood cell index or iron saturation data are included in this report.
The statistical evaluation was performed using ROC curve analysis1,2 employing MedCalc Statistical Software (version 14.8.1). The diagnostic properties of the tests were calculated based on the predictive value model.13,14
ResultsA total of 77 (41.4%) pregnant women were anemic at term (Hb <11.0g/dL) and 171 (91.9%) were ID (SF <12.0mg/L). The mean Hb concentration in the study group was 11.11±1.57g/dL (range: 6.50–14.90g/dL), whereas the mean SF value was 5.78±7.20mg/L (range: 0.0–50.0mg/L).
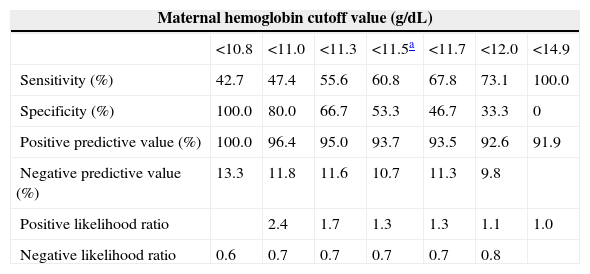
Figure 1 shows the graph generated by ROC analysis. An Hb concentration <11.5g/dL was found to be the best cutoff point to reflect empty iron stores based on a ferritin value <12.0mg/L. The sensitivity of the Hb level at this value was 60.82% with a specificity of 53.33%. The diagnostic power of Hb, expressed as the area under the ROC curve (AUC), was 0.656, with a 95% confidence interval of 0.583–0.7244. The Youden index of Hb concentration to reflect corporal iron stores in the study group, as evaluated by SF, was 0.450. The corresponding values for different ROC-derived Hb cutoff values are shown in Table 1.
![Receiver operating characteristic (ROC) curve analysis of hemoglobin (Hb) to assess iron stores in pregnant women at term (area under the ROC curve [AUC])=0.656.](https://static.elsevier.es/multimedia/15168484/0000003700000003/v1_201506010548/S1516848415000262/v1_201506010548/en/main.assets/gr1.jpeg?xkr=ue/ImdikoIMrsJoerZ+w92xcqUtYYCc6yiYRjTD2AR1aFJOKb7qLd+WBf18Ptk/O8dVG5SMqADZji5skBxdmL9dIk4Flhlzc2+q6/GcVa9g9uM91rYtYm/ccG+uLar5PJo4AqGS8lp/br6yMkSbL7KjG7ZAd0EEPWgMUcjUptNyBCiTbok/OV4uis319od7/ZWaFXwnyEmMTZCduQCPuQTve4T7NaXLqMA8bzd3by5TsSI2iixzJPY42pt8sIkiT4ydTlnWvZ5x6tsbGhbny7OHXfoUmOvmtpnmRLP41tdbW6yedgxDCqAVgHPlJo7PL "Receiver operating characteristic (ROC) curve analysis of hemoglobin (Hb) to assess iron stores in pregnant women at term (area under the ROC curve [AUC])=0.656.")
Performance evaluation for different receiver operating characteristic curve-derived hemoglobin cutoff values in pregnant women at term.
| Maternal hemoglobin cutoff value (g/dL) | |||||||
|---|---|---|---|---|---|---|---|
| <10.8 | <11.0 | <11.3 | <11.5a | <11.7 | <12.0 | <14.9 | |
| Sensitivity (%) | 42.7 | 47.4 | 55.6 | 60.8 | 67.8 | 73.1 | 100.0 |
| Specificity (%) | 100.0 | 80.0 | 66.7 | 53.3 | 46.7 | 33.3 | 0 |
| Positive predictive value (%) | 100.0 | 96.4 | 95.0 | 93.7 | 93.5 | 92.6 | 91.9 |
| Negative predictive value (%) | 13.3 | 11.8 | 11.6 | 10.7 | 11.3 | 9.8 | |
| Positive likelihood ratio | 2.4 | 1.7 | 1.3 | 1.3 | 1.1 | 1.0 | |
| Negative likelihood ratio | 0.6 | 0.7 | 0.7 | 0.7 | 0.7 | 0.8 | |
In the group of newborns, six (3.2%)6 were anemic (Hb <13.0g/dL) and 34 (18.3%) were ID (CSF <35.0mg/L). The mean Hb concentration in the study group was 15.69±1.89g/dL (range: 11.0–22.0g/dL), whereas the mean CSF value was 79.30±55.14mg/L (range: 2.94–322.65mg/L). Almost 97% of newborns had normal Hb which precluded the application of ROC analysis to assess its efficiency in respect to neonate iron stores.
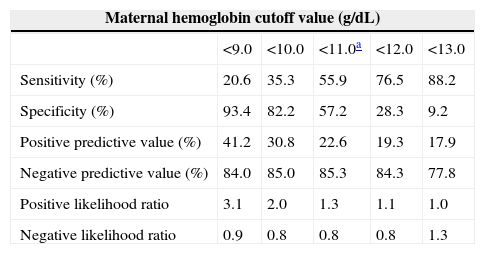
A ROC curve analysis was carried out to assess the performance of maternal Hb in the assessment of iron stores in newborns based on CSF (<35.0mg/L). The resulting graph shows an AUC of 0.591 with a 95% confidence interval of 0.517–0.662 (Figure 2). The optimal cutoff point of maternal Hb that best reflected ID in newborns was <11.0g/dL, at this point the sensitivity was 55.88% with a specificity of 57.24%. The Youden index for this test was 0.200. Again, it is important to consider that only 3.2% of neonates were anemic. The corresponding values obtained by ROC analysis for different cutoff points of maternal Hb are shown in Table 2.
![Receiver operating characteristic (ROC) curve analysis of maternal hemoglobin (Hb) to assess iron stores in newborns (area under the ROC curve [AUC])=0.591.](https://static.elsevier.es/multimedia/15168484/0000003700000003/v1_201506010548/S1516848415000262/v1_201506010548/en/main.assets/gr2.jpeg?xkr=ue/ImdikoIMrsJoerZ+w92xcqUtYYCc6yiYRjTD2AR1aFJOKb7qLd+WBf18Ptk/O8dVG5SMqADZji5skBxdmL9dIk4Flhlzc2+q6/GcVa9g9uM91rYtYm/ccG+uLar5PJo4AqGS8lp/br6yMkSbL7KjG7ZAd0EEPWgMUcjUptNyBCiTbok/OV4uis319od7/ZWaFXwnyEmMTZCduQCPuQTve4T7NaXLqMA8bzd3by5TsSI2iixzJPY42pt8sIkiT4ydTlnWvZ5x6tsbGhbny7OHXfoUmOvmtpnmRLP41tdbW6yedgxDCqAVgHPlJo7PL "Receiver operating characteristic (ROC) curve analysis of maternal hemoglobin (Hb) to assess iron stores in newborns (area under the ROC curve [AUC])=0.591.")
Performance evaluation for different receiver operating characteristic curve-derived maternal hemoglobin cutoff values for iron deficiency in newborns.
| Maternal hemoglobin cutoff value (g/dL) | |||||
|---|---|---|---|---|---|
| <9.0 | <10.0 | <11.0a | <12.0 | <13.0 | |
| Sensitivity (%) | 20.6 | 35.3 | 55.9 | 76.5 | 88.2 |
| Specificity (%) | 93.4 | 82.2 | 57.2 | 28.3 | 9.2 |
| Positive predictive value (%) | 41.2 | 30.8 | 22.6 | 19.3 | 17.9 |
| Negative predictive value (%) | 84.0 | 85.0 | 85.3 | 84.3 | 77.8 |
| Positive likelihood ratio | 3.1 | 2.0 | 1.3 | 1.1 | 1.0 |
| Negative likelihood ratio | 0.9 | 0.8 | 0.8 | 0.8 | 1.3 |
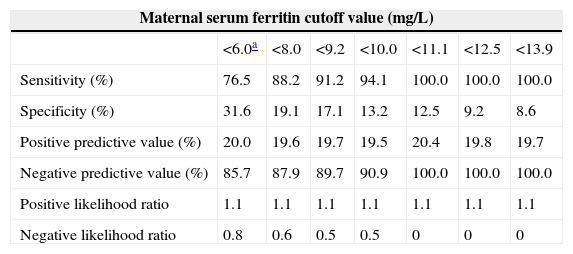
ROC curve analysis was applied to assess the performance of maternal SF in reflecting iron stores in newborns based on a value of CSF <35.0mg/L; a graph with an AUC of 0.600 and a 95% confidence interval of 0.525–0.671 was obtained (Figure 3). The best cutoff point of maternal SF chosen to reflect empty iron stores in the newborn was <6.0mg/L, with a sensitivity of 76.47% and a specificity of 31.58%. The lack of efficiency was confirmed by a Youden Index of 0.217. Different cutoff points were used and the corresponding analysis is shown in Table 3.
![Receiver operating characteristic (ROC) curve analysis of maternal serum ferritin (SF) to assess iron stores in newborns (area under the ROC curve [AUC])=0.600.](https://static.elsevier.es/multimedia/15168484/0000003700000003/v1_201506010548/S1516848415000262/v1_201506010548/en/main.assets/gr3.jpeg?xkr=ue/ImdikoIMrsJoerZ+w92xcqUtYYCc6yiYRjTD2AR1aFJOKb7qLd+WBf18Ptk/O8dVG5SMqADZji5skBxdmL9dIk4Flhlzc2+q6/GcVa9g9uM91rYtYm/ccG+uLar5PJo4AqGS8lp/br6yMkSbL7KjG7ZAd0EEPWgMUcjUptNyBCiTbok/OV4uis319od7/ZWaFXwnyEmMTZCduQCPuQTve4T7NaXLqMA8bzd3by5TsSI2iixzJPY42pt8sIkiT4ydTlnWvZ5x6tsbGhbny7OHXfoUmOvmtpnmRLP41tdbW6yedgxDCqAVgHPlJo7PL "Receiver operating characteristic (ROC) curve analysis of maternal serum ferritin (SF) to assess iron stores in newborns (area under the ROC curve [AUC])=0.600.")
Performance evaluation for different receiver operating characteristic curve-derived maternal serum ferritin cutoff values for iron deficiency in newborns.
| Maternal serum ferritin cutoff value (mg/L) | |||||||
|---|---|---|---|---|---|---|---|
| <6.0a | <8.0 | <9.2 | <10.0 | <11.1 | <12.5 | <13.9 | |
| Sensitivity (%) | 76.5 | 88.2 | 91.2 | 94.1 | 100.0 | 100.0 | 100.0 |
| Specificity (%) | 31.6 | 19.1 | 17.1 | 13.2 | 12.5 | 9.2 | 8.6 |
| Positive predictive value (%) | 20.0 | 19.6 | 19.7 | 19.5 | 20.4 | 19.8 | 19.7 |
| Negative predictive value (%) | 85.7 | 87.9 | 89.7 | 90.9 | 100.0 | 100.0 | 100.0 |
| Positive likelihood ratio | 1.1 | 1.1 | 1.1 | 1.1 | 1.1 | 1.1 | 1.1 |
| Negative likelihood ratio | 0.8 | 0.6 | 0.5 | 0.5 | 0 | 0 | 0 |
Although its diagnostic properties are not ideal, SF was selected as the reference test in this study to evaluate body iron stores in pregnant women at term and their newborns. This is the second most accurate assay after the examination of stainable iron in the bone marrow, and the only method that can provide a semi-quantitative indication of the levels of such stores; its diagnostic efficiency is 91% and specificity is 100% in iron-replete individuals.12
Even though measurements such as positive or negative predictive values are highly dependent on the prevalence of a disease in the studied population, the sensitivity and specificity of a test are independent of prevalence, thus allowing the drawing of valid conclusions of test performance when using ROC curve analysis, such as in the present study.
Hb levels were studied in a group of women at term with a high pre-test probability of having empty iron stores in order to describe the behavior of Hb levels under demanding conditions and to assess whether SF should be routinely evaluated to assess iron status in this disadvantaged group.
High prevalences of anemia and ID were found in this low-income, uninsured urban population of pregnant women in Mexico. The Hb level selected by ROC curve analysis (11.5g/dL) was higher than the 11.0g/dL recommended for women during the third trimester of pregnancy.9 At this level, the sensitivity of hemoglobin to detect empty iron stores compared to SF was low (60.82%), but remarkably similar to the sensitivity of 61% of ferritin itself (<12.0mg/L) when compared to stainable iron in bone marrow smears from women of reproductive age. At this value however, SF specificity reached 100% for the correct diagnosis of ID in women of reproductive age.10 Maternal Hb specificity to detect empty iron stores in pregnant women in the present study was 53.33%, leading to a poor overall efficiency in diagnosing ID as expressed by the Youden index of 0.450.
In spite of the high prevalence of ID and anemia in the pregnant women studied, only 45% (77/171) of ID women were anemic (Hb <11.0g/dL). Therefore, it is important to consider the subclinical ID without anemia (SF <12.0mg/L and Hb >11.0g/dL) that was presented by 55% of these women. This shows the lack of efficiency of Hb to detect ID in pregnant women belonging to populations with a high pre-test probability of ID. This is reflected by the low AUC of 0.656 and the corresponding low Youden index. Our results are similar to those obtained in a study in India,15 in which no correlation between Hb and SF, as well as a high percentage of subclinical ID, was found in pregnant women. In developing countries such as Mexico and India there is a high prevalence of ID in pregnant women, but due to the high cost and logistic complexity of SF assays it is difficult to extrapolate the recommendations derived from studies conducted in developed countries to guide iron supplementation based on SF values.15 These findings highlight the need to study the efficiency of other less expensive markers which could be used as a basis to guide prophylaxis using iron with a higher level of efficiency, such as additional red blood cell indexes,16 which were not included in the current study. It is important to emphasize that the results of similar studies in other populations vary widely. A correlation between Hb and SF was found in a study in African-American patients17 and a similar study carried out in Malaysia.18 These studies concluded that the use of Hb as a predictor of ID is an efficient and low cost alternative for countries with high prevalence of the disease and with limited resources and thus cannot afford to measure SF. The study conducted in African-Americans included only women with anemia, whereas in the Malaysian report, the measurement of SF and Hb was conducted during early pregnancy, when the incidence of gestational anemia is lowest, representing both ends of the gestational ID spectrum. The current study consisted of uninsured women at term belonging to a low income population and at high risk of being iron-depleted attended in a public hospital. This could help to explain the significant contrast between previous studies and the current findings regarding the usefulness of Hb to assess iron stores.
In the newborn group, the comparison of Hb and CSF using ROC curve analysis to assess ID was precluded because almost 97% of newborns had normal Hb. In the analysis conducted to determine the usefulness of maternal Hb to assess iron stores in newborns, the cutoff point recommended for women in the third trimester of pregnancy (11.0g/dL),7 lacked sensitivity and specificity (55.88% and 57.24% respectively). The AUC (0.591) demonstrated low diagnostic efficacy of Hb as an indicator of stored iron in neonates of women with a high prevalence of ID.
Despite the high prevalence of maternal anemia and ID without anemia, only 3.2% of neonates were anemic, whereas 18.3% had ID (CSF <35.0mg/L). Although it has been shown that maternal iron stores strongly influence (although not exclusively) iron stores in newborns,6 from our results and those of others5,19 it can be concluded that the fetus uses available iron in a preferential way to support erythropoiesis, despite an inadequate maternal iron supply and empty iron stores. This is consistent with data obtained from a study carried out in China5 in which, as in the current population, anemia and ID were common in pregnant women at term while the percentages of newborns with both were very low.
When analyzing the efficiency of maternal SF to assess iron stores in newborns, the results did not show that the test performed well because the optimal cut-off point of maternal SF identified using ROC analysis (6.0mg/L) is under the gold standard for the diagnosis of iron deficiency in pregnant women (SF <12.0mg/L). These results are not consistent with other studies, which conclude that iron stores in neonates are associated with maternal ones only if maternal iron status is at risk.5 Our results may support the theory of Kilbride et al.19 who suggested that the hematologic effects of empty maternal iron stores are more evident later in childhood than during the newborn period. The analysis carried out in our population found no correlation between Hb and maternal SF with iron stores in newborns. Other markers of ID in infants have been studied, such as reticulocyte hemoglobin content (CHr), which is considered an early marker of ID due to the short lifespan of reticulocytes (about 24h), and unlike other markers of ID, including SF, it has the advantage of not being influenced by chronic inflammation processes and acute infection. This test has been shown to be a sensitive effective marker to evaluate iron stores in newborns at term,20 as well in preterm newborns.21
It is important to notice however, that in contrast to the simplicity and low day-to-day variation of Hb concentration measurement, the SF assay has a relatively higher inherent methodological variability, with a 5% general coefficient of variation, which can increase to 15% for the same individual over a period of weeks.22 In comparison, serum iron determination of the same subject has a day-to-day overall coefficient of variation of 30%, as a consequence of its high physiological variability.22
In summary, the low performance indices for Hb in this study, particularly a lack of sensitivity and low diagnostic efficiency, confirmed its poor value in reflecting body iron stores when the probability of iron depletion is high.23 The present report also illustrates the usefulness of ROC curve analysis applied to a common clinical laboratory test and how it can help in defining an appropriate range of values and a specific cut-off point for a particular population.
ConclusionsThere was a poor correlation between maternal Hb and SF with iron stores in neonates, despite the high prevalence of ID and anemia in women at term. Due to financial and logistic restrictions in developing countries, it is important to validate inexpensive, sensitive markers to guide iron prophylaxis or therapy during pregnancy.
Conflicts of interestThe authors declare no conflicts of interest.
The authors gratefully acknowledge Dr. Neri Álvarez Villalobos for his statistical analysis.

