
To evaluate the nutritional status and caloric and protein intake during the hospitalization of patients undergoing hematopoietic stem cell transplantation.
MethodsA retrospective study was performed based on clinical and nutritional data of patients undergoing autologous and allogeneic hematopoietic stem cell transplantation from March 2015 to March 2017. The mean caloric and protein intake were evaluated in three different intervals (P1: from admission to the day before transplantation, P2: from the transplantation day to the day before engraftment, P3: from the engraftment day to the day of hospital discharge). Body mass index, weight loss, gastrointestinal symptoms and use of nutritional therapy were also evaluated.
ResultsThirty-five patients were included in this study (25 autologous and ten allogeneic). The majority (62.6%) were overweight at admission. The median and percentage weight loss were 3.2kg and 4.6%, respectively. A nutritional supplement was provided to 33 patients for a median of nine days. The most prevalent gastrointestinal symptoms were nausea (91.4%), vomiting (88.6%) and diarrhea (80%). The mean caloric and protein intake and adequacy of patients were 1569.0±443.3Kcal (73.6±22.1%) and 66±22.8g (61.9±20%), respectively. The allogeneic group presented lower intake and caloric and protein adequacy throughout hospitalization, in particular in P2, compared to the autologous patients.
ConclusionThe patients presented deterioration of nutritional status during hospitalization with the reduction in food intake being greater in patients submitted to allogeneic transplantation.
Hematopoietic stem cell transplantation (HSCT) is a complex procedure used in the treatment of several hematologic, oncologic and autoimmune diseases. The maintenance of a good nutritional state is crucial during HSCT.1 Malnutrition, which may occur rapidly during treatment if there is no adequate nutritional follow-up, is regarded as a risk factor for complications, such as infection, graft versus host disease (GVHD), morbidity and mortality, and longer hospitalization stays. It is associated with delays in achieving engraftment and worse prognosis.2–7 Obesity has also been correlated with higher infection rates and thus longer hospitalization.8
HSCT patients are at increased nutritional risk due to the underlying disease, high metabolic demand and complications related to the conditioning regimen, which mostly affect the gastrointestinal tract, and are thus able to cause symptoms, such as nausea, vomiting, mucositis, odynophagia, diarrhea, abdominal pain and constipation, that make the ingestion of food and absorption of nutrients worse.1,9,10
During hospitalization, acceptance of the diet is influenced by factors related to the treatment, such as chemotherapy and other medications, changes in eating habits and emotions. The monitoring of food intake is of utmost importance to identify which patients are at nutritional risk and to start nutritional therapy as soon as possible in order to address the patients’ nutritional needs and to avoid complications.1,3,11
Thus, this study aimed at assessing the nutritional state and the caloric and protein intake during hospitalization of patients submitted to HSCT.
MethodsThis retrospective study collected clinical and nutritional data from 35 patients submitted to HSCT between March 2015 and March 2017 in a university hospital in the city of Juiz de Fora.
The initial study sample comprised 41 patients, six of whom were excluded. The patients included were subjects who were hospitalized to perform autologous and related allogeneic HSCT who had complete patient records from the day of admission to hospital discharge. The exclusion criteria were incomplete records and death during hospitalization. As only one patient in the sample received enteral tube feeding, this subject was excluded in order to avoid bias.
The graft source was peripheral blood for patients submitted to autologous transplantation and bone marrow for allogeneic transplantation. The following conditioning regimens were used: Cytarabine/Etoposide/Lomustine/Melphalan; Melphalan; Cytarabine/Etoposide; Cytarabine/Etoposide/Melphalan; Lomustine/Etoposide/Cytarabine; Cyclophosphamide; Melphalan/Fludarabine; Busulfan/Fludarabine; Cyclophosphamide; Busulfan/Fludarabine/Methotrexate. None of the patients received total body irradiation during the conditioning.
Data were collected from records routinely utilized by the Nutrition Service of the hospital. The variables studied were gender, age, underlying disease, type of transplant, time from transplantation to engraftment, gastrointestinal symptoms, length of hospitalization, height, weight, weight loss, percentage of weight loss, usage or not of nutritional therapy (enteral diet, parenteral diet and oral enteral supplementation), and average and adequacy of protein/calorie intake considering total food intake. Three time intervals were considered during hospitalization: (P1: from admission to the day before transplantation; P2: from transplantation to the day before engraftment; P3: from engraftment to hospital discharge). The body mass index (BMI) was calculated and its classification was made in accordance to specific recommendations for each age group. The 1998 World Health Organization (WHO) proposal12 was adopted for adults, the cutoff point suggested by the American Academy of Family Physicians13 was used for the elderly (aged≥60), while the curves proposed by the WHO in 200714 were used for teenagers (aged≤18). After this classification, the patients were split into three groups: underweight, eutrophic and excessive weight (overweight+obesity). The proposals of Blackburn et al. were used to classify weight loss over time.15
Patients hospitalized in the Transplant Unit receive daily nutritional supervision from the day of admission until hospital discharge. A 24-hour record system was used by the nutritionist in which the protein and calorie intake was calculated based on the accounts of patients and their companions. The calculation of the total protein and calories ingested by the patient each day was made employing nutritional composition tables of items of food [Brazilian Table of Food Composition (TACO)16 and the Table for the Assessment of Dietary Consumption in Home Measurements17], product labels and technical sheets for food preparation. If the patient received an oral nutritional supplement, the respective protein and calorie values were included in the calculation. The data were recorded in the Nutrition Service protocols both as numerical and percentage values. Nutritional adequacy was calculated by assessing the proportion between what the patient had ingested and the recommended calorie and protein intake. Calorie and protein necessity and adequacy were calculated based on the nutritional state and individual assessment of each patient, in accordance with the recommendations of the National Consensus on Oncologic Nutrition1 (recommended calorie intake: 30–35Kcal/kg of current body weight and recommended protein intake: 1.5g/kg of current body weight).
The records included the patient's weight, which was assessed every day by the nursing team using digital weighing scales; information about the use of nutritional therapy, occurrence of gastrointestinal symptoms and other data related to treatment.
The Statistical Package for the Social Sciences (SPSS) v. 23.0 was used for statistical analysis. At first, a descriptive analysis was made with a calculation of the frequencies and central tendency and dispersion measures for sample profiling. After analyzing data normality (Shapiro–Wilk Test), the comparison of continuous variables used parametric (Student's t test) or nonparametric (Mann–Whitney) tests in order to compare the groups of patients submitted to autologous and allogeneic HSCT. Categorical variables were compared using the Chi-Square test and Fischer's exact test. Spearman's correlation coefficients were utilized for the analysis of quantitative variables with asymmetric distribution. Statistical differences were considered significant in all the analyses when p-values were <0.05.
The research was submitted to the Ethics Committee of the Universidade Federal de Juiz de Fora (UFJF), and authorized under n° 1.942.853. Since retrospective data were evaluated, the signing of informed consent forms by the subjects was waived.
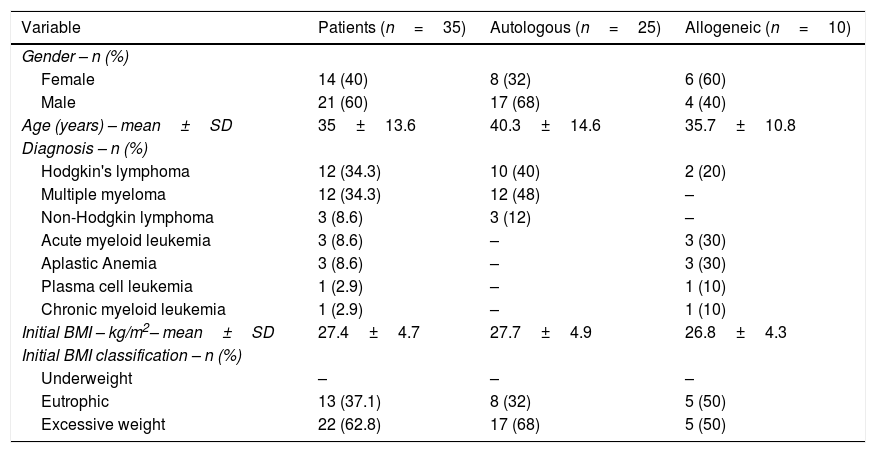
ResultsTable 1 shows the characteristics of the patients according to transplantation type. Twenty-five (71.4%) of the 35 patients performed autologous HSCT while ten (28.6%) underwent allogeneic transplantations. The average age was 35±13.6 years, 82.8% of the patients were adults, 14.2% elderly and 2.8% teenagers. Hodgkin's lymphoma and multiple myeloma were the most prevalent diagnoses. The mean BMI was 27.4±4.7kg/m2 and the majority of the subjects (62.6%) were overweight upon admission while none were undernourished. The number of patients with excess weight dropped to 48.6% by the time of hospital discharge and the average BMI at this stage was 26.0±4.7kg/m2.
Characteristics of patients submitted to autologous and allogeneic hematopoietic stem cell transplantation.
| Variable | Patients (n=35) | Autologous (n=25) | Allogeneic (n=10) |
|---|---|---|---|
| Gender – n (%) | |||
| Female | 14 (40) | 8 (32) | 6 (60) |
| Male | 21 (60) | 17 (68) | 4 (40) |
| Age (years) – mean±SD | 35±13.6 | 40.3±14.6 | 35.7±10.8 |
| Diagnosis – n (%) | |||
| Hodgkin's lymphoma | 12 (34.3) | 10 (40) | 2 (20) |
| Multiple myeloma | 12 (34.3) | 12 (48) | – |
| Non-Hodgkin lymphoma | 3 (8.6) | 3 (12) | – |
| Acute myeloid leukemia | 3 (8.6) | – | 3 (30) |
| Aplastic Anemia | 3 (8.6) | – | 3 (30) |
| Plasma cell leukemia | 1 (2.9) | – | 1 (10) |
| Chronic myeloid leukemia | 1 (2.9) | – | 1 (10) |
| Initial BMI – kg/m2– mean±SD | 27.4±4.7 | 27.7±4.9 | 26.8±4.3 |
| Initial BMI classification – n (%) | |||
| Underweight | – | – | – |
| Eutrophic | 13 (37.1) | 8 (32) | 5 (50) |
| Excessive weight | 22 (62.8) | 17 (68) | 5 (50) |
SD: standard deviation; BMI: body mass index.
All of the patients only received oral diet with or without nutritional supplementation; none of the subjects received tube feeding (enteral diet or parenteral diet). Thirty-three patients received nutritional supplementation for a median of nine days. During hospitalization, the median and percentage weight loss were 3.2kg and 4.6%, respectively with 15 patients (42.9%) having severe weight loss (17.1%: allogeneic and 25.7%: autologous). In addition, weight loss did not statistically differ between patients that presented or did not present infections in both the autologous HSCT (5.9±3.31% vs. 3.8±2.14; p-value=0.122) and allogeneic HSCT groups (6.7±2.54 vs. 5.9±3.75; p-value=0.806).
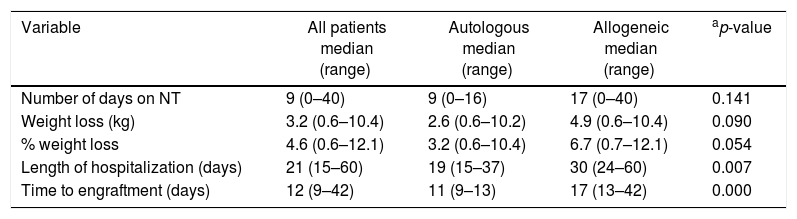
There was no statistically significant difference in the length of nutritional therapy and the weight loss in relation to the type of transplantation. Patients submitted to allogeneic HSCT were hospitalized for longer (30 days vs. 19 days; p-value<0.007) and took longer to achieve engraftment (17 days vs. 11 days; p-value<0.000) than those who performed autologous transplantations (Table 2).
Clinical characteristics, use of nutritional therapy and weight loss in patients submitted to autologous and allogeneic hematopoietic stem cell transplantation.
| Variable | All patients median (range) | Autologous median (range) | Allogeneic median (range) | ap-value |
|---|---|---|---|---|
| Number of days on NT | 9 (0–40) | 9 (0–16) | 17 (0–40) | 0.141 |
| Weight loss (kg) | 3.2 (0.6–10.4) | 2.6 (0.6–10.2) | 4.9 (0.6–10.4) | 0.090 |
| % weight loss | 4.6 (0.6–12.1) | 3.2 (0.6–10.4) | 6.7 (0.7–12.1) | 0.054 |
| Length of hospitalization (days) | 21 (15–60) | 19 (15–37) | 30 (24–60) | 0.007 |
| Time to engraftment (days) | 12 (9–42) | 11 (9–13) | 17 (13–42) | 0.000 |
NT: nutritional therapy.
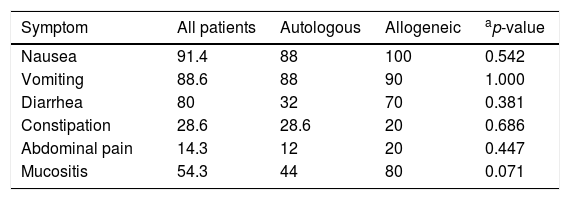
The most prevalent gastrointestinal symptoms were nausea (91.4%), vomiting (88.6%) and diarrhea (80.0%). There were no statistically significant differences in the occurrence of the symptoms between the two types of transplantation (Table 3).
Percentages of gastrointestinal symptoms in patients submitted to autologous and allogeneic hematopoietic stem cell transplantation.
| Symptom | All patients | Autologous | Allogeneic | ap-value |
|---|---|---|---|---|
| Nausea | 91.4 | 88 | 100 | 0.542 |
| Vomiting | 88.6 | 88 | 90 | 1.000 |
| Diarrhea | 80 | 32 | 70 | 0.381 |
| Constipation | 28.6 | 28.6 | 20 | 0.686 |
| Abdominal pain | 14.3 | 12 | 20 | 0.447 |
| Mucositis | 54.3 | 44 | 80 | 0.071 |
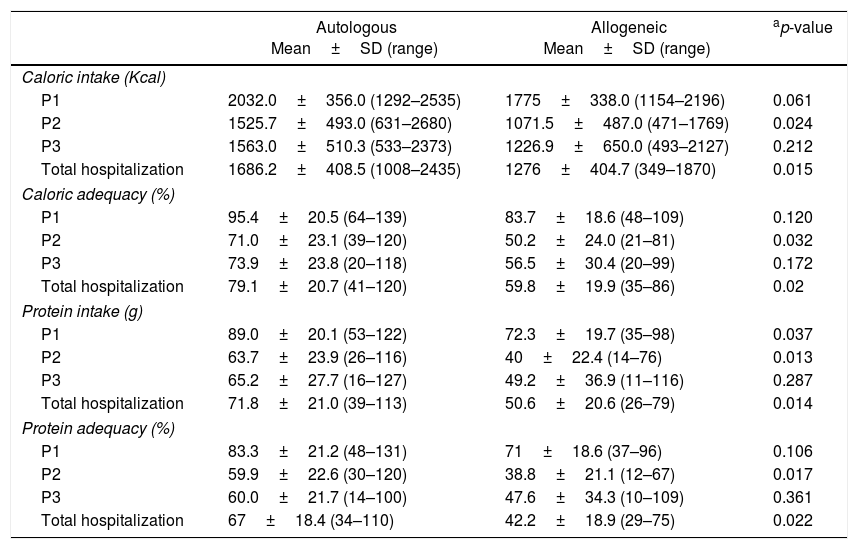
Table 4 shows the difference between caloric and protein intake and adequacy in the different stages of hospitalization of the patients who underwent autologous and allogeneic HSCT. Throughout hospitalization, the patients’ average caloric and protein ingestion and adequacy were 1569.0±443.3Kcal (73.6±22.1%) and 66±22.8g (61.9±20%), respectively. Patients submitted to autologous HSCT had an average calorie intake of 23.8±7.14Kcal/kg/day and protein intake of 1.0±0.31g/kg/day, whilst for those who underwent allogeneic transplants the averages were 18.9±6.6Kcal/kg/day and 0.75±0.34g/kg/day, respectively. When the whole hospitalization period is taken into account, patients submitted to allogeneic HSCT showed lower adequacy and lower mean calorie and protein intake compared to the group submitted to autologous HSCT (p-value<0.05).
Comparison of calorie and protein intake and adequacy in different hospitalization periods between patients submitted to autologous and allogeneic hematopoietic stem cell transplantation.
| Autologous Mean±SD (range) | Allogeneic Mean±SD (range) | ap-value | |
|---|---|---|---|
| Caloric intake (Kcal) | |||
| P1 | 2032.0±356.0 (1292–2535) | 1775±338.0 (1154–2196) | 0.061 |
| P2 | 1525.7±493.0 (631–2680) | 1071.5±487.0 (471–1769) | 0.024 |
| P3 | 1563.0±510.3 (533–2373) | 1226.9±650.0 (493–2127) | 0.212 |
| Total hospitalization | 1686.2±408.5 (1008–2435) | 1276±404.7 (349–1870) | 0.015 |
| Caloric adequacy (%) | |||
| P1 | 95.4±20.5 (64–139) | 83.7±18.6 (48–109) | 0.120 |
| P2 | 71.0±23.1 (39–120) | 50.2±24.0 (21–81) | 0.032 |
| P3 | 73.9±23.8 (20–118) | 56.5±30.4 (20–99) | 0.172 |
| Total hospitalization | 79.1±20.7 (41–120) | 59.8±19.9 (35–86) | 0.02 |
| Protein intake (g) | |||
| P1 | 89.0±20.1 (53–122) | 72.3±19.7 (35–98) | 0.037 |
| P2 | 63.7±23.9 (26–116) | 40±22.4 (14–76) | 0.013 |
| P3 | 65.2±27.7 (16–127) | 49.2±36.9 (11–116) | 0.287 |
| Total hospitalization | 71.8±21.0 (39–113) | 50.6±20.6 (26–79) | 0.014 |
| Protein adequacy (%) | |||
| P1 | 83.3±21.2 (48–131) | 71±18.6 (37–96) | 0.106 |
| P2 | 59.9±22.6 (30–120) | 38.8±21.1 (12–67) | 0.017 |
| P3 | 60.0±21.7 (14–100) | 47.6±34.3 (10–109) | 0.361 |
| Total hospitalization | 67±18.4 (34–110) | 42.2±18.9 (29–75) | 0.022 |
The average length of each hospitalization period was 6.6±6.7 days (P1), 13.6±5.9 days (P2) and 4.2±3.8 days (P3). Patients showed lower calorie and protein intake and adequacy during P2 (time between transplantation and engraftment) with the group submitted to allogeneic HSCT having significantly lower intake and adequacy of calories (p-value<0.024 and p-value<0.032, respectively) and proteins (p-value<0.013 and p-value<0.017, respectively) than the autologous HSCT group. Protein intake in the allogeneic HSCT group was lower (p-value<0.037) than in the autologous group since the initial hospitalization period (P1). After engraftment (P3), patients submitted to both types of transplantation showed improvements in calorie and protein ingestion, even though it remained lower than during the first hospitalization period (P1).
In the analysis of the average calorie consumption during the whole hospitalization period, there was no statistically significant difference between patients submitted to autologous HSCT who had infections and those who did not (1750.7±402.1Kcal vs. 1717.6±418.6Kcal; p-value=0.855). The same is true in respect to calorie adequacy (81.07±21.95% in patients who had infections and 80.9±22% in patients without infections; p-value=0.990). Likewise, in patients submitted to allogeneic HSCT, no significant differences were found for calorie intake (1276.5±421.2 vs. 1392.4±435.6; p-value=0.754) or adequacy (69.0±24.0 vs. 63.3±19.2; p-value=0.739) in relation to infections.
A weak to strong positive correlation was found between the length of hospitalization stay of patients submitted to allogeneic HSCT and their calorie consumption (Rs=0.67; p-value=0.032) and adequacy (Rs=0.72; p-value=0.019) during the whole hospitalization period.
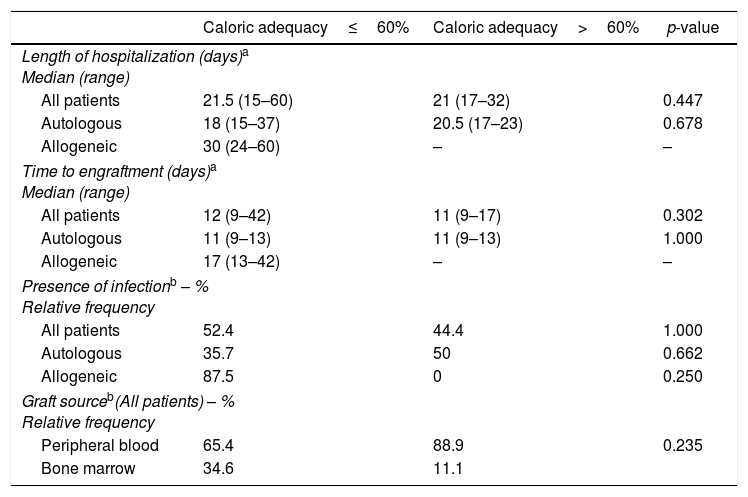
The analysis of the clinical characteristics of patients showed no significant difference on comparing data from subjects who did or did not achieve calorie adequacy greater than 60%, as recommended (Table 5).
Evaluation of clinical characteristics according to caloric adequacy achieved by patients submitted to autologous and allogeneic hematopoietic stem cell transplantation.
| Caloric adequacy≤60% | Caloric adequacy>60% | p-value | |
|---|---|---|---|
| Length of hospitalization (days)a Median (range) | |||
| All patients | 21.5 (15–60) | 21 (17–32) | 0.447 |
| Autologous | 18 (15–37) | 20.5 (17–23) | 0.678 |
| Allogeneic | 30 (24–60) | – | – |
| Time to engraftment (days)a Median (range) | |||
| All patients | 12 (9–42) | 11 (9–17) | 0.302 |
| Autologous | 11 (9–13) | 11 (9–13) | 1.000 |
| Allogeneic | 17 (13–42) | – | – |
| Presence of infectionb – % Relative frequency | |||
| All patients | 52.4 | 44.4 | 1.000 |
| Autologous | 35.7 | 50 | 0.662 |
| Allogeneic | 87.5 | 0 | 0.250 |
| Graft sourceb(All patients) – % Relative frequency | |||
| Peripheral blood | 65.4 | 88.9 | 0.235 |
| Bone marrow | 34.6 | 11.1 | |
Upon admission, the vast majority of patients had excessive weight and there were no undernourished subjects. These findings are similar to those previously reported by Defranchi et al.,2 who studied 123 patients submitted to autologous and allogeneic HSCT and did not find any undernourished subjects, while 67.4% were overweight/obese. Prevalence of excess weight in the analyzed samples was also reported by other studies.9,18–20 This information might be explained by the increase in weight of the general population stemming from changes in feeding habits and lifestyle,21 and might also be due to the submission of patients to an evaluation of the clinical conditions before undergoing transplantation.
Despite being practical and quick, the assessment of the nutritional state by means of the BMI does not adequately represent the body composition, and thus it must be supported by other anthropometric assessment methods. These methods include physical and biochemical examinations, assessment of the dietary intake and Patient-Generated Subjective Global Assessment (PG-SGA), all of which enable the diagnosis of protein/calorie malnutrition as well as specific nutritional deficiencies.15 However, due to the use of data from medical records, only the BMI, weight loss and dietary intake were used to assess the nutritional state in this study.
On comparing nutritional evaluation methods in patients who underwent allogeneic HSCT, Sommacal et al.22 stated that the percentage of weight loss associated with fortnightly assessed anthropometric measures, such as arm circumference and triceps skinfold thickness, are adequate methods for the nutritional follow-up of patients. However, during hospitalization, an imbalance of electrolytes and fluids in patients might occur, likely leading to a positive hydric balance, which might affect the anthropometric evaluation and conceal the real weight of the patient.
The change in nutritional state during hospitalization is probably due to the patients’ worsening dietary intake and weight loss as a result of the treatment. No statistically significant variation in the occurrence of gastrointestinal symptoms and in weight loss was found between the patients who underwent autologous and those submitted to allogeneic HSCT, which shows that irrespectively of the kind of treatment, both groups of patients are at nutritional risk.
The weight loss in patients who underwent allogeneic HSCT (4.9kg) was greater than the values found by Ferreira et al.,9 whose study evaluated 64 subjects and reported a median weight loss of 2.5kg. So et al.4 also reported less weight loss in comparison to the current study (3.7% vs. 6.7%) when assessing a 27-patient group. These differences might be due to patients receiving parenteral nutrition, which ensures greater nutritional intake and helps avoid weight loss in comparison to the use of oral nutritional therapy alone.
In this study, 94.2% of the patients received nutritional therapy by means of oral supplementation with the median length of usage being nine days. Since the duration of nutritional therapy was not statistically different between the types of HSCT, it is likely that oral nutritional supplementation had a protective role in mitigating weight loss in all patients.
Patients reduced their food intake after undergoing HSCT (Periods 2 and 3), which is likely attributable to gastrointestinal symptoms. The lowest mean values of calorie and protein adequacy were 20% and 10%, respectively. Clinical practice has shown that one of the reasons for the lower protein adequacy in relation to calorie adequacy is the patients’ poor acceptance of supplements, meat and other protein sources. Besides, many patients have food aversions stemming from prior-to-hospitalization chemotherapy treatments, which makes the intake of certain food groups even harder.
When comparing dietary intake throughout hospitalization between patients who underwent autologous and allogeneic HSCT, the reduction in calorie-protein intake occurred more prominently in patients who were submitted to allogeneic HSCT. This reduction was more significant during Period 2, in which the calorie adequacy percentage was 50.2±23.96%, whilst protein adequacy was 38.8±21.08%. These values are lower than the ones usually expected.1,6 The more aggressive treatment to which this group of patients is exposed is one of the reasons for the lower ingestion levels, which leads to more severe side effects and thus greater reductions in food intake.
According to the National Consensus on Oncologic Nutrition,1 in the context of a functional gastrointestinal tract, enteral diet is prescribed if oral intake is lower than 60% of the patient's nutritional needs for at least three days. In the current study, even with the use of oral supplements, 74.2% of the patients (n=26) did not meet this minimum percentage of their nutritional needs for at least three days. Moreover, 25.7% and 42.8% of the patients, respectively had calorie and protein adequacy levels lower than 60% throughout hospitalization. No patient in the sample received enteral or parenteral nutrition. The significance of nutritional follow-up during the whole treatment in order to meet the nutritional needs should be emphasized, and it is of great importance to raise awareness among the patients themselves and the multidisciplinary teams about its benefits.
In spite of the low food consumption of the patients who underwent allogeneic HSCT, the average length of the hospital stay (30 days) was similar or lower to the results found by Ferreira et al.9 (36 days), Garófolo23 (37 days), Sommacal22 (39 days) and So et al.4 (31 days). The time lapsed from transplantation to engraftment (17 days) was longer than the time reported by So et al.4 (13 days) and close to that of Ferreira et al.9 (18 days).
This study is different from others for having assessed calorie and protein intake and adequacy in patients who underwent autologous and allogeneic HSCT in three distinct hospitalization periods, during which dietary intake varies greatly due to the treatment, as observed in the clinical practice. Between admission and transplantation (P1), most patients are able to keep satisfactory food intake rates even during chemotherapy. In the period between transplantation and engraftment (P2), the toxic effects of chemotherapy on the gastrointestinal tract occur and the patients’ eating difficulties start, and thus their nutritional needs are not met. Between engraftment and hospital discharge (P3), patients start to eat better, but this recovery process occurs gradually and retains quantitative and qualitative limitations in respect to food intake. The qualitative-only assessment of the diet is a limitation of this research, as well as the size of the sample, which did not allow for the assessment of the effects of clinical variables, such as conditioning regimens, which might influence dietary intake.
ConclusionPatients who underwent autologous or allogeneic HSCT had changes in their nutritional states with weight loss and reduction in food intake. The allogeneic HSCT group had more pronounced changes in diet acceptance and longer hospital stays, as well as a greater delay from transplantation until engraftment. Despite daily nutritional follow-up and oral supplementation, the majority of patients did not meet their nutritional demands and so it is crucial that patients start receiving enteral and/or parenteral nutritional support.
Conflicts of interestThe authors declare no conflicts of interest.


