


A retrospective ecological longitudinal study was carried out with data on blood components use from two private hospital units that belong to the same organization located in Belo Horizonte between July 2017 and June 2019.
ObjectivesTo describe the monthly series of red blood cells, platelets and plasma use and the rate of blood components use for general hospitalizations in the health network, from the perspective of time series.
MethodsA total of 15 time series were created with monthly data related to the use of blood components. The stationarity of the series was verified by the unit root test, the trend, by the Cox–Stuart test and seasonality, by the Fisher test (significance levels of 10% for the first test and 5% for the last two).
ResultsAll series tested positive for the trend component and showed an increasing trend for the use of blood components. Ten series showed statistically significant seasonality and eight series were identified as non-stationary. The percentage of transfusions of blood components due to hospitalization at hospitals 1 and 2 was 29% (22% at hospital 1 and 38.9% at hospital 2).
ConclusionThis study was able to describe the components of blood components use dynamics, from the perspective of time series at hospitals. Due to the growing trend in demand for blood components and their high cost, we propose the reduction of blood components use and the expanded use of alternative blood transfusion strategies.
Blood component transfusion is considered a relatively modern therapy and is widely used in Brazil and in the world.1,2 It is estimated that between 5% and 9% of hospital expenses are related to blood transfusions and that, on average, 20% of hospitalizations in general hospitals are associated with the use of blood components.3–5
Due to the aging population, the use of hospital health services is projected to increase in Brazil.6 Concurrently, the reduction in blood donation rates is projected simultaneously with the increase in the demand for blood components.1
The Brazilian literature timidly presents studies with time series related to blood transfusions.7 The need to conduct studies that allow for the description of the use of blood components dynamics at Brazilian hospitals thus became apparent.
The objective of this study was to describe the use of blood components at two private hospitals in Belo Horizonte, Minas Gerais, Brazil, known to be references in the provision of hospital health services in Brazil, with data referring to the period between July 2017 and June 2019, from the perspective of time series analysis.
MethodsSeries creationA retrospective ecological longitudinal study was carried out with data on the use of blood components for the period between July 1, 2017 and June 30, 2019 at two large private hospitals located in Belo Horizonte, Minas Gerais, Brazil.
The choice of this period was due to the existence of electronic reports from mid-June 2017 at both hospitals.
Eight time series were built with monthly data on the use of blood components in the two hospitals studied. They are: 1) total red blood cells at hospital 1; 2) total platelets at hospital 1; 3) total plasma at hospital 1; 4) total blood components at hospital 1; 5) total red blood cells at hospital 2; 6) total platelets at hospital 2; 7) total plasma at hospital 2, and; 8) total blood components at hospital 2.
Subsequently, three series were constructed with the total blood components used at hospitals 1 and 2. They are: 9) total red blood cells at hospitals 1 and 2; 10) total platelets at hospitals 1 and 2; 11) total plasma at hospitals 1 and 2, and; 12) total blood components used at hospitals 1 and 2.
Finally, three series were created with the summed use rates of blood components for hospitalizations at hospitals 1 and 2. They are: 13) the blood components use rate at hospital 1 for admissions to hospital 1; 14) the blood components use rate at hospital 2 for admissions to unit 2, and; 15) the blood components use rate at hospitals 1 and 2 due to hospitalizations at hospitals 1 and 2.
In this study, the group of red blood cells was composed of red blood cell concentrate; aliquoted red blood cells 1 and 2 concentrate; irradiated red blood cells concentrate; aliquoted irradiated red blood cells 1 and 2 concentrate; phenotyped red blood cells concentrate; irradiated phenotyped red blood cells concentrate; delucotized red blood cells concentrate, and; washed irradiated delucotized phenotyped red blood cells concentrate.
The group of blood platelets was composed of platelet concentrate; irradiated platelets concentrate; platelet concentrate by delucotized apheresis I and II; platelet concentrate by irradiated delucotized apheresis I and II; platelet pool; pool of irradiated platelets; delucotized platelet pool, and; irradiated delucotized platelet pool.
The group of plasma blood components was composed of fresh frozen plasma; fresh frozen plasma aliquoted 1, and; cryoprecipitate.
Statistical analysisThe statistical analysis was performed according to the classic model for time series, in which a series can be described as the sum or multiplication of the components of trend, seasonality and randomness.8 In this study, the additive model was used:
in which:Zt : is the temporal observation of t ;Tt : is the trend component;St : is the seasonality component, and;at : is the random component.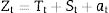
The analysis of time series allows for the identification of the behavior of the series, their components and the making of projections for better decision-making.
The KPSS unit root test (Kwiatkowski–Phillips–Schmidt–Shin) was performed to determine whether the series was stationary or not (non-stationary series if p-value <0.1). Subsequently, the second unit root test was performed after order 1 differentiation in all series to confirm its non-stationarity.
The Cox–Stuart sign test was used to identify the presence or absence of the trend component. The application of the Cox-Stuart test can be divided into five stages:
- 1)
Group observations in pairs (Z1, Zc+1), (Z2, Zc+2), …, (ZN-c, ZN), in which c = N/2, case N (number of observations) is even and c = (N + 1)/2, if N for odd;
- 2)
For each pair (Zi, Zc+i), a signal is assigned. If Zi < Zc+i, the negative sign (−) is given, and if Zi > Zc+i, the positive sign (+) is given. In case of Zi = Zc+I, the comparison is discarded;
- 3)
The null hypothesis is tested, in which the null hypothesis is that there is no trend and the alternative hypothesis is that there is a trend. The test statistic, T, is given by the number of positive signs;
- 4)
The value of T is compared to the value of t, which is given by the following expression:
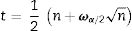
- 5)
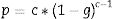
When T ≥ n − t, the null hypothesis that there is no trend is rejected and the Fisher's test is used to identify the presence or absence of the seasonality component and having obtained the series periodogram, the g statistic is given by the following expression:

The KPSS unit root test, the Cox–Stuart test and the Fisher test were applied to the raw data of all series. The statistical analyses, as well as the production of the graphs, were performed using the statistical program R, version 3.5.3.
The data collection was authorized in the research project approved on November 12, 2019 and performed on December 23, 2019 at the blood bank. The research was submitted to Plataforma Brasil and approved on December 11, 2019.
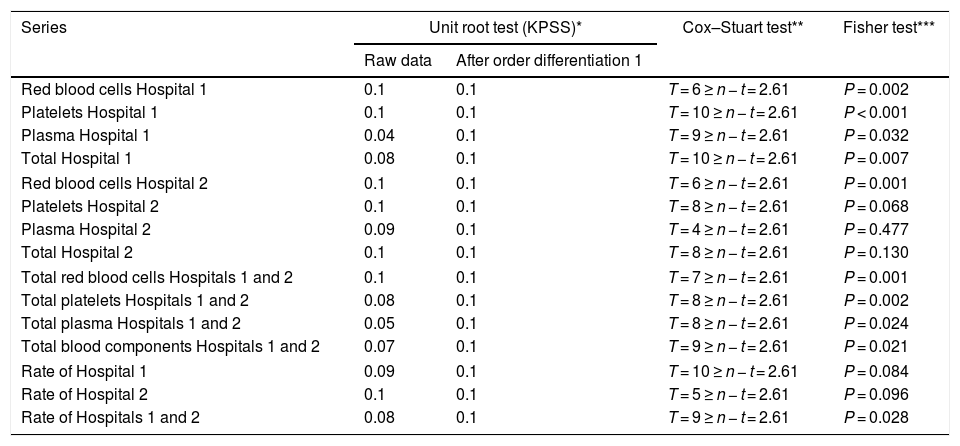
ResultsThe KPPS unit root test identified the following series as stationary (p-value ≥0.1), with non-stationary periods: total red blood cells at hospital 1; total platelets at hospital 1; total red blood cells at hospital 2; total platelets at hospital 2; total red blood cells at hospitals 1 and 2,and; the rate of blood components use at hospital 2. The other series were non-stationary (p-value <0.1), with stationary periods. The eight non-stationary series required a differentiation process for their transformation into stationary series.
The trend component was present in all series. The seasonality component was present in most of the series (10). In the other series (5), the seasonal component found was not statistically significant at the 5% significance level, being: total platelets at hospital 2; total plasma at hospital 2; total blood components at hospital 2; the rate of blood components use at hospital 1, and; the rate of blood components use at hospital 2. The results of the statistical analysis are shown in Table 1.
Results of the stationarity tests (Unit root test – KPSS), trend components (Cox–Stuart test) and seasonality (Fisher test) for the 15 studied time series.
| Series | Unit root test (KPSS)* | Cox–Stuart test** | Fisher test*** | |
|---|---|---|---|---|
| Raw data | After order differentiation 1 | |||
| Red blood cells Hospital 1 | 0.1 | 0.1 | T = 6 ≥ n − t = 2.61 | P = 0.002 |
| Platelets Hospital 1 | 0.1 | 0.1 | T = 10 ≥ n − t = 2.61 | P < 0.001 |
| Plasma Hospital 1 | 0.04 | 0.1 | T = 9 ≥ n − t = 2.61 | P = 0.032 |
| Total Hospital 1 | 0.08 | 0.1 | T = 10 ≥ n − t = 2.61 | P = 0.007 |
| Red blood cells Hospital 2 | 0.1 | 0.1 | T = 6 ≥ n − t = 2.61 | P = 0.001 |
| Platelets Hospital 2 | 0.1 | 0.1 | T = 8 ≥ n − t = 2.61 | P = 0.068 |
| Plasma Hospital 2 | 0.09 | 0.1 | T = 4 ≥ n − t = 2.61 | P = 0.477 |
| Total Hospital 2 | 0.1 | 0.1 | T = 8 ≥ n − t = 2.61 | P = 0.130 |
| Total red blood cells Hospitals 1 and 2 | 0.1 | 0.1 | T = 7 ≥ n − t = 2.61 | P = 0.001 |
| Total platelets Hospitals 1 and 2 | 0.08 | 0.1 | T = 8 ≥ n − t = 2.61 | P = 0.002 |
| Total plasma Hospitals 1 and 2 | 0.05 | 0.1 | T = 8 ≥ n − t = 2.61 | P = 0.024 |
| Total blood components Hospitals 1 and 2 | 0.07 | 0.1 | T = 9 ≥ n − t = 2.61 | P = 0.021 |
| Rate of Hospital 1 | 0.09 | 0.1 | T = 10 ≥ n − t = 2.61 | P = 0.084 |
| Rate of Hospital 2 | 0.1 | 0.1 | T = 5 ≥ n − t = 2.61 | P = 0.096 |
| Rate of Hospitals 1 and 2 | 0.08 | 0.1 | T = 9 ≥ n − t = 2.61 | P = 0.028 |
The unit root test was applied to raw data and data after order 1 differentiation. The Cox–Stuart test and Fisher’s test were applied to raw data.
Throughout the analyzed period, 8361 blood components (46.2% red blood cells, 28.7% platelets and 25.1% plasma) were used and varied between a minimum of 158 blood components (October 2017) and a maximum of 656 blood components (April 2019).
The series referring to the use of red blood cells at Unit 1 showed an increasing trend for the first and third thirds of the series and a decreasing trend for the second third of the series, with an average of 313.6 blood components used monthly throughout the period. The average found for the first year was 305 erythrocytes and 322 erythrocytes for the second year. The seasonality found was 12 months, with peaks found in April and May and dips, in July and September.
The series referring to the use of platelets at hospital 1 showed an increasing trend, with an average of 100 blood components used monthly throughout the period. The average found for the first year was 79.8 platelets and 120.5 platelets for the second year. The seasonality found was 12 months, with a peak found in July and a dip, in December.
The series referring to the use of plasma at hospital 1 showed an increasing trend, with an average of 87.3 blood components used monthly throughout the period. The average found for the first year was 60.7 blood components and 114 blood components for the second year. The seasonality found was 12 months, with a peak found in December and a dip, in November.
The series referring to the total of blood components used at hospital 1 showed an increasing trend, with an average of 348.4 blood components used monthly throughout the period. The average found for the first year was 300.8 blood components and 396 blood components for the second year. The seasonality found was 12 months, with a peak found in January and dips, in September and November.
The four series related to the use of blood components at hospital 1, as well as the breakdown into their trend, seasonality and random components, are shown in Figure 1.
Hospital 2
In the whole period analyzed, 10,588 blood components (34.6% red blood cells, 50% platelets and 15.4% plasma) were used and varied between a minimum of 266 blood components (June 2018) and a maximum of 917 blood components (October 2018).
The series referring to the use of red blood cells at hospital 2 showed a decreasing trend for the first period of the series and an increasing trend for the second period of the series, with an average of 152.7 blood components used monthly throughout the period. The average found for the first year was 144.8 erythrocytes and 160.6 erythrocytes for the second year. The seasonality found was 12 months, with a peak found in October and a dip, in February.
The series regarding the use of platelets at hospital 2 showed an increasing trend, with an average of 220.6 blood components used monthly throughout the period. The average found for the first year was 200.6 platelets and 240.7 platelets for the second year. The seasonality found was 12 months, with a peak found in October and a dip, in June.
The series referring to the use of plasma at Unit 2 showed an increasing trend, with an average of 67.8 blood components used monthly throughout the period. The average found for the first year was 56.5 blood components and 79.2 blood components for the second year. The seasonality found was 12 months, with a peak found in October and a dip, in September.
The series referring to the total of blood components used at hospital 2 showed an increasing trend, with an average of 441.2 blood components used monthly throughout the period. The average found for the first year was 401.9 blood components and 480.4 blood components for the second year. The seasonality found was 12 months, with a peak found in October and a dip, in September.
The four series related to the use of blood components at hospital 2, as well as the breakdown into its trend, seasonality and random components, are shown in Figure 2.
Hospitals 1 and 2
Throughout the analyzed period, 18,949 blood components (39.7% red blood cells, 40.6% platelets and 19.7% plasma) were used and varied between a minimum of 466 blood components (September 2018) and a maximum of 1283 blood components (October 2018).
The series referring to the use of red blood cells at hospitals 1 and 2 showed an increasing trend for the entire period, with an average of 313.6 blood components used monthly throughout the period. The average found for the first year was 305.2 red blood cells and 322 red blood cells for the second year. The seasonality found was 12 months, with peaks found in April and May and a dip, in February.
The series regarding the use of platelets at hospitals 1 and 2 showed an increasing trend, with an average of 320.8 blood components used monthly throughout the period. The average found for the first year was 280.3 platelets and 361.2 platelets for the second year. The seasonality found was 12 months, with a peak found in October and a dip, in June.
The series referring to the use of plasma at hospitals 1 and 2 showed an increasing trend, with an average of 155.2 blood components used monthly throughout the period. The average found for the first year was 117.2 blood components and 193.2 blood components for the second year. The seasonality found was 12 months, with a peak found in October and a dip, in September.
The series referring to the total of blood components used at hospitals 1 and 2 showed an increasing trend, with an average of 789.5 blood components used monthly throughout the period. The average found for the first year was 702.8 blood components and 876.3 blood components for the second year. The seasonality found was 12 months, with a peak found in October and a dip, in September.
The four series related to the use of blood components at hospitals 1 and 2, as well as the breakdown into their trend, seasonality and random components, are shown in Figure 3.
Rate of blood components use per hospitalization
Throughout the analyzed period, 65,283 admissions were identified (58.1% at hospital 1; 41.9% at hospital 2). The percentage of blood components due to monthly hospitalizations at hospital 1, hospital 2 and hospitals 1 and 2 combined, are shown in Figure 4.

The series referring to the percentage of blood components used for monthly hospitalizations at hospital 1 showed an increasing trend for the entire period, with an average of 22% of hospitalizations with blood components use. The average found for the first year was 19% of hospitalizations using blood components and 25% for the second year. The seasonality found was 12 months, with a peak found in December and a dip, in October.
The series referring to the percentage of blood components used for monthly hospitalizations at hospital 2 showed an increasing trend for the entire period, with an average of 38.9% of hospitalizations with blood components use. The average found for the first year was 37.6% for hospitalizations using blood components and 40.1% for the second year. The seasonality found was 12 months, with a peak found in September and a dip, in June.
The series referring to the percentage of blood components used for monthly hospitalizations at hospitals 1 and 2 combined showed an increasing trend for the entire period, with an average of 29% of hospitalizations with blood components use. The average found for the first year was 26.5% of hospitalizations with blood components use and 31.5% for the second year. The seasonality found was 12 months, with a peak found in August and a dip, in September.
The three series related to the percentage of blood components per hospitalization at hospital 1, hospital 2 and hospitals 1 and 2 combined, as well as the breakdown into its trend, seasonality and random components, are shown in Figure 5.
Discussion
Hospital 1 presented a lower blood components use, according to the raw data and a lower rate of blood components use in hospitalizations, in relation to hospital 2. Although both hospitals are considered general hospitals, such inequality may be related to the management model adopted by both hospitals, being hospital 2 more structurally and technologically robust for care related to neoplasms and diagnostic medicine. This fact influences the number of transfusions performed, as this epidemiological characteristic is associated with the increased blood components use.9–11
The trend component tested positive for the three groups of blood components across the network. The growing trend observed in all series is in line with the current literature on the topic that points to the growth in demand for blood components due to an aging population.1,7
As for the type of blood component used, red blood cells and platelets were the most used, followed by plasma. However, there were significant differences between the two hospitals; at hospital 1 there was a predominance of red blood cells use and at hospital 2 there was a predominance of platelets use. Such a discrepancy can be explained by the already mentioned difference in the management model adopted by the two hospitals.
In Brazil, there is a predominance of red blood cells use (56% of the total transfused blood components), followed by platelets and plasma use.12–15 The findings in this study suggest the greater proximity of blood products use at hospital 1 to what is practiced at the national level, in relation to the hospital 2.
The seasonal component found in the entire network identified the month of October as the month with the highest blood components use. However, this finding must be compared with future analyses on blood components in October 2018. In this case, the use of 399 blood components at hospital 2 was identified, well above that observed for the rest of the series that presented the average use of 53.4 units of the same blood component. Such an occurrence may have contributed to the existence of the most evident seasonal component at Unit 2, in relation to hospital 1.
The rates of blood components use per hospitalization found in this study indicate the blood components use mostly above that found in the literature on the subject, approximately 20% for general hospitals. The blood components transfusion rate of at hospital 2 (on average 38.9%) is similar to the rates found at an intensive care unit.16,17
Given the transfusion context presented, the adoption of more restrictive protocols for blood transfusions and blood management programs is to be suggested.5,18 Such programs seek to reduce blood transfusion rates by expanding the scope of alternative strategies/options for blood components transfusions, such as the use of anesthetic products and techniques (acute normovolemic hemodilution, plasma volume expanders and cell-free oxygen carriers), equipment and surgical products that restrict blood loss (electrocautery, cell saver and biological glues) and agents that stimulate blood production (recombinant human erythropoietin, folic acid and vitamin B12).19–24 Additionally, such programs would be in line with the advances made in Brazil regarding what is considered the best use of blood, especially with the National Policy for Blood and Blood Products, which has among its objectives to contribute to the reduction of transfusion reactions, underreporting of transfusion reactions, indiscriminate demand for blood components and poorly informed or poorly reported demand for blood components.25
ConclusionThis study allowed for the analysis of the components of the time series, related to the use of blood components at two private hospital establishments of the same health organization in Belo Horizonte, Minas Gerais, Brazil. Due to the estimated increase in blood components use at the two hospitals observed and their high associated cost,1,19,26 we propose the performance of studies related to the blood components indication and use at these two hospitals, as well as the expansion of alternative strategies for blood transfusions.
Conflicts of interestThe author declares no conflicts of interest.


