


Hematopoietic stem cell transplantation (HSCT) is a widely used therapy, but its success largely depends on the number and quality of stem cells collected. Current evidence shows the complexity of the hematopoietic system, which implies that, in the quality assurance of the apheresis product, the hematopoietic stem cells are adequately characterized and quantified, in which mass cytometry (MC) can provide its advantages in high-dimensional analysis.
ObjectiveThis research aimed to characterize and enumerate CD45dim/CD34+ stem cells using the MC in apheresis product yields from patients with chronic lymphoid malignant diseases undergoing autologous transplantation at the Abu Dhabi Stem Cells Center.
MethodsAn analytical and cross-sectional study was performed on 31 apheresis products from 15 patients diagnosed with multiple myeloma (n = 9) and non-Hodgkin lymphomas (n = 6) eligible for HSCT. The MC was employed using the MaxPar Kit for stem cell immunophenotyping. The analysis was performed manually in the Kaluza and unsupervised by machine learning in Cytobank Premium.
ResultsAn excellent agreement was found between mass and flow cytometry for the relative and absolute counts of CD45dim/CD34+ cells (Bland-Altman bias: -0.029 and -64, respectively), seven subpopulations were phenotyped and no lineage bias was detected for any of the methods used in the pool of collected cells. A CD34+/CD38+/CD138+ population was seen in the analyses performed on four patients with multiple myeloma.
ConclusionsThe MC helps to characterize subpopulations of stem cells in apheresis products. It also allows cell quantification by double platform. Unsupervised analysis allows results completion and validation of the manual strategy. The proposed methodology can be extended to apheresis products for purposes other than HSCT.
Autologous hematopoietic stem cell transplantation (HSCT) is a therapy routinely used to treat malignant blood diseases and is extended to other diseases. It is a complex, specialized, high-cost treatment with a high degree of personalization. From 1957 to 2016, approximately 1,298,897 hematopoietic transplantation (57.1% autologous) procedures were recorded worldwide.1 Unfortunately, approximately a third of autologous or allogeneic transplant recipients die for reasons other than the relapse of the primary disease, including engraftment or organ failure, perhaps due to biases in the collected subpopulations.2
The number of CD34+cells/kg of weight to be infused is one of the most critical factors that define the success of this type of therapy.1 However, the phenotypic composition of the hematopoietic stem cell (HSC) population must be clearly defined. Since the 1980s, the procedures for HSC mobilization and collection techniques in peripheral blood have made it possible to reduce the complexity of the process that was performed using bone marrow.3 At the same time, the development of single-cell characterization techniques shows more heterogeneity in this population, making the definition of the HSC slightly inconsistent.4
In addition to the CD34+cells/kg dose, some subsets have been added as predictive biomarkers: CD34+/CD38−, CD34+/CD90− and CD34+/CD38+.5,6 However, it is necessary to increase the number of markers in the immunophenotyping since it allows for deepening the diversity of the HSCs, as they are a heterogeneous group of cells. Subsets characterized by two markers do not consider rare or minority populations that play an essential role in the homeostasis of bone marrow cell niches or ignore their parental phenotypes. For this reason, it is necessary to extend immunophenotyping, taking advantage of technological development and the flexibility of this methodology. Finding regularities within this diversity will allow for the discovery of new and more robust biomarkers. This emerging knowledge makes the treatment approach more complex, but it allows for the identification of possible biases within the balance of progenitors of stem lineages collected to define the prognosis with greater certainty and provide more elements for the follow-up of these patients. However, the “gold standard” for HSCT remains the quantification of progenitor cells with the CD45dim/CD34+ phenotype and characterization of the apheresis product yield, primarily using the International Society for Hematotherapy and Graft Engineering guidelines (ISHAGE).7,8 Nevertheless, it results in a reductionist vision of the quality assurance of the product to be transplanted. The clinical implications of knowing the sub-phenotypic composition of autologous HSCs in the apheresis product are evident.
Biases within these subpopulations of hematopoietic progenitors may lead to the engraftment failure of specific lineages.9 In this sense, identifying imbalances in the composition would make it possible to recover fractions by modifying or repeating the mobilization and collection scheme until the optimal concentrations of each affected subpopulation are reached, before performing the transplant. Studies on multiplexed platforms will be required to define predictive biomarkers and to know optimal concentrations.
Mass cytometry (MC) is one of the methodologies that has allowed multiparametric analysis on a single cell. More than 40 antigens can be identified in the same cell without some of the complexities of flow cytometry (FC), such as compensation and fluorescence-minus-one controls. However, it has limitations, such as not offering an absolute count of cells/µL and not having the complete standardization and validation process for clinical diagnosis.10 Multiparameter analysis strategies should be completed with unsupervised machine learning analyses, such as the FlowSOM, that allow for the elimination of bias introduced by studies based only on known phenotypes.11 As the number of markers on a single cell increases considerably, automation is needed for a more suitable approach.
Current evidence suggests that it should not be enough to quantify the collected stem cells. They should be characterized to detect lineage biases and, possibly, functional alterations, senescent phenotypes and pathological populations contained in the product to be transplanted, as all of them will affect the success of the transplant. Therefore, this study aimed to assess the feasibility of using the MC to characterize and enumerate the CD45dim/CD34+ stem cell population collected by apheresis, from patients with chronic lymphoid malignancies undergoing autologous HSCT, at the Abu Dhabi Stem Cells Center (ADSCC), United Arab Emirates.
MethodsHSC apheresis collectionAn analytical and cross-sectional study was performed on 31 completed apheresis procedures at the ADSCC Apheresis Unit in 15 patients diagnosed with multiple myeloma (n = 9) and non-Hodgkin lymphomas (n = 6) eligible for autologous HSCT in the Abu Dhabi Bone Marrow Transplantation Program (AD-BMT®), between July 2020 and December 2022. Both genders were represented, with nine male and seven female patients under HSC mobilization from Bone Marrow to peripheral blood. The granulocyte Colony Stimulating Factor (G-CSF) and Plerixafor (when indicated) were given at standard doses for five days until 12 h prior to the apheresis procedures. All the aphereses collections were performed using the Amicus® Separator System (Fresenius Kabi, Germany) running a software v6.0 through central venous accesses. The means of 12:1 whole blood to the anticoagulant ratio (ACD-A: Anticoagulant Citrate Dextrose Solution, Solution A) was used, with a 1.25 mg/kg/min citrate infusion rate and a maximum whole blood draw rate of 55 mL/min. The collection goal ranges from 2.0 to 5.0 × 10⁶ CD34+ cells/kg (minimum and target, respectively). The apheresis procedures were initiated when the CD34+ count reached a threshold of 20 cells/µL in peripheral blood.
Sample processing, antibody panels and cytometersA total of 31 apheresis samples collected for autologous HSCT were analyzed. Two 0.5 mL samples were taken from the apheresis bags; one was used fresh for the FC, while the other was cryopreserved until processing for the MC.
FC technologyThe Stem-Kit Reagents (Ref#: IM3630) from Beckman Coulter were used. The manufacturer's instructions were followed for staining, acquisition and analysis. This Kit has viability control with 7-AAD, fluorospheres for absolute counting by a single platform and IsoClonic control. The gating strategy for acquisition and analysis followed the ISHAGE guidelines.6,7 The SSClow/CD45dim/CD34+ phenotype was reported in percentage and absolute count (cells/μL). A volume of 0.5 mL of the apheresis product was taken and diluted 1:10 with phosphate-buffered saline (PBS). The cell concentration was checked in a Beckman Coulter DxH 900 hematology counter to prevent it from exceeding 30×109 cells/L, as recommended by the manufacturer. From the 1:10 dilution, 100μL was taken for staining. No fewer than 75,000 events were acquired in the leukocyte window on a 10-color Beckman Coulter Navios EX cytometer. The analysis was performed in the Kaluza C v1.1 (CA. USA).
Mass cytometryFor each sample, 10 million peripheral blood mononuclear cells (PBMCs) were thawed rapidly, washed with the Roswell Park Memorial Institute (RPMI) medium, resting for 24 h at 37 °C in this medium with 10% of fetal bovine serum. Before staining, cells were washed twice with the RPMI medium and adjusted to 2 × 10⁶ cells/mL. Proper staining was used, allowing for dead cell discrimination. Subsequently, cells were resuspended in 500 µL Maxpar PBS containing 1 × 10⁻⁶ m 194Pt Cisplatin (Fluidigm), gently vortexed, and incubated for 5 min. at room temperature. Cells were then washed with the Maxpar Cell Staining buffer and incubated with the following antibodies according to the manufacturer's instructions: CD10–156Gd (clone HI10a), CD13–152Sm (clone WM15), CD34–166Er (clone 581), CD49f-164Dy (clone G0H3), CD117–143Nd (clone 104D2), CD138–168Er (clone DL-101) and CXCR4–175Lu (clone 12G5). In addition, the anti-CD45–154Sm (Clone H130) and anti-CD38–172Yb (HIT2) were added to the original Maxpar Kit (Human Hematopoietic Stem and Progenitor Cell Phenotyping Expansion Panel Kit Catalog#: 201,311), to adequately immunophenotype the HSC origin. After 30 min. of incubation at room temperature (R.T.) the cells were washed twice in the Maxpar Cell Staining buffer and fixed for 10 min. at R.T. with 1.6% of paraformaldehyde. Subsequently, the DNA staining was performed by incubating the cells in the Maxpar Fix and Perm buffer supplemented with 1:1000 191Ir/193Ir Cell-ID Intercalator (Fluidigm) for 18 h at four °C.
Immediately before the acquisition, the samples were washed with the Cell Staining Buffer and Cell Acquisition Solution (Fluidigm, Cat# 201,240) and resuspended in the Cell Acquisition Solution at a concentration of 1 million cells per mL containing a 1:20 dilution of EQ normalization beads (Fluidigm, Cat# 201,078). The sample was acquired on the Fluidigm Helios mass cytometer using the wide bore injector configuration at an acquisition speed of < 400 cells/sec with 400,000 events per sample. The data was exported in the flow cytometry standard (FCS) format.
The concordance between HSC quantification by both methods (MC and FC) was calculated to verify the reliability of the results. In the FC procedure, a single platform was used as per the ISHAGE protocol, while in the MC, we calculated CD45dim/CD34+ values by double platform with the formula:
WBC: White blood cell count; MC: mass cytometry, %: percentage of CD45dim/CD34+cellsMC subpopulation data analysis
Analysis of canonical HSC subpopulations (Table 1) was performed using a sequential, logical, manual gating strategy (Figure 1) with the Kaluza C analysis software v1.1 (CA, USA). First, the subpopulations were defined according to the phenotypes presented in Table 1.
Recognized immunophenotypes used to define HSC subsets.
Legend: HSC: Hematopoietic Stem Cell, MPP: Multipotent Progenitor, MLP: Multipotent Lymphoid Progenitor, PreB/NK: B Cell and Natural killer Precursor, CMP: Common Myeloid Progenitor, HRC: Hematopoietic Repopulating Cell and aPC: Aberrant Plasma Cell.

The unsupervised analysis was conducted with the Cytobank Premium (Beckman Coulter), a machine-learning based, to identify unbiased cellular subsets independent of prior knowledge. The data uploaded to the Cytobank platform were the same as those used in the Kaluza C and prepared to eliminate debris, doublets, dead cells and other unwanted events following the same gating strategy used in the Kaluza C (Figure 1), but only up to the cisplatin plot (viability control).
First, the dimensionality reduction analysis was performed using several methods until the opt-SNE (t-distributed Stochastic Neighbour Embedding), the modified t-distributed Stochastic Neighbor Embedding (t-SNE), was selected, as it showed better data visualization. Subsequently, the results were optimized by changing the execution configuration of the algorithm. Finally, four samples with 100 iterations, 30 perplexities and 0.5 theta were tested to confirm the manual analysis.
After dimensionality reduction, the FlowSOM analysis was performed to cluster cells automatically. The FlowSOM configuration was ten so-called Metaclusters and 121 clusters with hierarchical consensus clustering. The FlowSOM analyses performed on both automatic and manual gating were compared. Finally, the Metaclusters with similar phenotypes were combined.
Statistical analysisThe type of distribution of the data was evaluated using the Shapiro-Wilk test. The parametric methods were used for the normally distributed variables, while the non-parametric ones were for the non-Gaussian distributions.
The Bland-Altman method was performed to assess the agreement between the results of both technologies (FC versus MC). The Spearman's correlation was used to calculate the effect size. Once the excellent correlation and concordance between the values were verified, it was assumed that the subpopulations assessed by the MC were reliable as for the gold standard. The significance threshold was p = 0.05. The statistical processing and creation of the graphs were performed with the GraphPad Prism v8.4 (C.A., USA).
The statistical analysis from the Cytobank results was performed by comparing the median frequency of the Metaclusters using the Kruskal-Wallis analysis of variance and the Mann-Whitney post hoc with the Bonferroni adjustment. These statistics were run on the Cytobank platform itself.
Ethical statementThe study was approved by the ethics committee of the Abu Dhabi Stem Cells Center and written informed consent was obtained from the included patients, which is part of the informed consent within the Abu Dhabi hematopoietic transplant program.
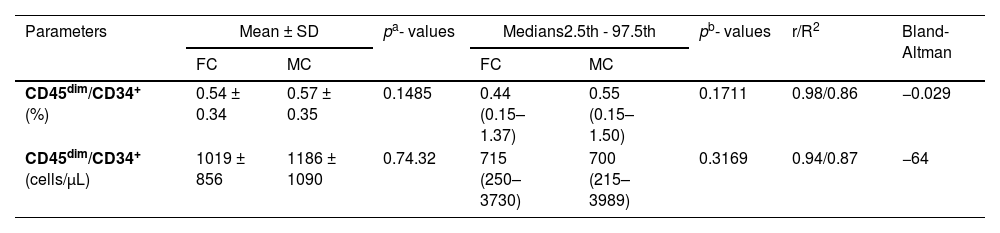
ResultsComparison of CD45dim/CD34+ cell counts by FC and MCThe mean percentage CD45dim/CD34+ cell counts in apheresis bags analyzed by the FC and MC were 0.54% ± 0.34 versus 0.56% ± 0.36, respectively. No significant differences were found with the paired t-test (p = 0.1485). Comparing absolute counts between both types of cytometry, the results of the FC were first compared by single and double platforms, demonstrating an excellent agreement (data not shown). Due to this concordance, the WBC was used to calculate the absolute count in the MC as a double platform from the percentage of CD45dim/CD34+ cells, also obtaining an excellent concordance. (Table 2) Concerning the Bland-Altman analysis, the between-method bias was very low for both values (% and absolute count), denoting an excellent agreement for both determinations. However, it is smaller for relative values than for absolute ones. The regression lines calculated for the differences (% and absolute count) denote a minimal proportional (non-constant) systematic bias, with the differences trending negatively as the magnitude of the measured variable increases. The systematic error is very low, almost zero for% values, with a slight overestimation of the MC, evidenced especially at higher values (Figure 2).
Concordance between the quantifications of CD45dim/CD34+ cells by flow and mass cytometry (n = 31).
Legend: a: paired t-test; b: Wilcoxon test; r: Spearman correlation for to assess effect size; R2: Coefficient of determination; Bland-Altman: Bias values.
 paired with mass cytometry data from CD45dim/CD34+ population. Left panel: comparison between percentage results, it was observed that there is practically no systematic error (bias) and only one value is outside the limits of agreement. There was a tendency to discrete overestimate in the case of mass cytometry in the range of high values. Right panel: similar results were obtained when comparing the absolute values, however all the values were within the limit of agreement.")
Bland-Altman plot with regression line of flow cytometry (reference method) paired with mass cytometry data from CD45dim/CD34+ population. Left panel: comparison between percentage results, it was observed that there is practically no systematic error (bias) and only one value is outside the limits of agreement. There was a tendency to discrete overestimate in the case of mass cytometry in the range of high values. Right panel: similar results were obtained when comparing the absolute values, however all the values were within the limit of agreement.
This analysis leads to the estimate of the absolute count of CD45dim/CD34+ cells in the MC and then quantifies the subsets by double platform.
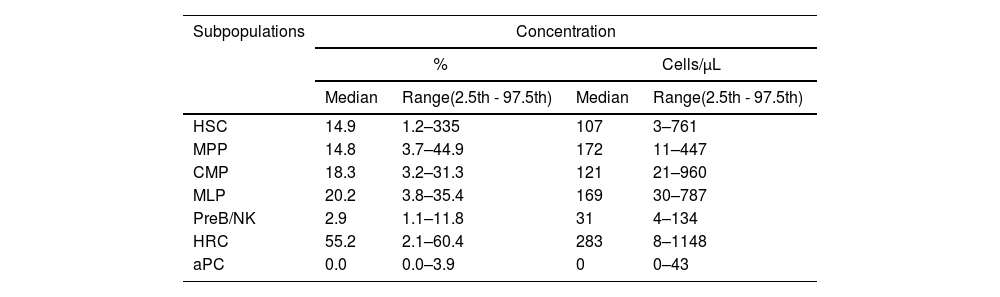
HSC subphenotypes from apheresis products: typical analysis from kaluza with manual gating strategyThe HSC immunophenotypes previously described in the literature were analyzed using the software Kaluza C seven. The analysis of variance with the Friedman test showed significant differences between the subpopulations of typed stem cells (p < 0.0001). However, Dunn's multiple “post hoc” comparisons did not identify significant differences between the median of the early (HSC: 14.9%; MPP: 14.8%) and intermediate (CMP: 18.3%; MLP: 20.2%) subpopulations, but did identify them with the late ones (PreB/NKP) (Figure 3A), this latter subset being a minority, with 2.9%. Aberrant plasma cell phenotypes were also found in 26.6% of the patients (n = 4), with a median positivity of 0.0% and a range of 0.0% - 3.9%. The HRC immunophenotype represented more than half of the collected stem cells (55.2%) (Table 3).
 Canonical subpopulation according to the manual gating strategy analysed in Kaluza C v1.1. (n = 23). B) Visualization of Metacluster Box Plots analyzed by FlowSOM to automatically group cells into 10 so-called metaclusters (n = 4). The cytometry data was uploaded to the Cytobank Premium platform and the opt-SNE maps was run on 9 population identifier markers from 4 samples with FlowSOM configuration was 10 metaclusters and 121 clusters with hierarchical consensus clustering method,100 iterations, 30 perplexity and 0.5 theta. The Kruskal-Wally")
Relative distribution of cell subpopulations contained within the CD45dim/CD34+ group by mass cytometry. A) Canonical subpopulation according to the manual gating strategy analysed in Kaluza C v1.1. (n = 23). B) Visualization of Metacluster Box Plots analyzed by FlowSOM to automatically group cells into 10 so-called metaclusters (n = 4). The cytometry data was uploaded to the Cytobank Premium platform and the opt-SNE maps was run on 9 population identifier markers from 4 samples with FlowSOM configuration was 10 metaclusters and 121 clusters with hierarchical consensus clustering method,100 iterations, 30 perplexity and 0.5 theta. The Kruskal-Wally's H test was no significant (p = 0.1124). Hematopoietic Stem Cells (HSC), Multipotent Progenitor (MPP), Multipotent Lymphoid Progenitor (MLP), B Cell and Natural killer Precursor (PreB/NK P), Common Myeloid Progenitor (CMP), Hematopoietic Repopulating Cells (HRC), and Aberrant Plasma Cells (aPC).
Distribution of subpopulations of HSC (CD45dim/CD34+) in apheresis bag (n = 31).
Legend: HSC: Hematopoietic Stem Cell, MPP: Multipotent Progenitor, MLP: Multipotent Lymphoid Progenitor, PreB/NK: B Cell and Natural killer Precursor, CMP: Common Myeloid Progenitor, HRC: Hematopoietic Repopulating Cells and aPC: Aberrant Plasma Cells. All subpopulations were calculated from total CD45dim/CD34+ cells.
The unsupervised identification of stem cell subpopulations was performed. First, the cells contained in the apheresis were analyzed with opt-SNE maps and it was observed that the island of the CD34+ population was perfectly defined from the rest of the cell groups. A new dimensionality reduction analysis was performed on this island as the initial population (CD45dim/CD34+) to characterize the expression of nine markers. It was found that the CD45 and CD34 markers showed a homogeneous pattern in the population, while the CD49f, CD117, CD10 and CD138 markers formed clusters and the CD38, CD13 and CXCR4 markers had heterogeneous expression patterns. (Figure 4A; right panels)
. A) The graphs (opt-SNE map) on the left with levels of expression of each marker show the clusters defined for the mononuclear populations from the bag, where the clusters of CD45dim/CD34+ cells are very well defined, (enclosed in the red circle). The arrow indicates the opt-SNE visualization of CD45dim/CD34+ population, represented in the graphs on the right. B) opt-SNE map with the FlowSOM Metaclusters Dot Overlays from CD45dim/CD34+ population.")
Multidimensional analysis of hematopoietic stem cells populations and subpopulations in the apheresis bag from mass cytometry data (opt-SNE, Cytobank v 10.1 Sample 19). A) The graphs (opt-SNE map) on the left with levels of expression of each marker show the clusters defined for the mononuclear populations from the bag, where the clusters of CD45dim/CD34+ cells are very well defined, (enclosed in the red circle). The arrow indicates the opt-SNE visualization of CD45dim/CD34+ population, represented in the graphs on the right. B) opt-SNE map with the FlowSOM Metaclusters Dot Overlays from CD45dim/CD34+ population.
Hierarchical consensus clustering was performed using the FlowSOM to identify 10 Metaclusters. The metacluster 8 was formed by clusters showing a long-term HSC-like phenotype co-expressing CD34, CD49f and CD117, without CD38. The metacluster 3 shows a similar phenotype, but includes the CXCR4 marker. The metaclusters 4, 5, 9 and 10 exhibited a pluripotent cell-like phenotype expressing pluripotency markers, such as the CD34, CD117 and CD38. On the other hand, the metacluster 6 showed the expression of CD10 compatible with an MLP-like phenotype. Finally, the metaclusters 2 and 7 were formed by CD13+ groups exhibiting a CMP-like phenotype (Figure 3B). The frequency distribution of the 10 metaclusters in Box Plots did not show significant differences with the Kruskal-Wallis H test (Figure 3B). It was verified that there was no good demarcation of the islands according to the Metacluster Dot Overlays Map (Figure 4B). However, three islands corresponding to the main subpopulations were identified (MPP/HRC, CMP and MLP). These results were obtained after generating a set of heat maps to compare the populations based on the expression levels of the markers. The metaclusters with medians of similar metal intensity were grouped, which allowed the identification of three major populations coinciding with the islands of the opt-SNE. (Figure 4C).
Moreover, a second round of analysis with the same unsupervised HSC subpopulations identification algorithm was applied to the same manual gating strategy used in the Kaluza analysis. Again, the same expression patterns of the antigens used were observed. With the FlowSOM, four resulting metaclusters were possible to identify and these represented the main populations: HSC, MPP, MLP and CMP (Figure 5B), verified by heat maps and metacluster fusion, according to the expression of the markers. The frequency distribution of the resultant four metaclusters also did not show significant differences with the Kruskal-Wallis H test, which suggests a balanced distribution of subsets.
 opt-SNE visualization from manual gating; B) opt-SNE map with the FlowSOM Metaclusters Dot Overlays, Cytobank v 10.1 Sample 19. (opt-SNE/ FowSOM).")
In all the analyses, it was possible to detect clusters for cells that express CD34+/CD38+/CD138+ in the patients who presented them.
DiscussionThe increase and diversification of hematopoietic transplantation require a better understanding and characterization of the set of stem cells collected for transplantation to predict its success and prognosis. Based on the known heterogeneity of the HSC as a complex system,12,13 it is essential to identify lineage biases in the product to be transplanted. In this sense, the methods of choice are the multiparametric and multidimensional analyses, allowing for the advantage of the MC benefits and potential.14,15 However, this method has yet to be approved for use in the clinical practice of hematopoietic transplantation. This study provided scientific evidence that suggests the feasibility of starting the validation process of this technology, so further studies that validate its use in the clinical setting are required. Previous reports have demonstrated its usefulness in evaluating the immune profile after hematopoietic transplantation and graft-versus-host disease, supported by the high-dimensionality approach to identify potential predictor biomarkers.16–18
In the present study, a correspondence study was initially carried out between the gold standard (FC) and the MC to approach the use of the MC in the highly-concentrated HSC sample quantitative immunophenotyping, as occurs in apheresis collections from mobilized peripheral blood. Our results show that it is possible to use the MC to quantify the HSC, as the correspondence and association analyses between the FC and MC have shown outstanding agreement, even when it was required to use the absolute count by the double platform in the case of the MC. This correspondence was demonstrated by the Bland-Altman method. In addition, statistical significance tests were used to validate the result, which showed a higher strength of the correlation (r = 0.98/94 and R2 = 0.86/87; relative/absolute counts, respectively). The slight decrease in the correspondence found for the absolute counts could be due to using a double platform in the MC, differences in sample staining protocols and cell loss, that occur with MC washes.
Previous studies also report excellent correlations between both methodologies. Nicholas et al.,19 reported perfect correspondence between both methods for immunophenotyping common and rare populations in PBMCs. Recently Ravkov et al.,20 conducted a study of many samples with excellent results. In their article, the authors state that a crucial element was to design an optimal window strategy that would allow the analysis to be performed similarly. We chose a system that followed the logic of the first proposal of these authors, that of using the same sequence order. Still, multiple internal controls were added to eliminate unwanted events and the viability control required by ISHAGE was maintained using cisplatin. The MC has the advantage that two iridium isotopes (191Ir and 193Ir) are also included in the panel design for double labelling of the DNA, which makes it possible to detect nucleated events with precision and to discriminate doublets.21 Another element that distinguishes the present study is the inclusion of the absolute count by a double platform of the HSC in the apheresis bag, with an excellent correspondence with the FC.
After checking the possibility of quantifying the CD45dim/CD34+ target population, immunophenotyping of its subsets was performed with their relative and absolute concentrations. The concentration of cells per microliter is essential to calculate the dose in the apheresis bag, which is expressed in cells x 106/kg. In this sense, the referential values are reported. However, no studies have been performed to establish doses by subpopulations. Our global values of CD45dim/CD34+coincide with those reported in previous studies.22–24
Even after mobilization, the low frequency of the HSC subpopulation in peripheral blood renders their immunophenotyping challenging. However, apheresis bags are more feasible, as they are more concentrated, because apheresis works as an enrichment method. Their analysis is better and more reliable, even applying the MC.25 Nevertheless, there is no consensus regarding the CD34+ pool subpopulation immunophenotypes. Recent models consider the complexity of the hematopoietic system and they propose a continuous, flexible and dynamic landscape in which many variables mediate in the ontogeny of stem cells derived from bone marrow.12,26–28 We suggest seven immunophenotypes characterized by nine markers described in the literature (Table 1) that were analyzed in the Kaluza.27,29–41
Although without significant differences, the studied subpopulation distribution using the manual gating in the apheresis bags samples showed a higher percentage and absolute count of the late CMP and MLP progenitors over the HSC and MPP early ones, which could be related to the action of the mobilizing agent G-CSF. (Figure 3A) The subset most committed to the lymphoid lineage (PreB/NK) was the lower represented, perhaps due to the same action of the G-CSF mobilizing agent. Previous studies have shown that G-CSF can affect the composition of HSC subpopulations, causing an imbalance towards less primitive progenitors.42,43 However, in our study, no significant imbalance could be due to the effect of plerixafor, which tends to do the opposite, favoring early phenotypes due to the changes it induces in bone marrow niches.43
The HRC subpopulation showed higher concentrations with statistically significant differences because they were defined as a non-specific HSC (CXCR4+) phenotype that was calculated over total CD34+ cells. The median percentage value of the HRC population was similar to that which was previously described by Dlubek et al.,44 who report that in mobilized blood and apheresis this phenotype represents almost half of the total CD34+ cells. However, our study range was extensive (2.1% - 60.4%), possibly due to the different mobilization regimens applied, in which plerixafor was included in almost 30% of the patients. Pharmacological studies of this drug showed that it blocks the binding of the clone (12G5)45,46 used in our study to detect the CXCR4. However, in the cases that only used filgrastim, the median values for this subpopulation (data not shown) were like those previously reported.
Another population detected with the markers used was the aPC, found in low concentrations in only four patients in our study. Contamination of the apheresis product in multiple myelomas with this rare population of plasma cells was reported many years ago.38,47 Higher apheresis product purity has been associated with more profound responses, whereas contamination decreases overall survival and progression-free survival, in multiple myeloma. However, some studies have found a higher probability that recurrence occurs from residual cells in the marrow, thus weakening the role of the aPC contamination in engraftment.48-50 Although they report their existence and collection for transplantation, the reports of Kuranda et al.51 on multiple myeloma patients state that more studies are required to verify their potential adverse effect on post-transplanted patients.
The aPC is recognized as an independent prognostic factor and may be a new additional tool to demonstrate the efficacy of induction regimens. Therefore, its quantification is recommended, not only in bone marrow, but also in apheresis products.48-50 Quantifying the aPC in the graft also allows patients with high levels to receive additional cycles of induction treatment, reducing graft contamination and overall tumor burden prior to the autologous HCT.49,50
The identification of rare populations, such as the aPC, is favored by unsupervised multiparametric cytometric analyses.
The HSC lineage biases could occur during the emergency hematopoiesis after transplantation and should be considered, as it can lead to transplant failure due to multiple causes.12,52 One of the most critical moments of identifying and treating lineage biases occurs during the characterization of the apheresis product, as complementary apheresis can be indicated to reach the optimal dose for a specific subpopulation. In this regard, there is evidence that the global dose collected critically influences the composition and lineage bias of the HSC population.53 Therefore, it is another element to consider for the subpopulation quantification and the dose calculation before concluding the number of aphereses planned for each patient. Another element in favor of the search for lineage biases is the underlying disease, which affects the bone marrow and hematopoiesis in the case of myeloma, and lymphoma may affect it.54 The bone marrow infiltration can generate these lineage biases. Once identified, although it cannot be corrected in this case, the probability of failure could be evaluated according to its magnitude. In addition, the possibility of the allogeneic variant of transplantation could be assessed and a chimerism obtained would solve the bias, without needing a complete allogeneic transplant. This latter should first be evaluated in laboratory animal models. As for the distribution of progenitors according to lineage commitment in our samples, no significant differences were found among the subpopulations, suggesting they were balanced and there were no lineage biases. These results showed a trend comparable to the reports by Elsayed et al.55. Although the subpopulations and phenotypes are not precisely the same from a hierarchical consensus point of view, they are the same.
The approach to the complexity and heterogeneity of the stem cell population was complemented with an unsupervised machine learning analysis to eliminate possible manual processing biases. Fewer groups of subpopulations were defined by these methods than by the classical manual. Still, the main phenotypes were conserved, as seen in the heat map of the unsupervised analyses of automatic and manual gating. (Figures 4C and C, respectively) The reduction in subpopulations could be due to the expression pattern of some secondary markers and the overlap among subpopulations of HSC described in current models.12,26,28 As previously mentioned, the mobilization process could have contributed to the expression modification of the antigens and their phenotypes.43 These possible causes are described in the literature. They may cause a decrease in the definition of marker expression patterns, which is why automated analyses are recommended to eliminate selection bias.
The dimensionality reduction images offered an excellent visualization of the expression and distribution of the markers. (Figures 4A, 4B, 5A, and 5B) The separation of some subpopulations and the overlap of others showing heterogeneous groups was evidenced. Similar results have been found with the same unsupervised analysis strategy, but with different technologies, such as transcriptomics using single-cell RNA sequencing expression profiling.56
Among the study's limitations are the small sample size and the reduced number of markers used according to the MC potentiality. In this same sense, the Human Hematopoietic Stem and Progenitor Cell Phenotyping Expansion Panel Kit were required to be completed with two markers, CD38 and CD45, to increase the specificity of the proposed phenotype. The line of research will continue to increase the number of markers to phenotype cells, take advantage of the potential of the MC in the approach to high-dimensionality complex analysis and evaluate the clinical implications of future findings.
Another limitation that must be faced is the cost of this technology. However, the first step to reducing the cost and generalizing its use is to demonstrate its usefulness by emphasizing its advantages. There is a precedent for this problem: flow cytometry presented the same challenge in its beginnings. One of the strategies could be to locate this technology initially only in reference centers where samples are sent for analysis. This study offers clues to the benefits of the MC and its combination with machine learning (ML) methods that justify the cost-benefit balance. Among these advantages are:56,57
- •
Handling large volumes of data: Multiparameter flow cytometry can generate huge amounts of data. In combination with the ML, the MC makes it possible to process, analyze and extract valuable information from these large amounts of data, which would be extremely difficult or even impossible to do using conventional methods.
- •
Identification of complex patterns: Subtle and complex patterns are detected in the data, even those that may be missed by manual analysis. This can reveal intricate relationships between different markers and cells, enriching our understanding of cell biology and improving the classification of cell subpopulations.
- •
Reduced human bias and improved reproducibility: Manual analysis may be subject to inter- and intra-observer variations and biases. The ML provides a more objective and consistent approach to data analysis, improving the reproducibility and validity of the results.
- •
Automation of repetitive tasks: the ML can automate routine tasks in multiparameter cytometry analysis, freeing researchers from the manual workload and allowing them to focus on more creative and strategic tasks.
- •
Antibody Panel Optimization: The ML can help design efficient, customized antibody panels to study specific cell populations or traits, maximizing the experiment throughput and reducing costs.
- •
Time and resource efficiency: The automation provided by the ML in the multiparameter cytometry analysis saves time and resources, allowing researchers to focus on more creative and complex aspects of the research.
In conclusion, the MC is useful in studying subpopulations of the HSC collected in apheresis products. It is feasible to accurately enumerate CD34+ cells and their subpopulations using a dual platform, as it has shown excellent agreement with the gold standard and allowed for the identification of rare subsets. The use of unsupervised algorithms satisfactorily completes and validates the multidimensional analysis. The strategy can be extended to apheresis products from conditions other than the AHSCT.
CRediT authorship contribution statementCarlos Agustin Villegas-Valverde: Conceptualization, Methodology, Supervision, Data curation, Formal analysis, Writing – original draft, Writing – review & editing. Antonio Alfonso Bencomo-Hernandez: Conceptualization, Methodology, Supervision, Data curation, Formal analysis, Writing – original draft, Writing – review & editing. Yandy M. Castillo-Aleman: Methodology, Supervision, Data curation, Formal analysis, Writing – review & editing. Yendry Ventura-Carmenate: Conceptualization, Data curation, Formal analysis, Writing – review & editing. Imilla Casado-Hernandez: Data curation, Formal analysis, Writing – review & editing. Rene Antonio Rivero-Jimenez: Data curation, Formal analysis, Writing – review & editing.


