


As 30 to 50% of deep venous thrombosis (DVT) cases remain idiopathic, an increased focus on hematologic variables may therefore reveal novel correlates of DVT. Very few studies have investigated the association of hematological parameters with DVT and the causal relationship between them is still to be elucidated. Therefore, we aimed to investigate the association between serial values of hematologic variables and DVT.
MethodsComplete blood count parameters were serially measured at baseline and then at approximately 3-month intervals for 12 months in 152 adults with the first episode of DVT and 152 age- and sex-matched controls. The odds ratio (OR) with the 95% confidence interval (95%CI) was calculated as a measure of association between hematological parameters and DVT.
ResultsThe red cell distribution width (RDW) was the only hematologic variable which showed an independent and consistent association with DVT at all time points (multivariable-adjusted OR [95%CI] 3.38 [1.28 – 8.91] at baseline, 2.24 [0.85 – 5.92] at 3 months and 2.12 [0.81 – 5.55] at 12 months for RDW > 14.0%). This association was higher for provoked DVT than unprovoked DVT and for DVT plus pulmonary embolism than DVT alone. No significant correlation was found between the high RDW and classical thrombotic risk factors, except malignancy.
ConclusionsWe demonstrated an independent and consistent association of the high RDW with the first episode of DVT in adult patients. The study was probably underpowered to evaluate the association between the high RDW and recurrent DVT. Further large studies with long follow-up are needed to confirm this association.
The deep venous thrombosis (DVT), a major clinical manifestation of venous thromboembolism (VTE), is a common disease with an incidence of approximately 1 to 2 per 1000 persons per year.1 Patients with DVT have a high risk of developing pulmonary embolism (PE), a complication that is associated with high morbidity and mortality, especially in bedridden or hospitalized patients. Even though major progress has been made towards identifying the association of DVT with several acquired and genetic predisposing factors,2 up to 30 to 50% of the cases remain unexplained.3,4
Therefore, there is a need to identify novel laboratory and clinical correlates associated with DVT that can potentially predict its occurrence and assist in decisions regarding thromboprophylaxis. Consequently, during the last few decades, clinical research has focused on the identification of these correlates and the development of predictive models for VTE.5 Serving this purpose, parameters that are reliable, inexpensive and readily available in routine practice, such as hematological variables obtained with complete blood count (CBC) analysis, seem very promising and should be targeted. The role played by leukocytes and erythrocytes in the process of coagulation has been shown in recent studies6-9 and their presence is clearly observed in the anatomy of a venous clot, which consists of a laminar structure of erythrocytes and fibrin, permeated by large numbers of leukocytes.10 Platelets are also effective cellular elements in thrombus formation and play a major role in the pathogenesis of VTE.11
A number of previous studies have convincingly demonstrated an independent association between the high red cell distribution width (RDW) and DVT.12-17 However, only a limited number of studies have investigated other hematological parameters and their association with DVT. An increased focus on other hematologic variables may therefore be justified and may reveal novel predictors for DVT. Moreover, to the best of our knowledge, studies that have investigated the association of serial values of RDW and other hematologic variables with DVT have not been reported in the literature previously. Furthermore, only one previous study has investigated the association of RDW with the recurrence of DVT.16 Therefore, the aim of the present study was to investigate whether serial values of hematologic variables are associated with DVT among adult patients and also to evaluate the possible correlation between these hematologic variables and classical thrombotic risk factors.
MethodsStudy design and study populationThis case-control observational study was carried out in the Department of Hematology, All India Institute of Medical sciences (AIIMS), New Delhi, India over a period of 18 months before the onset of the COVID-19 pandemic. A total of 152 consecutive adult patients aged between 23 and 69 years with a symptomatic objectively-confirmed first episode of acute DVT (including DVT or DVT plus PE), who had been referred from other centers and presented to the outpatient DVT clinic, were included as cases in the study. The diagnosis of DVT was confirmed by duplex ultrasonography and PE, by the contrast-enhanced spiral computed tomography scan. Acute DVT was defined when symptoms of DVT had been present for 14 days or less before the diagnosis and/or duplex ultrasonography indicated the venous thrombosis having occurred within 14 days. Patients with a previous history of DVT and chronic DVT were excluded from the study. A total of 152 age- and sex-matched healthy individuals, without a history of DVT, classical risk factors of DVT and comorbidities, were randomly selected from patient attendants or hospital staffs in the same time period and assigned as controls.
The study was approved by the Institutional Ethics Committee and a written informed consent was obtained from all participants before inclusion in the study.
Study procedureA detailed medical history and relevant clinical examination were attained from all participants to obtain baseline data on clinical characteristics and anthropometric measures, including smoking habits, weight, height, body mass index (BMI) and obesity rating (BMI ≥ 30 kg/m2). Information from all patients were also obtained regarding current use of medications, presence of comorbidities (hypertension, diabetes mellitus, coronary artery disease, chronic obstructive pulmonary disease, cerebrovascular disease, chronic kidney disease, dyslipidemia, medication use, and others) and the presence of classical thrombotic risk factors, including the diagnosis of malignancy within previous 5 years, recent surgery or trauma within the previous 3 months, prolonged immobilization (fracture, plaster cast, hospitalization or bedridden at home > 3 days) within the previous 3 months, history of long air travel (≥ 4 hours) within the last 2 months, current pregnancy, post-partum state and current estrogen (oral contraceptive pills (OCPs) or hormone replacement therapy (HRT)) use. Unprovoked DVT was defined according to the conventional criteria, if it occurred in the absence of aforementioned classical risk factors. Recurrent DVT was defined as symptomatic, objectively-confirmed DVT at another location than the first DVT, or at the same location as the first DVT, in cases where the recurrence occurred after the initial event and recanalization of the initial thrombus was documented.
Laboratory assaysAll participants underwent serial measurement of CBC parameters, including red blood cell (RBC) count, hemoglobin, hematocrit, red cell indices, viz., red cell distribution width (RDW), mean corpuscular volume (MCV), mean hemoglobin concentration (MCH) and mean corpuscular hemoglobin concentration (MCHC), total leucocyte count (TLC) with differential leucocyte count, viz., absolute neutrophil count (ANC), absolute lymphocyte count (ALC) and absolute monocyte count (AMC) and platelet count and mean platelet volume (MPV) at baseline on the day of the study inclusion and then at approximately every 3 months for a period of 12 months. The CBC was performed from EDTA (ethylene diamine tetra acetic acid)-anticoagulated peripheral venous blood samples analyzed using an identical fully automated hematology analyzer (Celltac F MEK-8222 Hematology analyzer, by Nihon Kohden) within 4 hours of venipuncture. The C-reactive protein (CRP) was also measured at all time points by the standard method, using a hospital auto analyzer.
Statistical analysisThe normality of distribution for continuous variables was assessed using the Kolmogorov-Smirnov test. Continuous variables were expressed as median and interquartile range (IQR) and categorical variables, as frequency (n) and percentage (%). The significance of difference was analyzed using the Mann-Whitney U-test or Student's t-test for continuous variables and the Pearson's chi-squared (χ2) test or Fisher's exact test, for categorical values, as appropriate. For statistical purposes, hematological parameters were analyzed at baseline, at 3-month and at 12-month time points. The logistic regression analysis was used to calculate the odds ratios (OR) and corresponding 95% confidence interval (95%CI) as a measure of the association between hematological parameters and DVT. As the RDW was the only variable found to be significant (p < 0.05) in the univariate analysis, it was the only variable which was finally included in the multivariate analysis to assess its independent association with the DVT and adjusted for the following potential confounders: age, sex, BMI, smoking status, other hematologic parameters, including the RBC count, hemoglobin, hematocrit, platelet count and MPV, classical thrombotic risk factors (malignancy, surgery/trauma, immobilization, pregnancy/postpartum state and estrogen use), comorbidities (obesity, hypertension, diabetes mellitus, coronary artery disease, chronic obstructive pulmonary disease, cerebrovascular disease and chronic kidney disease) and CRP. The RDW was analyzed as a continuous, as well as a dichotomous, variable. The RDW was categorized into 2 groups to compare participants with a high RDW (> 14%) to those with a lower RDW (≤ 14%) and to use the lower RDW as the reference category. An RDW cut-off value of 14.0% was used in this study because it was the instrument-specific upper limit of the reference range (11.6% - 14.0%) at the laboratory our hospital routinely uses. The correlation analysis between the RDW and classical thrombotic risk factors at the baseline was performed using the Phi correlation coefficient. The Phi correlation coefficient is not a classic correlation between continuous variables. It is a measure of association between two binary variables (here, RDW > 14.0% and the presence of classic risk factors). A two-tailed p-value < 0.05 was considered as statistically significant. The statistical analysis was performed using the Statistical Package for Social Sciences (SPSS) software version 16.0 for Windows (Version 16.0 for Windows; SPSS Inc., Chicago, Illinois, USA).
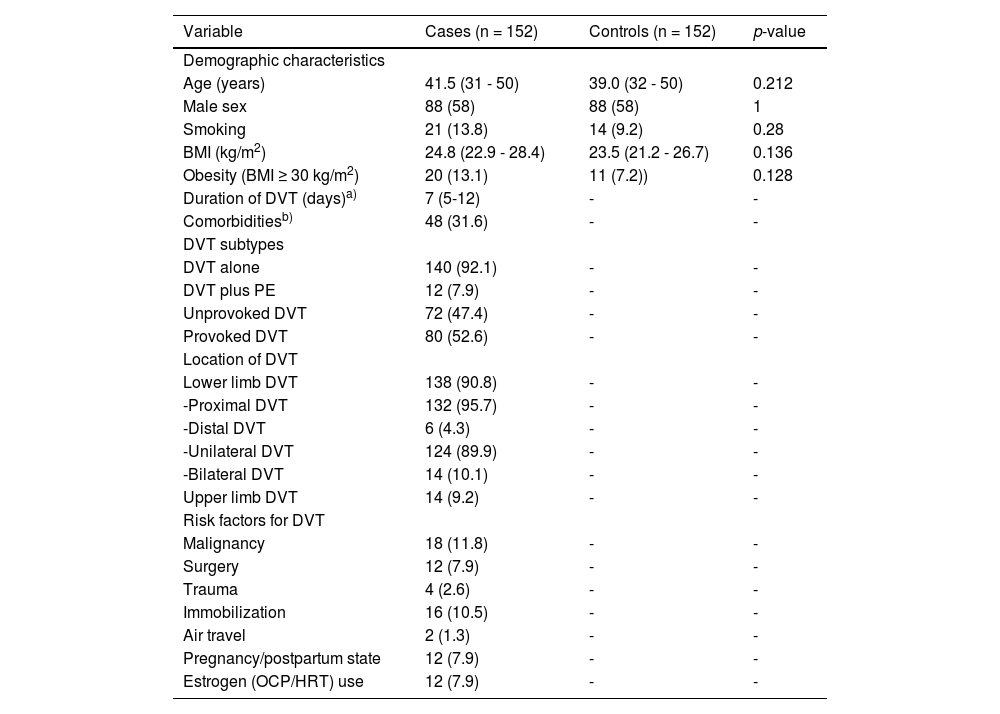
ResultsThe demographic and clinical characteristics of the study population at the baseline are depicted in Table 1. There was no significant difference between the two groups with regard to age, sex, BMI, frequency of obesity and smoking status (p > 0.05). The median duration (days) of DVT (interval between diagnosis and enrollment into the study) was 7 (IQR: 5 - 12).
Baseline clinical characteristics of the study population.
| Variable | Cases (n = 152) | Controls (n = 152) | p-value |
|---|---|---|---|
| Demographic characteristics | |||
| Age (years) | 41.5 (31 - 50) | 39.0 (32 - 50) | 0.212 |
| Male sex | 88 (58) | 88 (58) | 1 |
| Smoking | 21 (13.8) | 14 (9.2) | 0.28 |
| BMI (kg/m2) | 24.8 (22.9 - 28.4) | 23.5 (21.2 - 26.7) | 0.136 |
| Obesity (BMI ≥ 30 kg/m2) | 20 (13.1) | 11 (7.2)) | 0.128 |
| Duration of DVT (days)a) | 7 (5-12) | - | - |
| Comorbiditiesb) | 48 (31.6) | - | - |
| DVT subtypes | |||
| DVT alone | 140 (92.1) | - | - |
| DVT plus PE | 12 (7.9) | - | - |
| Unprovoked DVT | 72 (47.4) | - | - |
| Provoked DVT | 80 (52.6) | - | - |
| Location of DVT | |||
| Lower limb DVT | 138 (90.8) | - | - |
| -Proximal DVT | 132 (95.7) | - | - |
| -Distal DVT | 6 (4.3) | - | - |
| -Unilateral DVT | 124 (89.9) | - | - |
| -Bilateral DVT | 14 (10.1) | - | - |
| Upper limb DVT | 14 (9.2) | - | - |
| Risk factors for DVT | |||
| Malignancy | 18 (11.8) | - | - |
| Surgery | 12 (7.9) | - | - |
| Trauma | 4 (2.6) | - | - |
| Immobilization | 16 (10.5) | - | - |
| Air travel | 2 (1.3) | - | - |
| Pregnancy/postpartum state | 12 (7.9) | - | - |
| Estrogen (OCP/HRT) use | 12 (7.9) | - | - |
Abbreviations: BMI, body mass index; DVT, deep venous thrombosis; OCP, oral contraceptive pill; HRT, hormonal replacement therapy.
Data are expressed as median (interquartile range) or numbers (percentages).
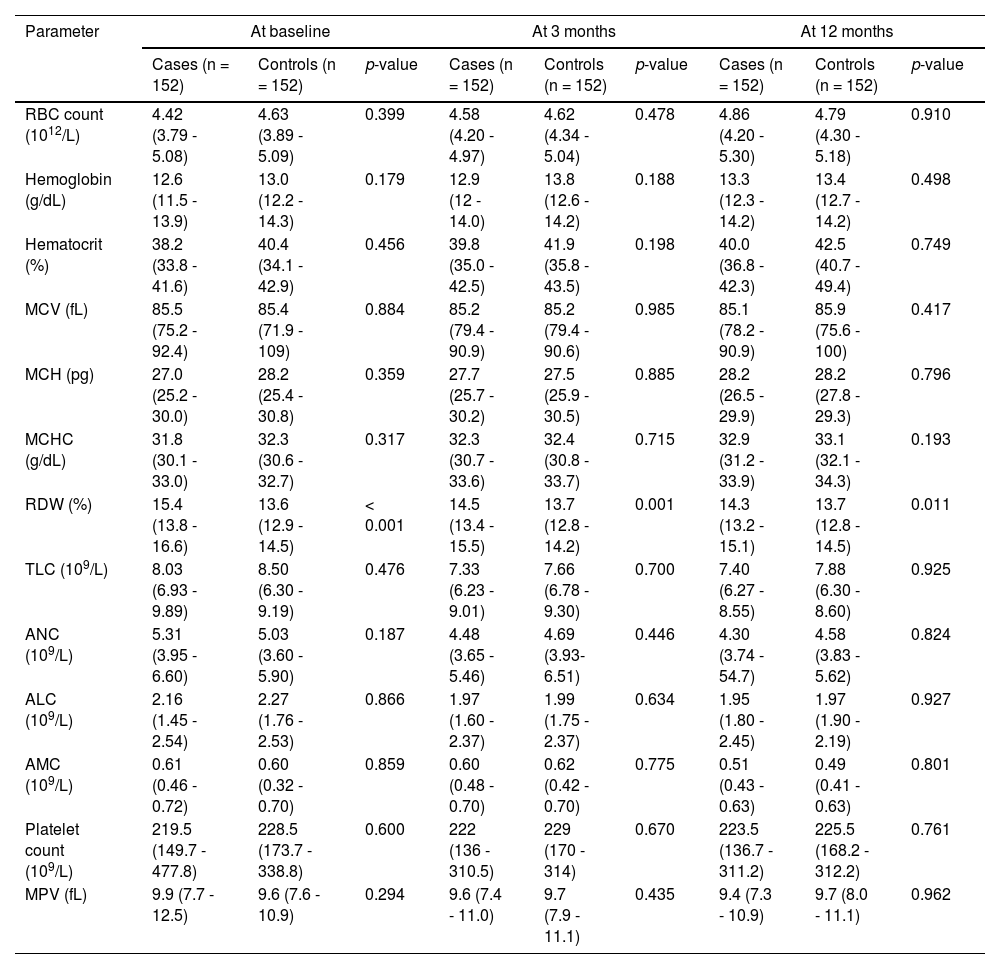
Hematological variables of the study population are summarized in Table 2. Both cases and controls were comparable with respect to the RBC count, hemoglobin, hematocrit, MCV, MCH and MCHC at the baseline and all subsequent time points (p > 0.05). However, the RDW was found to be significantly higher in cases, compared to controls, at all time points. No significant differences were evident between the case and control groups, concerning the TLC, ANC, ALC and AMC, at any time point (p > 0.05). Similarly, the platelet count and MPV did not reveal significant differences between the groups at any time point (p > 0.05).
Hematological parameters of the study population.
Abbreviations: RBC, red blood cell; MCV, mean corpuscular volume; MCH, mean hemoglobin concentration; MCHC, mean corpuscular hemoglobin concentration; RDW, red cell distribution width; TLC, total leucocyte count; ANC; absolute neutrophil count; ALC, absolute lymphocyte count; AMC, absolute monocyte count; MPV, mean platelet volume.
Data are expressed as median (interquartile range).
As the RDW was the only hematologic variable which expressed a statistically significant difference between cases and controls at all time points, we determined the percentage change in RDW levels (Δ%RDW) only. The median Δ%RDW (IQR) of cases vs. controls was 3.92 (0.78 - 7.86) vs. 1.37 (-1.60 - 2.52); p < 0.001 from baseline to 3 months, 0.45 (0.07 - 2.45) vs. 0.99 (-0.73 - 1.13); p = 0.677 from 3 months to 12 months, and 4.21 (1.17 - 7.92) vs. 1.45 (-0.98 - 2.63); p < 0.001 from baseline to 12 months.
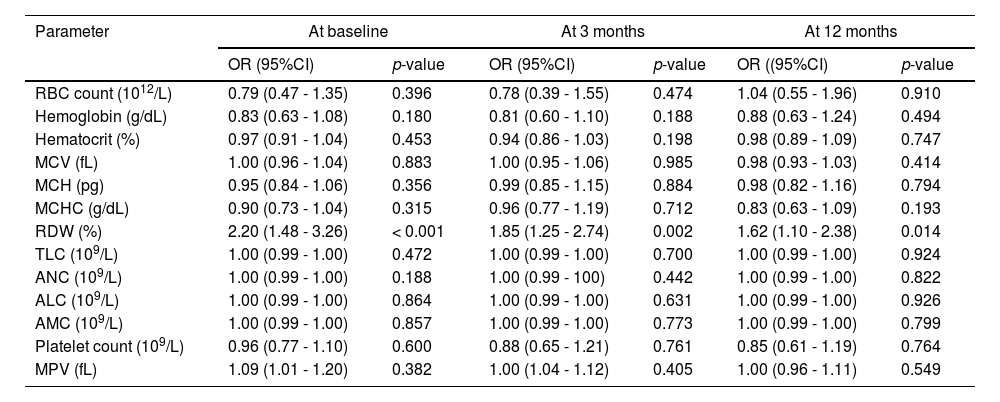
The association between hematological parameters and the DVT was analyzed with logistic regression method and results of the univariate analysis are shown in Table 3. The only hematologic variable which showed a statistically significant association with DVT at all time points was the RDW.
Association between hematological parameters and DVT in univariate logistic regression analysis.
Abbreviations: DVT, deep venous thrombosis; OR, odds ratio; CI, confidence interval; RBC, red blood cell; MCV, mean corpuscular volume; MCH, mean hemoglobin concentration; MCHC, mean corpuscular hemoglobin concentration; RDW, red cell distribution width; TLC, total leucocyte count; ANC; absolute neutrophil count; ALC, absolute lymphocyte count; AMC, absolute monocyte count; MPV, mean platelet volume.
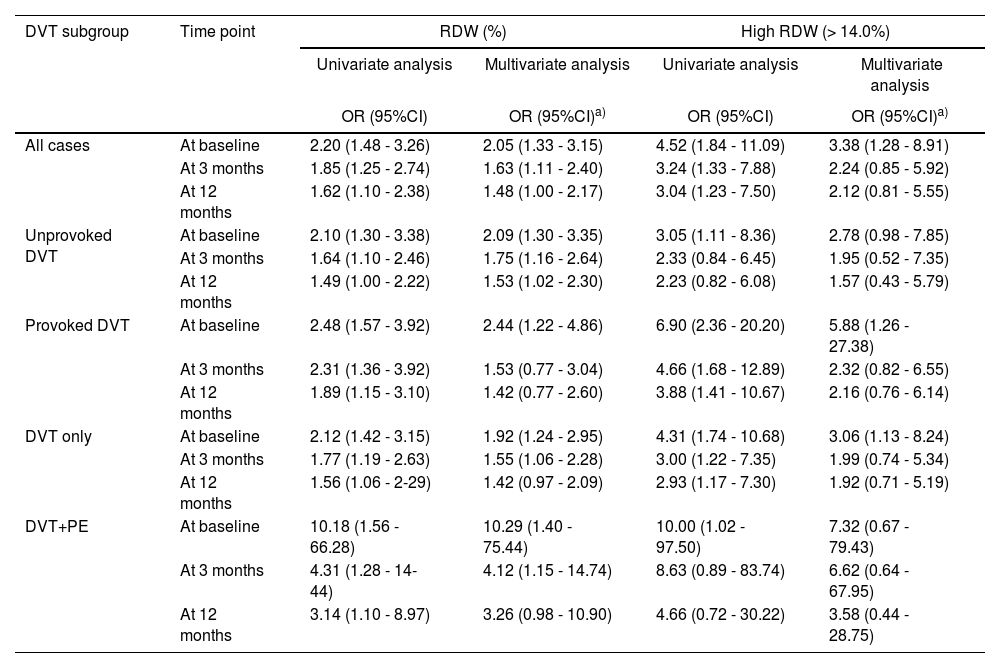
As the RDW was the only hematologic variable which exhibited a statistically significant association with the DVT in the univariate analysis, we focused on the RDW for further analyses. Results of the univariate and multivariate analyses of the RDW are presented in Table 4. The results obtained in the univariate analysis were not changed to any major degree in the multivariate analysis and the RDW showed an independent association with the DVT at all time points. Moreover, when the RDW was analyzed as a dichotomous variable, high RDW (> 14.0%) compared to lower RDW (≤ 14.0%), it even showed a strong and consistent association with the DVT in both univariate and multivariate analyses at all time points.
Association of RDW with DVT and its subgroups in univariate and multivariate regression analyses.
| DVT subgroup | Time point | RDW (%) | High RDW (> 14.0%) | ||
|---|---|---|---|---|---|
| Univariate analysis | Multivariate analysis | Univariate analysis | Multivariate analysis | ||
| OR (95%CI) | OR (95%CI)a) | OR (95%CI) | OR (95%CI)a) | ||
| All cases | At baseline | 2.20 (1.48 - 3.26) | 2.05 (1.33 - 3.15) | 4.52 (1.84 - 11.09) | 3.38 (1.28 - 8.91) |
| At 3 months | 1.85 (1.25 - 2.74) | 1.63 (1.11 - 2.40) | 3.24 (1.33 - 7.88) | 2.24 (0.85 - 5.92) | |
| At 12 months | 1.62 (1.10 - 2.38) | 1.48 (1.00 - 2.17) | 3.04 (1.23 - 7.50) | 2.12 (0.81 - 5.55) | |
| Unprovoked DVT | At baseline | 2.10 (1.30 - 3.38) | 2.09 (1.30 - 3.35) | 3.05 (1.11 - 8.36) | 2.78 (0.98 - 7.85) |
| At 3 months | 1.64 (1.10 - 2.46) | 1.75 (1.16 - 2.64) | 2.33 (0.84 - 6.45) | 1.95 (0.52 - 7.35) | |
| At 12 months | 1.49 (1.00 - 2.22) | 1.53 (1.02 - 2.30) | 2.23 (0.82 - 6.08) | 1.57 (0.43 - 5.79) | |
| Provoked DVT | At baseline | 2.48 (1.57 - 3.92) | 2.44 (1.22 - 4.86) | 6.90 (2.36 - 20.20) | 5.88 (1.26 - 27.38) |
| At 3 months | 2.31 (1.36 - 3.92) | 1.53 (0.77 - 3.04) | 4.66 (1.68 - 12.89) | 2.32 (0.82 - 6.55) | |
| At 12 months | 1.89 (1.15 - 3.10) | 1.42 (0.77 - 2.60) | 3.88 (1.41 - 10.67) | 2.16 (0.76 - 6.14) | |
| DVT only | At baseline | 2.12 (1.42 - 3.15) | 1.92 (1.24 - 2.95) | 4.31 (1.74 - 10.68) | 3.06 (1.13 - 8.24) |
| At 3 months | 1.77 (1.19 - 2.63) | 1.55 (1.06 - 2.28) | 3.00 (1.22 - 7.35) | 1.99 (0.74 - 5.34) | |
| At 12 months | 1.56 (1.06 - 2-29) | 1.42 (0.97 - 2.09) | 2.93 (1.17 - 7.30) | 1.92 (0.71 - 5.19) | |
| DVT+PE | At baseline | 10.18 (1.56 - 66.28) | 10.29 (1.40 - 75.44) | 10.00 (1.02 - 97.50) | 7.32 (0.67 - 79.43) |
| At 3 months | 4.31 (1.28 - 14-44) | 4.12 (1.15 - 14.74) | 8.63 (0.89 - 83.74) | 6.62 (0.64 - 67.95) | |
| At 12 months | 3.14 (1.10 - 8.97) | 3.26 (0.98 - 10.90) | 4.66 (0.72 - 30.22) | 3.58 (0.44 - 28.75) | |
Abbreviations: RDW, red cell distribution width; DVT, deep venous thrombosis; PE, pulmonary embolism; OR, odds ratio; CI, confidence interval.
adjusted for age, sex, body mass index, smoking status, red blood cell count, hemoglobin, hematocrit, platelet count, mean platelet volume, classical thrombotic risk factors (malignancy, surgery/trauma, immobilization, pregnancy/postpartum state and estrogen use), comorbidities (obesity, hypertension, diabetes mellitus, coronary artery disease, chronic obstructive pulmonary disease, cerebrovascular disease and chronic kidney disease) and C-reactive protein.
When subgroup analysis was performed, the RDW continued to be associated with all subgroups of the DVT, classified according to the etiology and severity of the event, i.e., unprovoked DVT, provoked DVT, DVT alone and DVT plus PE in both univariate and multivariate analyses at all time points, exhibiting even higher odds ratios for high RDW (> 14.0%), compared to lower RDW (≤ 14.0%). Interestingly, the association between high RDW (> 14.0%) and the DVT at the baseline was found to be nearly 2-fold for provoked DVT, compared to unprovoked DVT, and also for DVT plus PE, compared to DVT alone, in both univariate and multivariate analyses (Table 4).
During the 12 months of the follow-up period after the initial event, 10 (6.6%) patients (8 with unprovoked and 2 with provoked incident DVT) experienced a recurrent DVT at different time intervals. Three patients among these were on anticoagulation at the time of recurrence. Interestingly, a significantly higher RDW (IQR) (%) was found at the baseline in patients who developed recurrent DVT during the follow-up than in patients without recurrence of DVT (16.7 [15.2 – 17.1] vs. 15.2 [13.6 – 16.4]; p < 0.001). Patients with high RDW (> 14.0%), compared to lower RDW (≤ 14.0%), at the baseline had a 2.3-fold increased association with the recurrence of DVT during the 12-month follow-up.
The median RDW (IQR) (%) at the baseline was 16.4 (15.4 - 16.9) vs. 15.1 (13.7 - 16.4); p < 0.05, 15.8 (14.9 - 16.3) vs. 15.1 (13.7 - 16.1); p > 0.05, 15.7 (15.4 - 15.9) vs. 15.3 (13.7 - 16.1); p > 0.05, 15.5 (14.8 - 15.9) vs. 15.4 (13.5 - 16.0); p > 0.05, 15.5 (14.0 - 16.2) vs. 15.4 (13.8 - 16.5); p > 0.05, 15.5 (14.3 - 16.0) vs. 15.4 (13.7 - 16.2); p > 0.05 and 15.9 (15.8 - 16.1) vs. 15.3 (13.7 - 16.4); p > 0.05 in patients with vs. without malignancy, surgery, trauma, pregnancy/postpartum state, immobilization, estrogen use and air travel, respectively.
A weak, but statistically significant positive correlation (r = 0.360; p = 0.001), has been shown at the baseline between high RDW and malignancy, while a negligible and statistically insignificant correlation was found between high RDW and other classic thrombotic risk factors (Table 5).
Correlation between high RDW (> 14.0%) and classic risk factors of DVT at baseline.
| Classical risk factor | Correlation Coefficient (r)a) | p-value |
|---|---|---|
| Malignancy | 0.360 | 0.001 |
| Surgery | 0.149 | 0.198 |
| Trauma | 0.101 | 0.375 |
| Pregnancy/postpartum state | 0.180 | 0.114 |
| Immobilization | 0.031 | 0.790 |
| Air travel | 0.103 | 0.367 |
| Estrogen use | 0.019 | 0.871 |
Abbreviations: RDW, red cell distribution width; DVT, deep venous thrombosis.
Note: The Phi correlation coefficient is not a classic correlation between continuous variables. It is a measure of association between two binary variables (here, RDW > 14.0% and presence of classic risk factors).
In the present case-control observational study, we demonstrated that the RDW was the only hematologic variable which showed a statistically significant association with the DVT. High RDW (> 14.0%) at the baseline was associated with the presence of DVT, independently of several potential confounders, including clinical and other hematological variables. Our results confirm and extend what has been reported previously in several studies, including small retrospective case-control studies,12,15,17 a large population-based case-control study13 and large population-based cohort studies,14,16 which showed a graded and significant independent association between the RDW and the presence of DVT. In addition, this association remained consistently strong as the strength of the association was not much attenuated when further analyses of the RDW were performed at 3 months and 12 months after the initial DVT event. To the best of our knowledge, this is the first study to report an association between the DVT and serial values of the RDW at different time points after the initial DVT event. In the majority of previous case-control studies, blood samples were collected only once after the thrombotic event, which did not allow for an analysis of potential changes in the RDW over time, and it was unclear whether high RDW (anisocytosis) was an actual risk factor or a consequence of the thrombotic event itself due to the accompanying prolonged inflammatory response, which is known to influence the RDW. In previous population-based cohort studies, the RDW was measured only at the baseline long before the thrombotic event, so it was not known whether results would be different if the RDW was measured during the acute phase. Likewise, RDW values might have fluctuated during the relatively long follow-up before occurrence of the thrombotic event and such fluctuations would tend to change the observed associations with the VTE. At variance with previous studies, our study measured the RDW at the baseline during the acute event and also serially thereafter at approximately every 3-month intervals for 12 months. Furthermore, the Δ%RDW was significantly higher in cases, compared to controls (p < 0.001), from the baseline to 3 months and from the baseline to 12 months, but not from 3 months to 12 months (p > 0.05). This finding indicated that that the association between the RDW and DVT was not much influenced by time after the thrombotic event and persisted even after the acute phase of the DVT had subsided. We were therefore able to rule out the possibility that the association between high RDW and the DVT was only due to the consequence of the thrombotic event itself, suggesting a possible causal relationship between high RDW and the DVT.
Moreover, when we performed the subgroup analysis, the RDW continued to be associated with all the different subgroups of the DVT, similar to other previous studies.13,15-17 Interestingly, we found a stronger association in patients with provoked DVT than unprovoked DVT, as well as in those with DVT plus PE, than in the DVT alone. Our findings are partly consistent with a previous study performed by Lippi et al., which showed that the association of increased RDW was greater in patients with provoked DVT and PE than in those with unprovoked thrombosis, both in unadjusted analysis.17 Ertop et al. found a significantly higher RDW in provoked VTE, compared to unprovoked VTE (p < 0.001), and showed that high RDW levels were related to both provoked and unprovoked VTE, but more significant in provoked VTE.18 Several studies showed that increased RDW levels were seen in cardiovascular disease and heart failure, stroke, chronic renal insufficiency, systemic inflammation, chronic obstructive pulmonary disease, malignancies, peripheral artery disease, pulmonary arterial hypertension and with diabetes-associated complications.18,19 The vast majority of these risk factors have been associated with provoked VTE. The patients who have these diseases, in addition to the effect of VTE itself, have some risk factors that also lead to an elevated RDW. In unprovoked VTE, elevation of the RDW could be caused mainly by the VTE itself, whereas in provoked VTE, the elevated RDW might not only be due to the VTE itself, but also to other concomitant risk factors, and this coexistence could have a synergy and elevate RDW levels more than expected.19
Furthermore, in our study, we found that the high RDW was associated with an increased risk of recurrence of DVT during the 12-month follow-up after the initial event. To the best of our knowledge, this is the second study to explore an association between the RDW and recurrent DVT in patients with the first episode of DVT. A large population-based cohort study performed by Ellingsen et al. was the first to investigate the impact of the RDW on the risk of recurrent VTE after incident VTE in a general population. The VTE patients were followed on average for 4.4 years after the initial event and they found that the RDW was not associated with the risk of VTE recurrence during the first year after the initial event.16 Other previous studies had not consisted of long-term follow-up of DVT patients to examine the effect of the RDW on the recurrence of DVT. Our study was probably underpowered to evaluate this association in view of the small number of events. Further large population-based and prospective studies with long follow-ups are required to confirm this association. It was also intriguing that the recurrent DVT, which occurred mainly in patients with unprovoked DVT (8 out of 10 events), had a higher RDW at the baseline, while at the same time, the provoked DVT had a higher RDW than unprovoked DVT. This could be due to a statistical artefact, or in other words, an unwanted consequence of a very low sample size in this subgroup analysis.
Additionally, in the current study, we found a negligible and statistically insignificant positive correlation between the high RDW and all classic thrombotic risk factors, except malignancy, which also showed a weak, although statistically significant, positive correlation. To our knowledge, this is the first study to investigate the correlation between the high RDW and various classic thrombotic risk factors.
We did not observe a statistically significant association between other CBC parameters and DVT. Various previous studies revealed contradictory results. Compatible with our study, Warny et al.20 did not observe a statistically significant independent association between the hematocrit and VTE. Braekkan et al. failed to exhibit an association between the DVT and MCV.21 Rezende et al. failed to show an association of the TLC, ANC and ALC with the DVT.13 Folsom et al. was not able to show a significant association between the platelet count and VTE.22 In contrast to our findings, other previous studies reported that the DVT was associated with a high RBC count,21 high hemoglobin level,22 high hematocrit level,21,22 high MCV,13 high MCH13 and high AMC.13
Study limitationsThere were many potential limitations in our study. First, our study had a relatively small sample size with low numbers of cases within the DVT plus PE and recurrent DVT subgroups, so we could not perform the subgroup analysis with a high statistical power in these subgroups. Future large population-based and multicenter prospective studies with long follow-ups are required to confirm our results. Second, as our study had the case-control design, in which blood samples were collected after the thrombotic event and the baseline RDW was measured shortly after the VTE, we could not rule out the possibility that our results suffered by reverse causation, a process in which the consequences of an event are mistaken as the causes. However, since blood samples were also collected at approximately every 3 months for a period of 12 months after the thrombotic event, it is unlikely that the reverse causation played an important role in our findings. Finally, although age and gender of both case and control groups were matched, the smoking profile, BMI values and presence of various comorbidities were not matched between both groups. As these potential confounders could influence hematologic parameters with a large impact on the RDW, and chronic diseases could lead to provoked VTE, we expect selection bias in this study. However, these variables were included in multivariable analyses and were adjusted.
ConclusionsIn this study, we evaluated the association between serial values of hematologic variables and the DVT. We demonstrated an independent and consistent association of high RDW with the first episode of DVT in adult patients. However, further investigations are needed to clarify a possible causal relationship between high RDW and the DVT, as reverse causation was a possibility. The study was probably underpowered to evaluate the association between high RDW and recurrent DVT in view of the small number of events. Further large population-based and prospective studies with long follow-ups are needed to investigate this association. Other hematologic parameters were not associated with the DVT.
Authorship contributionsRS, MM and GRP substantially contributed to the research design; GRP performed the study acquisition; GRP and SA analyzed the data and wrote the paper, and; RS, MM, GRP and SA critically revised and approved the final manuscript.
The authors would like to acknowledge the cooperation from all the subjects who were enrolled in this study.


