


Blood component transfusions are a common and often necessary medical practice during the epidemics of dengue. Transfusions are required for patients when they developed severe dengue fever or thrombocytopenia of 10×109/L or less. This study therefore investigated the risk factors, performance and effectiveness of eight different machine-learning algorithms to predict blood component transfusion requirements in confirmed dengue cases admitted to hospital. The objective was to study the risk factors that can help to predict blood component transfusion needs.
MethodsEight predictive models were developed based on retrospective data from a private group of hospitals in India. A python package SHAP (SHapley Additive exPlanations) was used to explain the output of the “XGBoost” model.
ResultsSixteen vital variables were finally selected as having the most significant effects on blood component transfusion prediction. The XGBoost model presented significantly better predictive performance (area under the curve: 0.793; 95 % confidence interval: 0.699–0.795) than the other models.
ConclusionPredictive modelling techniques can be utilized to streamline blood component preparation procedures and can help in the triage of high-risk patients and readiness of caregivers to provide blood component transfusions when required. This study demonstrates the potential of multilayer algorithms to reasonably predict any blood component transfusion needs which may help healthcare providers make more informed decisions regarding patient care.
Dengue fever, with an impact on adults, children, and newborns, has become the fastest growing mosquito-borne disease in the world.1 According to an estimation of the World Health Organization (WHO), nearly 400 million infections occur in 128 nations in Asia, Oceania, America, and Africa annually. Reports suggest dengue transmission is currently a risk for roughly half of the world's population.1 Dengue fever is hyperendemic in India with the epidemiology changing dramatically over time; the country currently is experiencing its worst dengue crisis. Fourteen Indian states have notifiable dengue fever, while 29 states have it as an endemic disease.2 Based on data from the National Vector Borne Disease Control Programme (NVBDCP)3 and the National Health Profile 2018,4 in 2017, the cases of dengue increased to the highest level in ten years. The number of cases increased by more than 300 percent from 60,000 in 2009 to 188,401 in 2017. According to the NVBDCP, there has been a significant increase of more than 250 % from the 75,808 cases in 2013.3 Certain union territories and states are experiencing hyperendemic conditions due to the increase in outbreaks.5 Over 15,000 dengue infections were confirmed in Delhi in 2015, the worst outbreak since 2006.6 India estimated an overall cost of US$5.71 billion for dengue in 2016 as compared to a US$1.51 billion estimate in 2013.7
Bleeding, the cause of death in many severe dengue fever cases, is one of the most serious effects of dengue.8 Clinical signs and symptoms are highly variable; Patients may exhibit from petechiae or purpura to severe bleeding such as from the gastrointestinal tract, puncture sites or intracranial haemorrhage. There is no known cause for bleeding. These signs and symptoms are highly variable; a coagulation profile with abnormalities does not always correlate with the clinical manifestation of bleeding. Several healthcare professionals observed that the severity of thrombocytopenia does not reliably predict bleeding.9,10
Blood components are transfused to these patients to prevent bleeding complications. Kaufman et al.11 recommended transfusing patients with a platelet count of 10×109/L or less to reduce the chances of spontaneous bleeding. However, the WHO has issued a set of guidelines regarding the treatment as there is significant concern about the inappropriate use of blood components during Dengue infection.12 Furthermore, the proper identification of patients requiring blood component transfusions may help blood suppliers to improve hospital blood supply.13 By providing too much blood or too little blood is either costly and unnecessary or it might be dangerous to the patient's health. Therefore, a prediction of blood component transfusion needs could help blood providers economize their supply chains.14
Huang et al.15 developed and validated prognostic models for severe dengue prediction using machine-learning techniques with logistic regression showing the best performance. Pinto et al.16 conducted a retrospective cohort analysis and found that age over 55 and specific clinical manifestations, such as gastrointestinal bleeding, haematuria, and low platelet count, had a significant impact on death from severe dengue. Jain et al.17 developed a clinical risk score for predicting mortality in dengue patients using age, sensorium, and dyspnoea as significant factors in a prospective observational study.
Several studies 18-22 have used machine-learning techniques to predict blood transfusions for other diseases. Although many studies have examined factors related to patient characteristics in order to diagnose dengue, very few studies21,22 have evaluated multimodel prediction based on machine learning in large cohorts.
Therefore, this study focuses on applying machine learning to create a model using a test dataset. Supervised machine-learning models were employed to analyse the impact of each variable and a prediction model was developed to give a reference to facilitate clinical decisions of medical professionals in relation to blood component transfusions.
MethodsPatient population descriptionThis retrospective multicentric study with one cohort accessed electronic health records of a network of seven hospitals in India for all confirmed dengue patients (with the NS-1 antigen test or serologically confirmed dengue infection) admitted during the study period from February 2012 to September 2017. All multiday stay inpatients, including emergency and elective, who were at least one year old were included in the study. A case was excluded if the patient had a negative result for dengue or serology for febrile illness and in cases of insufficient data.
The data included the demographic profile of patients, administrative characteristics, laboratory parameters and radiological parameters. A total of 1360 patients with disease-related diagnoses of dengue were admitted to this hospital network. The study was reviewed and approved by the institutional healthcare ethics committee. The standard WHO definitions were used to classify suspected dengue infection.23 Two methods were used to confirm infection:
- 1.
An NS-1 antigen test (Panbio Dengue Early ELISA, Standard Diagnostics Inc., Republic of Korea) was performed if the patient presented within five days after the onset of the symptoms.
- 2.
A test for dengue immunoglobulin M (IgM) serum (NIVDEN Immunoglobulin [IgM] Capture ELISA, National Institute of Virology, Pune, India) was performed when the patient presented more than five days after the onset of the symptoms.
Data for the study was extracted from the hospital digital information systems. Data was retrieved sequentially, beginning with the demographics of confirmed dengue patients. Subsequently, diagnostic investigations, administrative and clinical information was extracted. However, 212 cases were excluded from the study due to unavailability of complete datasets.
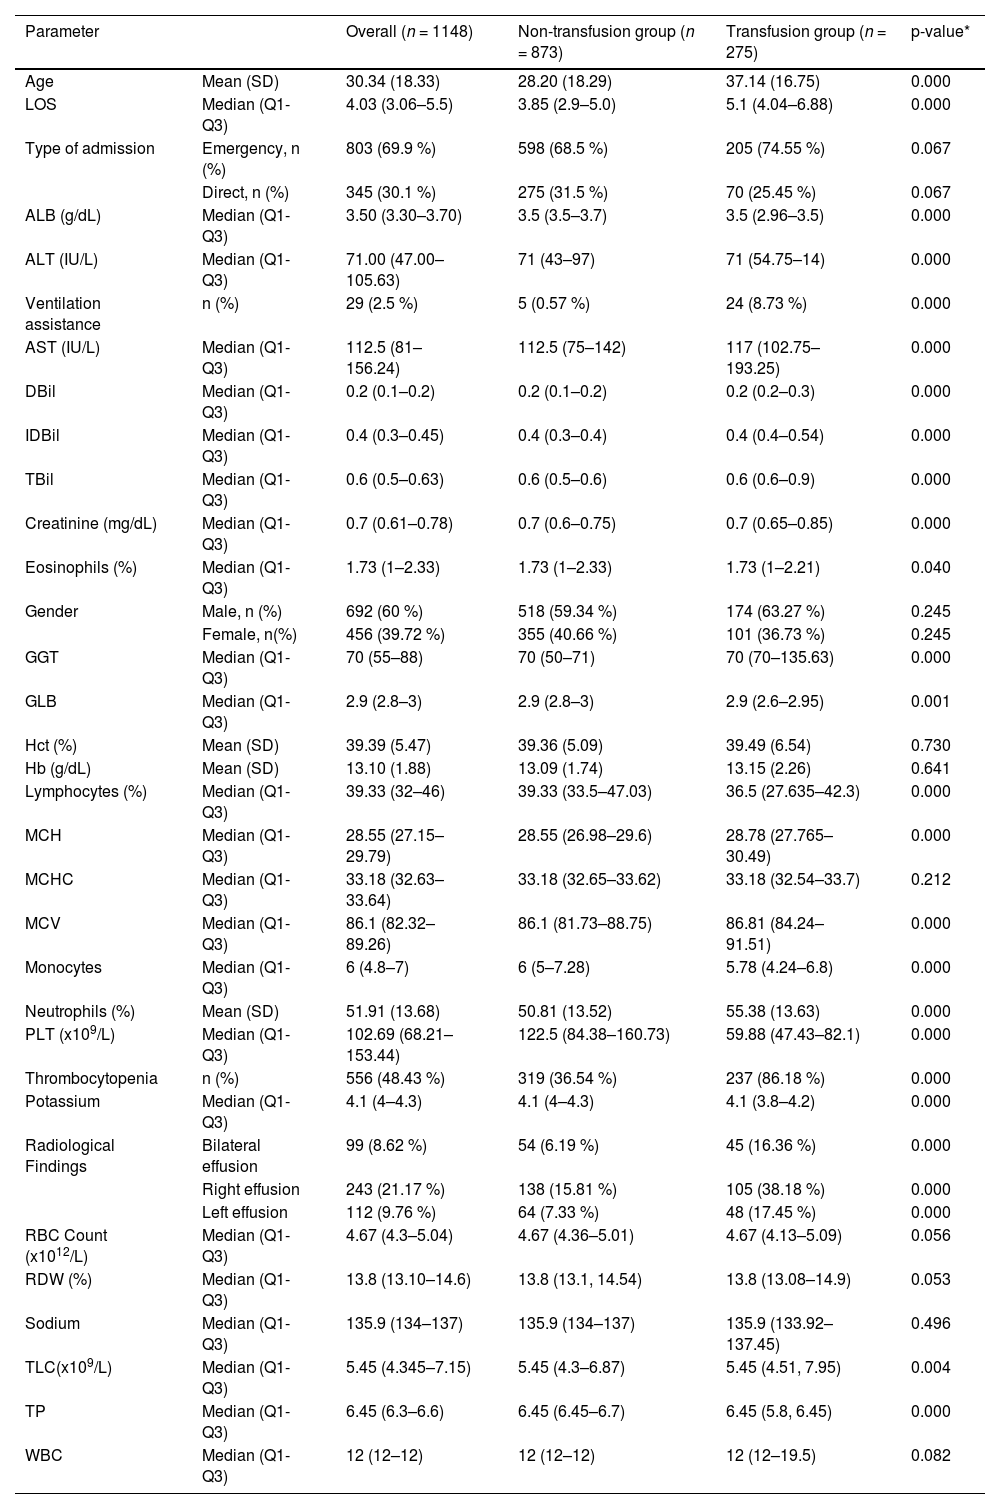
Initially, based on the aggregate data of discharged dengue patients, forty candidate risk factors such as age, gender, type of admission, ventilation assistance, laboratory, and radiological characteristics were included. The means, medians, percentages, and lower and upper quartiles of the features are given in Table 1.
Characteristics of the study population of 1148 patients comparing the non-transfusion and transfusion groups.
| Parameter | Overall (n = 1148) | Non-transfusion group (n = 873) | Transfusion group (n = 275) | p-value* | |
|---|---|---|---|---|---|
| Age | Mean (SD) | 30.34 (18.33) | 28.20 (18.29) | 37.14 (16.75) | 0.000 |
| LOS | Median (Q1-Q3) | 4.03 (3.06–5.5) | 3.85 (2.9–5.0) | 5.1 (4.04–6.88) | 0.000 |
| Type of admission | Emergency, n (%) | 803 (69.9 %) | 598 (68.5 %) | 205 (74.55 %) | 0.067 |
| Direct, n (%) | 345 (30.1 %) | 275 (31.5 %) | 70 (25.45 %) | 0.067 | |
| ALB (g/dL) | Median (Q1-Q3) | 3.50 (3.30–3.70) | 3.5 (3.5–3.7) | 3.5 (2.96–3.5) | 0.000 |
| ALT (IU/L) | Median (Q1-Q3) | 71.00 (47.00–105.63) | 71 (43–97) | 71 (54.75–14) | 0.000 |
| Ventilation assistance | n (%) | 29 (2.5 %) | 5 (0.57 %) | 24 (8.73 %) | 0.000 |
| AST (IU/L) | Median (Q1-Q3) | 112.5 (81–156.24) | 112.5 (75–142) | 117 (102.75–193.25) | 0.000 |
| DBil | Median (Q1-Q3) | 0.2 (0.1–0.2) | 0.2 (0.1–0.2) | 0.2 (0.2–0.3) | 0.000 |
| IDBil | Median (Q1-Q3) | 0.4 (0.3–0.45) | 0.4 (0.3–0.4) | 0.4 (0.4–0.54) | 0.000 |
| TBil | Median (Q1-Q3) | 0.6 (0.5–0.63) | 0.6 (0.5–0.6) | 0.6 (0.6–0.9) | 0.000 |
| Creatinine (mg/dL) | Median (Q1-Q3) | 0.7 (0.61–0.78) | 0.7 (0.6–0.75) | 0.7 (0.65–0.85) | 0.000 |
| Eosinophils (%) | Median (Q1-Q3) | 1.73 (1–2.33) | 1.73 (1–2.33) | 1.73 (1–2.21) | 0.040 |
| Gender | Male, n (%) | 692 (60 %) | 518 (59.34 %) | 174 (63.27 %) | 0.245 |
| Female, n(%) | 456 (39.72 %) | 355 (40.66 %) | 101 (36.73 %) | 0.245 | |
| GGT | Median (Q1-Q3) | 70 (55–88) | 70 (50–71) | 70 (70–135.63) | 0.000 |
| GLB | Median (Q1-Q3) | 2.9 (2.8–3) | 2.9 (2.8–3) | 2.9 (2.6–2.95) | 0.001 |
| Hct (%) | Mean (SD) | 39.39 (5.47) | 39.36 (5.09) | 39.49 (6.54) | 0.730 |
| Hb (g/dL) | Mean (SD) | 13.10 (1.88) | 13.09 (1.74) | 13.15 (2.26) | 0.641 |
| Lymphocytes (%) | Median (Q1-Q3) | 39.33 (32–46) | 39.33 (33.5–47.03) | 36.5 (27.635–42.3) | 0.000 |
| MCH | Median (Q1-Q3) | 28.55 (27.15–29.79) | 28.55 (26.98–29.6) | 28.78 (27.765–30.49) | 0.000 |
| MCHC | Median (Q1-Q3) | 33.18 (32.63–33.64) | 33.18 (32.65–33.62) | 33.18 (32.54–33.7) | 0.212 |
| MCV | Median (Q1-Q3) | 86.1 (82.32–89.26) | 86.1 (81.73–88.75) | 86.81 (84.24–91.51) | 0.000 |
| Monocytes | Median (Q1-Q3) | 6 (4.8–7) | 6 (5–7.28) | 5.78 (4.24–6.8) | 0.000 |
| Neutrophils (%) | Mean (SD) | 51.91 (13.68) | 50.81 (13.52) | 55.38 (13.63) | 0.000 |
| PLT (x109/L) | Median (Q1-Q3) | 102.69 (68.21–153.44) | 122.5 (84.38–160.73) | 59.88 (47.43–82.1) | 0.000 |
| Thrombocytopenia | n (%) | 556 (48.43 %) | 319 (36.54 %) | 237 (86.18 %) | 0.000 |
| Potassium | Median (Q1-Q3) | 4.1 (4–4.3) | 4.1 (4–4.3) | 4.1 (3.8–4.2) | 0.000 |
| Radiological Findings | Bilateral effusion | 99 (8.62 %) | 54 (6.19 %) | 45 (16.36 %) | 0.000 |
| Right effusion | 243 (21.17 %) | 138 (15.81 %) | 105 (38.18 %) | 0.000 | |
| Left effusion | 112 (9.76 %) | 64 (7.33 %) | 48 (17.45 %) | 0.000 | |
| RBC Count (x1012/L) | Median (Q1-Q3) | 4.67 (4.3–5.04) | 4.67 (4.36–5.01) | 4.67 (4.13–5.09) | 0.056 |
| RDW (%) | Median (Q1-Q3) | 13.8 (13.10–14.6) | 13.8 (13.1, 14.54) | 13.8 (13.08–14.9) | 0.053 |
| Sodium | Median (Q1-Q3) | 135.9 (134–137) | 135.9 (134–137) | 135.9 (133.92–137.45) | 0.496 |
| TLC(x109/L) | Median (Q1-Q3) | 5.45 (4.345–7.15) | 5.45 (4.3–6.87) | 5.45 (4.51, 7.95) | 0.004 |
| TP | Median (Q1-Q3) | 6.45 (6.3–6.6) | 6.45 (6.45–6.7) | 6.45 (5.8, 6.45) | 0.000 |
| WBC | Median (Q1-Q3) | 12 (12–12) | 12 (12–12) | 12 (12–19.5) | 0.082 |
ALB: albumin; ALT: alanine aminotransferase; AST: aspartate aminotransferase; DBil: direct bilirubin; GLB: globulin; Hb: haemoglobin; Hct: haematocrit; IDBil: indirect bilirubin; PLT: platelet; RBC: red blood cell count; RDW: red cell distribution width; TLC: total leucocyte count; TP: total protein; TBil: total bilirubin. Categorical variables are summarized as n (%), Continuous variables are presented as mean ± SD or median (range) if SD>50 % of the mean.
The final dataset included 1148 patients for further analysis. Demographic and clinical data were recorded in a template pro-forma upon admission, whereas lab related findings were collected on daily basis until discharge or death. The dataset includes features with continuous and categorical values for demographic, administrative, laboratory, and radiological data. New fields were created based on existing features as shown in Table 1 of the Supplementary material. These features are transformed to binary features to improve the interpretation.
All the transfused blood components (red blood cells, plasma, cryoprecipitate, or platelets) were considered based on the research question and data availability and the need for any component (binary outcome) was chosen as a classification target. The eight state-of-the-art machine-learning methods Adaboost, ExtraTrees, gradient boosting decision tree (GDBT), k-nearest neighbour (KNN), logistic regression (LR), multilayer perceptron (MLP), random forests (RFs), and extremely gradient boosting (XGBoost) were considered in the classification of blood component needs (transfusion vs. non-transfusion).
Data pre-processingData cleansing and pre-processing are essential to achieve optimal results. The following steps were taken to prepare and clean the data:
- 1.
Redundant records and fields that had more than 50 % of their data missing were eliminated.
- 2.
Following that, all categorical features were one-hot encoded. A popular encoding method is one-hot encoding. It works by making a new variable for each categorical variable present in the feature by assigning a 1 or 0 to indicate the presence or absence of the category in the data.
- 3.
The final data set had 389 columns.
- 4.
Missing values in patient data are quite common in medical environments. Details for missing data handling are discussed in a later section.
Feature engineering is an important task in data preparation, but it is also a time-consuming component of machine-learning applications.24 Initially, Forty predictors were collected using the aggregate data of discharged patients, which included demographics, administrative, lab test results, and radiology related variables and subsequently new features were derived from these variables. The institution's standard lab reference ranges were used for laboratory data with features being coded based on whether they were below, within or above the reference range (Supplementary material Table 1) and other features were categorized into binary variables. Following the feature engineering process; one dependant and 389 independent features were identified. Supplementary material Table 1 presents a summary of the feature engineering techniques.
Missing value handlingThe techniques used by Ansari et al.25, Hachesu, et al.26 and Azari, et al.27 were used to handle missing values in this study. Features with more than 50 % of records of missing values were removed from the dataset; commonly these included prothrombin time, activated partial thromboplastin time, and basophil count (Table 1). The mean or median was used for continuous features and regression was used for nominal or ordinal type features with missing values below 50 %.
Feature selectionVariables for the blood component transfusion prediction model were selected following reviews of previous research on predicting and/or administering transfusion to dengue patients.21,22 Subsequently, these variables were reviewed by experts to ensure that relevant variables were being used as predictors. The voted method was used for feature selection (for details see Supplementary material) to select significant variables. This method applies a variety of techniques to select features. A vote is given when an algorithm selects a feature. In the end, this method calculates the total votes for each feature and then picks out the best ones based on votes with the selected feature being used to develop the machine-learning models.
Training and test data setsAfter cleansing and pre-processing, 1148 complete records were extracted and obtained for classification tasks. A crucial step in assessing the effectiveness of data mining models is dividing the data into training and testing sets. In this study, the dataset was randomly split into training and testing datasets. Seventy percent of the data was used to train our models, while 30 % was used as a testing set. Five-fold cross validation was performed on the training set to tune the hyperparameter of the models. In the training set, 23.4 % patients received blood component transfusions during their hospital stay and in the testing set, 25.2 % patients received blood component transfusions.
Binary classification modelsAdaBoost28 is a machine-learning approach based on the idea of combining many relatively weak and inaccurate prediction rules to create a highly accurate prediction rule. AdaBoost, like all ensemble methods, works by generating a set of classifiers and then voting on them to classify test examples. The ExtraTrees algorithm29 is a supervised learning method for classification that works by training a number of randomized decision trees (also known as extra-trees) on different sub-samples of the data and then averaging them to enhance the predictive accuracy and control over-fitting. The GBDT algorithm30,31 is a popular machine-learning technique that involves implementing several models and aggregating their results. The KNN32 algorithm is a simple non-parametric, supervised machine-learning technique. It stores all the available data and a new data point is classified by searching for the K most similar data points (the neighbours) across the entire training dataset and then these K data points are summarized as the outcome variable. LR33 is a nonlinear regression model, where the target variable is binary. It solves binary classification problems by utilizing a linear combination of input data. Additionally it can predict the probability value between 0 and 1 of an event by fitting data objects in a logistic function. MLP34 is the classical type of neural network algorithm comprising of one or more layers of neurons. It is often applied to supervised learning problems: it learns to model the correlation between inputs and outputs by training on a set of input-output pairs. Training of the model involves adjusting the parameters, or the weights and biases, in order to minimize error. RF35 is an ensemble of multiple decision trees. Each non-leaf node in a decision tree represents a test on a feature, each branch denotes a test output, and each leaf node holds an outcome label. Not only is RF fast, easy to implement, and produces precise predictions, but it can also manage a large number of independent variables without overfitting.36 XGBoost37 is a widely used and highly effective decision-tree-based ensemble machine-learning algorithm that employs a gradient boosting framework. It implements several models and aggregates the results.
Evaluation measuresThe dataset was randomly split into two groups, a training and a testing set. The training set of 803 (70 %) patients was used to create the models, while the testing set of 345 (30 %) patients was used to test the models. The bootstrap method was applied 1000 times to the internal validation set in order to determine the confidence interval (CI) for the area under the curve (AUC), accuracy, sensitivity, specificity, positive (PPV) and negative (NPV) predictive values, and F1-score. Discrimination was evaluated using area under the receiver operating characteristic curve (AUROC)38 of predicted probabilities in dengue patients for both transfusion and non-transfusion groups. The calibration of the predictive model was assessed using a calibration curve.
In the initial data analysis, independent continuous variables between transfused and non-transfused groups were compared either using the Student t-test or Mann-Whitney U test as considered suitable. Either chi-square test or Fisher's exact test was used to examine associations between the categorical variables.
The proposed prediction model was developed based on the most important features in the “XGBoost” package in Python language. The parameter values of the models were automatically adjusted. The performances of eight models were compared to select the best model. Five-fold cross-validation was used to train and tune the hyperparameter of the model. Specifically, the training set was split into five data sets, four data sets were used to train the model, and the remaining set was utilized to evaluate the performance/generalizability of the model.
The performance of each model was assessed using a set of performance metrics such as AUC, accuracy, sensitivity, precision, PPV and NPV. The decision threshold value was set to maximize the AUC value which was selected here due to its robustness to outcome class imbalance (if all patients were assigned to the larger class, the accuracy would be quite high but the sensitivity would be very low). A confusion matrix was used to compute the PPV or precision, sensitivity or recall specificity, and NPV, The F1 score and accuracy are shown in Eqs. (1)-(6).


Moreover, the area under the AUROC was plotted as a measure of the model performance, with larger AUCs indicating better performance. After the model was developed, the Shapley Additive exPlanations (SHAP) package was used to explain an instance prediction by computing the importance of each feature in the model prediction. The SHAP package interpreted the output of the machine-learning model using a coalitional game-theoretic approach.39
ResultsBaseline characteristics of the patientsAs shown in Figure 1, final enrolment in the study included 1148 patients; information on the cohort is shown in Table 1. The mean age of the patients was 30.34 years; 60.3 % of them were men. The mean ages of the non-transfusion and transfusion group patients were 28.20 (SD: ± 18.29) and 37.14 (SD: ± 16.75) years, respectively. The transfusion group patients were statistically significantly older than those of the non-transfusion group (p-value <0.01). Patients in the transfusion group had significantly longer hospital stays (5.1 days; interquartile range [IQR]: 4.04–6.88; p-value: <0.01) than those in the non-transfusion group (3.85 days; IQR: 2.9–5.0). The 10- to 20-year age group, with a male predominance, had the highest proportion of dengue cases (21.1 %) followed by the 20- to 30-year age group (19.4 %) and the 30- to 40-year age group (19.2 %). The over 70-year-old age group had the fewest cases. Blood component transfusions were given in 24 % (275/1148) of patients, while 76 % (873/1148) of the patients received no blood component transfusions. Table 1 compares the characteristics of patients who received blood component transfusions versus those who did not.
 Data was acquired from an electronic health records of a network of hospitals; the included features were demographic, administrative, radiological, and lab related parameters. After feature engineering, 389 features were itemized and 16 features were screened thus 16 features were used to develop the model. (B) The methodology flow of the study.")
. Modelling process and methodology flow of the study. (A) Data was acquired from an electronic health records of a network of hospitals; the included features were demographic, administrative, radiological, and lab related parameters. After feature engineering, 389 features were itemized and 16 features were screened thus 16 features were used to develop the model. (B) The methodology flow of the study.
Amongst all confirmed dengue cases, three patients (0.26 %) had platelet counts ≤ 20,000 (severe thrombocytopenia), 114 patients (9.93 %) had moderate thrombocytopenia (range: 20,000–50,000), 439 patients (38.24 %) had mild thrombocytopenia (range: 50,000–1,000,000) while the remaining 592 patients (51.57 %) had values equal to or more than 1000,000 (Figure 1 of the Supplementary material). Thrombocytopenia had a significant association with blood component transfusion (p-value <0.05).
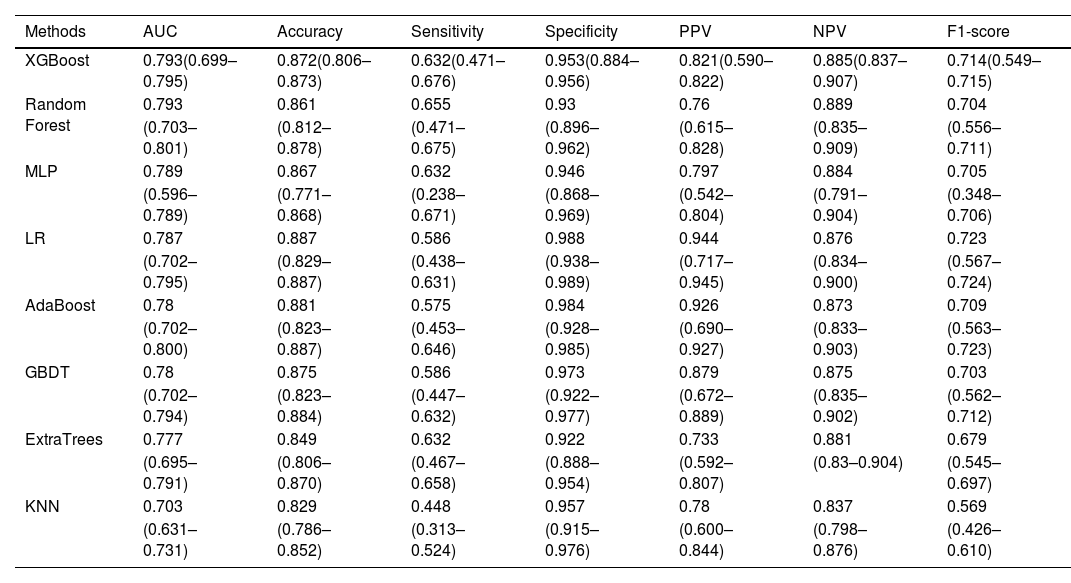
Model validation performanceSixteen features were selected using the voting method (for details see Supplementary material) and used in each classifier to predict blood component transfusion during hospital stay. In the validation set, XGBoost and the random forest model achieved the same AUC (0.793) with the KNN classifier had the lowest AUC (0.703) (Figure 2). The XGBoost model significantly outperformed the seven other machine-learning models. The relatively balanced sensitivity, specificity, PPV, NPV and F1-score of the XGBoost model were 0.632, 0.953, 0.821, 0.885, and 0.714, respectively (Table 2). Confusion matrices, ROC curve, and the Precision-Recall curve for all the models are available in Figures 5-9 of the Supplementary material. Figure 3 shows the calibration plot for the prediction of blood component transfusion needs amongst the cases using the XGBoost model.
 models.")
Performance metrics and 95 % confidence intervals of all the predicting models in the internal validation set with the 16 most important features.
Each model's performance was tested using 345 records, which makes up 30 % of the data set (n = 1148).

Calibration plot of internal validation set for the XGBoost model. The predicted probability of blood component transfusion cases is compared to the actual proportion of blood component transfusion cases amongst subjects in the 30 % holdout set. Perfect predictive calibration ability is represented by the dashed diagonal line.
Of the 345 patients in the validation set, 301 patients were correctly classified. The SHAP summary plot demonstrated that severe thrombocytopenia, abdominal free fluid, longer hospital stays, lower sodium, and lower albumin ranked as the five most important features (Figure 4). This plot also revealed that severe thrombocytopenia, abdominal free fluid, longer hospital stays, lower sodium, and lower albumin were linked with higher SHAP value outputs in the XGBoost model indicating more likely to receive blood component transfusions (Figure 4). The SHAP summary plot of the random forest, GBDT, and ExtraTrees models also demonstrated that severe thrombocytopenia, abdominal free fluid, and longer length of hospital stay ranked amongst the three most important features, respectively (Supplementary material Figures 2-4).

SHAP analysis of the test set using the XGBoost model. Each circular dot represents one patient. Features are listed on the y-axis in rank order with the uppermost being the highest contributor to the prediction model and the lowermost being the lowest contributor. The x-axis shows the range of SHAP values, a value of zero represents no contribution. Transfusion risk is encoded by its horizontal coordinates, where positive values indicate higher transfusion risks and negative values indicate lower transfusion risks.
Five examples of correctly classified cases (# 246, 261, 264, 268 and 297) are demonstrated as SHAP force and decision plots in Figure 5. The primary contributing variables for an individual's final model output are mostly shown in the force plot. The bars represent the SHAP value. The colours of the bars depict the consequence of the SHAP value (Positive or Negative). The prediction value is highlighted in black. The line graph shows the baseline. The instance value is also shown for each patient. The SHAP decision plots represent the decision path for every feature. The units shown on the x-axis are probabilities. The importance of each feature is listed in descending order. Each line on the plot strikes the x-axis at the predicted value of its corresponding observation. This shows how each feature contributes to the overall prediction.
. Features in pink tend to push the probability of need of blood component transfusion to the right, while features in green tend to push it to the left. Doctors can use this plot to easily identify the most important features with high decision power at the individual level. B: SHAP decision plot for the same five patients. This provides a better visualization of how all predictors affect each decision in terms of their importance. The decision path changes direction drastically with the highly important features and achieves an estimated probability of blood component transfusion needs. An individual physician can choose whether or not to trust the output based on how the features affect the direction.")
A: SHAP force plot for five patients (#: 246, 261, 264, 268 and 297). Features in pink tend to push the probability of need of blood component transfusion to the right, while features in green tend to push it to the left. Doctors can use this plot to easily identify the most important features with high decision power at the individual level. B: SHAP decision plot for the same five patients. This provides a better visualization of how all predictors affect each decision in terms of their importance. The decision path changes direction drastically with the highly important features and achieves an estimated probability of blood component transfusion needs. An individual physician can choose whether or not to trust the output based on how the features affect the direction.
Dengue epidemics, which happen every two to three years in South East Asia, are a significant public health issue. The majority of the diagnoses are based on clinical symptoms and are backed by laboratory tests, such as the NS-1 antigen test and IgM antibodies against the virus, which show infection. This study found that the highest number of dengue patients were in the 10- to 20-year age group (21.1 %), with a male predominance. The current study also observed that 24 % of the patients required blood component transfusions and thrombocytopenia was present in 48.43 % of the patients which is in agreement with other studies carried out in India.40
This study used machine-learning techniques in a novel way to predict blood component transfusion needs in dengue patients during their hospital stay. The XGBoost model was found to predict blood component transfusion needs with reasonable accuracy better than the other models constructed in this study. The model had excellent discrimination during internal validation and showed satisfactory sensitivity and specificity. Therefore, the hypothesis proposed in this study was supported by the outcomes of the model.
Prediction of tasks in many facets of daily life could be revolutionised by modern machine-learning techniques, particularly in medicine.41 In contrast to a few years ago, when linear modelling tasks could only be completed with the aid of linear regression models, many nonlinear interactions may now be accurately characterised using contemporary machine-learning techniques, for example, using support vector machine, decision trees or neural networks. The accuracy of these modern techniques greatly beats the traditional method only if the underlying data cannot be described linearly.42 In our data set, the LR model has already produced pleasantly surprising outcomes for the task of comparing blood component transfusion needs vs. non-transfusion.
In this study, a machine-learning model was developed to predict blood component transfusion needs of dengue patients, which could help clinicians to identify high-risk patients. If the model predicts patients at low probability for requiring transfusions, unnecessary blood collection and stocking can be reduced. Similarly, for patients with high risk of transfusion, blood bank stock management can be streamlined. An early prediction of risk for transfusion would allow the care provider team to take preventive actions to better manage patient care as per the risk profile.
XGBoost has the best prediction performance based on the outcome parameters, which is reflected by the high AUC, the reasonable sensitivity, specificity values and F1-score. This makes XGBoost useful in our clinical setting, although it must be stated that the other models were only marginally worse and that there is no clear winner amongst the different machine-learning models.
This study is significant since it merged dengue-related characteristic data with haemoglobin to create a prediction model. Longer hospital stays, lower haemoglobin levels, severe thrombocytopenia, higher total leucocyte count, lower potassium levels, lower globulin levels, lower albumin levels, higher total bilirubin, lower lymphocyte counts, abdominal free fluid, lower monocyte counts, lower sodium levels, higher creatinine levels, left effusion, lower mean corpuscular volume, and higher haematocrit levels were selected as significant variables. Moreover, their correlation with blood component transfusion needs was demonstrated in the SHAP summary plot. The SHAP force and decision plots were used to show how complex models arrive at their predictions.
Model validation is a crucial task in the field of medical research to ensure that machine-learning models are reliable and accurate in predicting patient outcomes. This study used test data to validate eight machine-learning methods including Adaboost, ExtraTrees, GBDT, KNN, LR, MLP, RF, and XGBoost and 5-fold cross-validation to train and tune the hyperparameter of the models.43-45 Several studies have reported successful applications of these ML methods in respect to blood component transfusions.18-20,46 The XGBoost model was used to classify blood component transfusion requirements.46,47
There were several limitations to this study. First, the gold standard for blood component transfusion in dengue patients was the doctor's clinical judgement and over-transfusion can be a problem in such a scenario. Second, the hospitals in the network where the data was collected are probably generalizable to a specific model. However, the data acquired is not clinically exhaustive, as the current study relied completely on the demographic, administrative, laboratory, and radiological-related characteristic data accessed from the electronic health records of the hospital network. With different populations and practise patterns, it might not be easily generalizable to other regions and so the process outlined here may need to be used independently for the model's development or revalidation in each community. Third, a 7:3 ratio was used to divide the training and testing sets, therefore using alternative external testing sets might produce different results; external data validation may be needed before the generalization of the model. Lastly, even though SHAP values were employed to aid in the understanding of our machine-learning model, the medical world still requires a more interpretable model.48
ConclusionA long-standing issue in medicine is the discovery of the factors that influence blood component transfusions needs in dengue patients; statistical models are frequently employed in the literature. In this study, a reliable machine-learning algorithm was used to develop an expedient blood component transfusion prediction model during the hospitalization of dengue patients with a good performance. XGBoost had the best fit with an AUC of 0.793 (95 % CI: 0.699–0.795) and corresponding specificity of 0.953 and sensitivity of 0.632, although it should be noted that the other models were only marginally worse. This study recommends the use of this model to predict blood component transfusions during the hospital stay to help care providers to take appropriate preventive measures for high-risk patients. Machine-learning models should be developed based on the characteristics of dengue patients and the models should be validated with more data in the future. Finally, a follow-up study should be carried out to assess the impact of predictive models on clinician behaviour, healthcare utilization, patient outcomes, and to support the decisions of clinicians.


