


Inspiratory muscle training (IMT) has been shown to be an efficient method of improving exercise tolerance and inspiratory and expiratory muscle strength in several diseases. The effects of IMT on patients with sickle cell anemia (SCD) are relatively unknown. Our study aimed to evaluate the effects of IMT on adult SCD patients, regarding respiratory muscle strength (RMS) variables, lung function, exercise tolerance, blood lactation concentration, limitation imposed by dyspnea during daily activities and impact of fatigue on the quality of life.
MethodsThis was a randomized single-blind study, with an IMT design comprising true load (TG) and sham load (SG) groups. Initial assessment included spirometry, volumetric capnography (VCap) and measurement of RMS by maximal inspiratory and expiratory pressure (PImax and PEmax). The Medical Research Council dyspnea scale and modified fatigue impact scale were also applied and blood lactate concentration was measured before and after the 6-minute walk test. After this initial assessment, the patient used the IMT device at home daily, returning every 6 weeks for RMS reassessment. Both groups used the same device and were unaware of which group they were in. After a period totaling 18 weeks, patients underwent the final evaluation, as initially performed.
ResultsTwenty-five patients in total participated until the end of the study (median age 42 years). There were no significant differences between TG and SG based on age, sex, body mass index or severity of genotype. At the end of the training, both groups showed a significant increase in PEmax and PImax, improvement in Vcap and in exercise tolerance and dyspnea reduction while performing daily life activities. The same was observed in patients grouped according to disease severity (HbSS and HbSβ0vs HbSC and HbSβ+), without differences between groups.
ConclusionHome-based inspiratory muscle training benefits outpatients with SCD, including the sham load group.
Trial registrationhttp://www.ensaiosclinicos.gov.br; registration number: RBR-6g8n92.
Sickle cell disease (SCD) is an autosomal recessive, clinically heterogeneous disorder affecting millions worldwide, and is characterized by hemolytic anemia, progressive vascular injury, vaso-occlusive crises, end-organ injury and a reduced life expectancy.1,2 Pulmonary complications, including acute chest syndrome, pulmonary hypertension, venous thromboembolism, asthma/recurrent wheezing and sleep-disordered breathing are an important cause of morbidity and mortality in SCD.3,4 Individuals with SCD also tend to have an increased concentration of lactate in the blood ([Lac]) due to the greater use of the anaerobic metabolism.5
Pulmonary disorders often lead to breathlessness and mild abnormalities in pulmonary function tests (PFT).6 In addition, pulmonary complications, as well as other complications inherent to SCD, such as arterial oxyhemoglobin desaturation, anemia, damage to organs and tissues related to the adaptation to exercise (such as heart or skeletal muscles) may cause exercise intolerance.7,8 Thus, the mechanisms related to exercise intolerance observed in SCD patients are numerous, conferring a multifactorial character to sickle cell disease.9
Inspiratory muscle training (IMT) has been shown to be an efficient method of improving exercise tolerance and inspiratory and expiratory muscle strength in a number of diseases.10,11 Some studies have shown that IMT even enables increased oxygen uptake in the blood, decreases the perception of dyspnea and delays the onset of premature fatigue.12,13 However, the effects of IMT on patients with sickle cell anemia are relatively unknown. To our knowledge, a single case study evaluated the application of this training, and showed in that patient improvement in exercise tolerance and respiratory muscle strength.14
The aim of the current study was to investigate the effects of inspiratory muscle training on SCD patients. We hypothesized that eighteen weeks of IMT would enhance respiratory muscle strength and exercise tolerance, improve measurements in the pulmonary function tests and reduce the impact of fatigue on the quality of life.
MethodsParticipantsPatients with the diagnosis of sickle cell disease (homozygote HbS, compound heterozygote HbS and HbC or β-thalassemia) were recruited from the Hemoglobinopathy Outpatient Clinic of the Hematology and Transfusion Medicine Center at the School of Medical Sciences, University of Campinas (UNICAMP).
Exclusion criteria comprised disorders that could prevent proper assessment or IMT during the study period, such as asthma or neurological disorders. For result analysis, patients who missed the reevaluation more than once or who remained for more than one week without training were also excluded. All patients were instructed to maintain their medical treatments throughout the research period.
Experimental designThis was a randomized study on inspiratory muscle training for SCD patients of true and sham load group (TG and SG respectively) design. All the patients who agreed to participate signed a written informed consent form. The study was approved by the UNICAMP ethics committee (Protocol number: CAAE - 44635415.2.0000.5404) and registered to http://www.ensaiosclinicos.gov.br website (registration number: RBR-6g8n92). Patients were randomized by order of evaluation, being sequentially alternated between SG and TG. The TG performed the IMT with a true load, whereas the SG performed the IMT with a device with no true load.
Both groups used the same equipment model for IMT and were unaware of which group they were in. The study began with an assessment that included spirometry and volumetric capnography (VCap) and assessment of respiratory muscle strength by maximal inspiratory and expiratory pressure, PImax and PEmax, respectively. Two scales, the Medical Research Council (MRC) dyspnea scale and the modified fatigue impact scale (MFIS) were then applied and the [Lac] was subsequently assessed before and after the 6-minute walk test (6MWT). After this initial assessment, the patients were instructed on how to use the IMT device and took it to train at home, returning every 6 weeks for PImax and PEmax assessment and training load adjustment. Each newly included patient received a training device with a true or sham load, according to an alternating list kept by the investigator. After a period totaling 18 weeks, the patients underwent the final evaluation composed of the same tests as the first evaluation (Figure 1).
![Patients flow diagram. Vcap, Volumetric capnography; PImax, maximum inspiratory pressure; PEmax, maximum expiratory pressure; MRC, Medical Research Council dyspnea scale; MFIS, Modified Fatigue Impact Scale; [Lac], blood lactate concentration; 6MWT, 6-minute walk test; Borg, modified Borg scale.](https://static.elsevier.es/multimedia/25311379/0000004300000004/v1_202111020756/S253113792030122X/v1_202111020756/en/main.assets/gr1.jpeg?xkr=ue/ImdikoIMrsJoerZ+w92xcqUtYYCc6yiYRjTD2AR3zJSEmH4GGT8A27de8H5QqAdccHlDwud9PYwTAyLTEDpfcsXm2/k0mMsck4wcG/yDf8uxuBsKm47cJ8XAr2IUFVdWBLckdAjQk61a+YkkH4dN0lUOMwxBAyVslANZ0sUaur9IgesSk0I47NQzTbZppYhapsqJvxnICtwrvB1hkdfo4DJWztmmSaKiehu9vxsYZkIb3Belp2sjcHsYUTWKpvNtsaFUvCiMUt8uYFsnId7LuNC7sssLbqjbMlwGFb/sBZwuv6FmzEuWweu9vcNaN "Patients flow diagram. Vcap, Volumetric capnography; PImax, maximum inspiratory pressure; PEmax, maximum expiratory pressure; MRC, Medical Research Council dyspnea scale; MFIS, Modified Fatigue Impact Scale; [Lac], blood lactate concentration; 6MWT, 6-minute walk test; Borg, modified Borg scale.")
Patients flow diagram. Vcap, Volumetric capnography; PImax, maximum inspiratory pressure; PEmax, maximum expiratory pressure; MRC, Medical Research Council dyspnea scale; MFIS, Modified Fatigue Impact Scale; [Lac], blood lactate concentration; 6MWT, 6-minute walk test; Borg, modified Borg scale.
The entire study was carried out at Hospital de Clínicas at UNICAMP. All evaluations at baseline and at the end of 18 weeks were performed by the same physiotherapists, according to protocols, and under the same conditions. The evaluations were carried out by three physiotherapists, one being responsible for volumetric capnography (VCap), the other for spirometry and the third, along with the second, for the other evaluations.
Pulmonary Function TestsThe pulmonary Function Tests (PFT) included spirometry and volumetric capnography (VCap) and were always performed in the morning at the Pulmonary Function Laboratory of the Pulmonary Diseases Service at the Hospital de Clinicas da UNICAMP. Spirometry is capable of measuring the inhalation and exhalation of air volumes as a function of time.15 All the patients underwent spirometry before and 20 min after the inhalation of 400 μg of salbutamol, using a spirometer (EasyOne-PC®, NDD Medizintechnik AG, Zurich, Switzerland). The test was performed according to the American Society guidelines15 and the analyzed values were: forced vital capacity (FVC), forced expiratory volume in the first second (FEV1), FEV1/FVC ratio and mean forced expiratory flow between 25–75% of expired vital capacity (FEF25–75%).
To perform the VCap, a CO2SMOS Plus 8100 (Dixtal/Novametrix; Respironics, Murrisville, PA, USA) was used. The VCap assesses the concentration of expired CO2 as a function of expired tidal volume, analyzing the functional components of tidal volume (VC) and dead space; this method enables the determination of the relationship between ventilation and perfusion.16–18
The Analysis Plus software was used for online recording of respiratory cycles, continuing for five minutes. An off-line sequence of patient respiratory cycles was selected at the end of the data collection to accommodate a variation of less than 15% for the expiratory tidal volume and less than 5% for the end tidal partial pressure of CO2 concentration (PetCO2). In addition, sequences showing phases 2 and 3 slopes equal to zero were eliminated, along with discrepant values.18
Respiratory muscle strengthThe PEmax and PImax were determined using a digital manuvacuometer (MVD30-Globalmed). The patient used a nasal clip and remained seated during these maneuvers. The PImax and PEmax evaluation maneuvers were performed from residual volume (RV) and total lung capacity (TLC), respectively.
For data analysis, the highest value was recorded, each maneuver being performed at least five times, provided that the difference between the highest and the lowest value among three values presented a difference less than 10%.19,20
Medical Research Council dyspnea scale (MRC)The MRC scale consists of only five items, of which the patient chose the item that corresponded to how much dyspnea limited his or her daily living activities (DLA). The patient then reported the degree of dyspnea subjectively, choosing a value between 1 and 5, being: 1 (only suffers from shortness of breath during intense exercise), 2 (suffers from shortness of breath when walking hastily or climbing a ramp), 3 (walking slower than people of the same age due to shortness of breath or having to stop to breathe even when walking slowly), 4 (stops to breathe after walking less than 100 m or after a few minutes) and 5 (feels so short of breath that does not leave the house anymore, or feels short of breath when getting dressed). The higher the score, the greater the limitation of DLA due to dyspnea. When the patient reported no dyspnea status, the classification was 0.6 In Brazil, the MRC scale was validated by Kovelis et al.21
Modified fatigue impact scale (MFIS)The MFIS consists of 21 items distributed in three domains: physical (9 items), cognitive (10 items) and psychosocial (2 items), so that for each item there are 4 possible answers, graded from 0 to 4, in which the highest scores reflect greater impact of fatigue.
For the physical domain, the scores vary from 0 to 36, the cognitive ranges from 0 to 40 and the psychosocial ranges from 0 to 8. Therefore, the total score of the MFIS is given by the sum of the three domains and ranges from 0 to 84 points. Values below 38 are classified as the absence of fatigue. From 38, the higher the score, the greater the degree of patient fatigue.
The MFIS underwent cross-cultural adaptation and was validated for the Portuguese language (in the Brazilian standard), by Pavan et al., in 2007.22
Blood lactate concentration ([Lac])The [Lac] was measured pre- and immediately post-6MWT, using a portable lactate meter (Accutrend plus, Roche, Switzerland), which has a procedure previously validated in the scientific literature.23 Measurements were performed in blood collected from fingertips after the superficial perforation with a disposable lancet. The cleaning of the skin was carried out before and after the perforation with 70% alcohol-soaked cotton.
Six-minute walk testAll the participants performed the six-minute walk test (6MWT) according to the standardized protocol24 before and after the IMT period. A pulse oximeter (Nonin Medical, Inc.; MN, USA) was used to evaluate pulse rate and oxygen saturation. The modified Borg scale (Borg) was used to evaluate dyspnea and perceived exertion rate scores before and after the 6MWT, ranging from 0 to 10 (0 being "nothing" and 10 being "maximal").25 The patients were gently and periodically encouraged to walk on a level surface 30 m long during the 6-minute test.
Inspiratory muscle training (IMT) procedureA specific inspiratory training device (POWERbreathe® Wellness, IMT Technologies Ltd., Birmingham, UK) was used for the IMT, with load adjustment based on PImax. Instructions for proper use at home consisted of exclusive diaphragmatic breathing, not using accessory respiratory muscles during training. The training group used an adjusted load of 30% of the PImax during the first two weeks of training, aiming to facilitate the adaptation to the use of the device, with the load being adjusted by 40% of the PImax during the third week, 50% of the PImax during the fifth week and 60% of the PImax during the sixth week of the IMT up to the end of the study. Every 6 weeks of IMT, respiratory muscle strength (PImax and PEmax) was reassessed and, if the PImax was altered, the load was readjusted. The SG group performed the training with the same device, but without the flap valve; however, load adjustments were simulated so that the patients did not realize that they had used a sham load. Patients from both groups were instructed to perform the IMT daily for 10 min per day with a 1-min rest after 5 min, 7 days a week, until completing 18 weeks of training. The number of repetitions was between 13 and 15 breaths per minute during the 10 min of daily training.
All participants received a paper notepad for notes on the date and time of the IMT. If they did not do IMT on a given day, they could also write down the reason that prevented them from doing so. In addition, for greater reliability when performing the IMT at home, patients were also contacted by cell phone (voice or text message) to verify that they were performing the training correctly and daily or to clarify any problems they might have had with the use.
Statistical analysisExploratory data analysis was performed through summary measures (median, minimum and maximum). Comparison between groups was performed using the Mann–Whitney, Fisher's exact or Chi-square tests. The comparison between times and groups was performed with the ANOVA for repeated measures with the transformed responses in ranks. Differences with a p-value < 0.05 were considered significant. All statistical analyses were performed using the Statistical Analysis System (SAS) for Windows, version 9.4 (SAS Institute Inc., Cary, NC, USA).
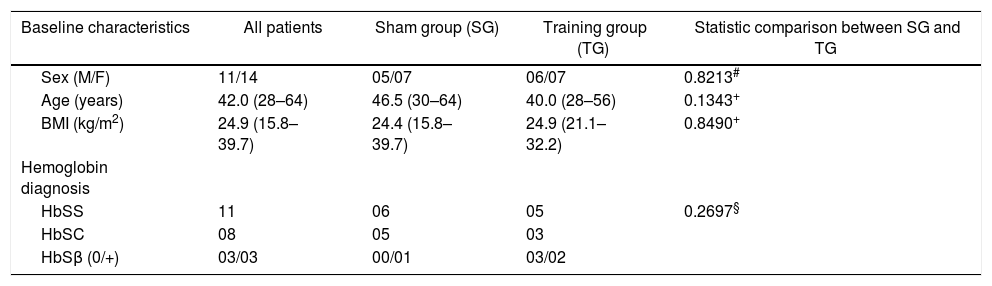
ResultsThirty patients were initially recruited, however five were excluded. Three patients from the SG group dropped out for personal reasons and two other patients belonging to the TG group were excluded for remaining more than 7 days without training, one due to pneumonia and the other due to a sickle cell crisis. Therefore, 25 patients in total participated until the end of the study. Descriptive characteristics of the participants are shown in Table 1. There were no significant differences between the TG and SG groups as for age, sex, body mass index (BMI), hemoglobin gene mutation (p > 0.05) (Table 1).
Characteristics of the study groups.
| Baseline characteristics | All patients | Sham group (SG) | Training group (TG) | Statistic comparison between SG and TG |
|---|---|---|---|---|
| Sex (M/F) | 11/14 | 05/07 | 06/07 | 0.8213# |
| Age (years) | 42.0 (28–64) | 46.5 (30–64) | 40.0 (28–56) | 0.1343+ |
| BMI (kg/m2) | 24.9 (15.8–39.7) | 24.4 (15.8–39.7) | 24.9 (21.1–32.2) | 0.8490+ |
| Hemoglobin diagnosis | ||||
| HbSS | 11 | 06 | 05 | 0.2697§ |
| HbSC | 08 | 05 | 03 | |
| HbSβ (0/+) | 03/03 | 00/01 | 03/02 |
Values are median (min-max). Statistical tests used: +Mann-Whitney; #Chi-square; §Fisher’s exact test. M, male; F, female.
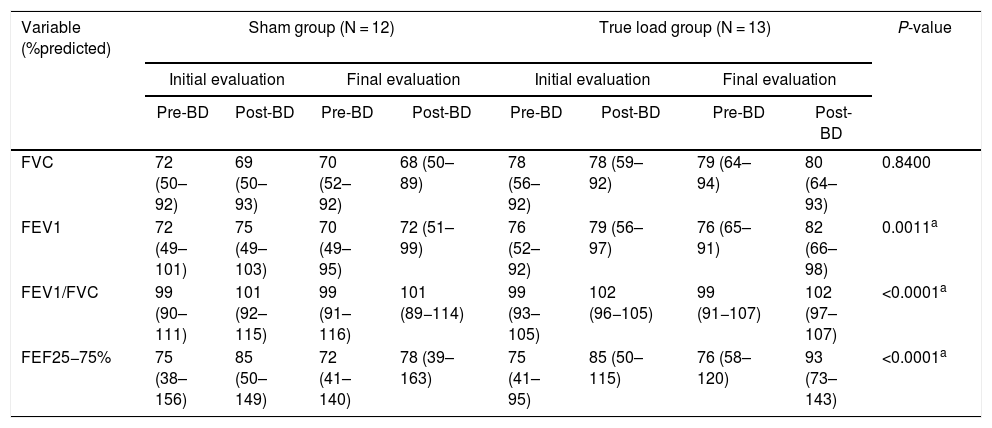
Regarding spirometry, none of the variables showed a significant change, comparing the pre- and post-IMT periods in both groups. However, FEV1, FEV1/FVC and FEF 25 - 75% showed a significant increase (p < 0.05) in the pre- and post-bronchodilator comparison, both in the initial and final evaluations, but not in the comparison between the evaluations (Table 2).
Pulmonary function test pre- and post-bronchodilator.
| Variable (%predicted) | Sham group (N = 12) | True load group (N = 13) | P-value | ||||||
|---|---|---|---|---|---|---|---|---|---|
| Initial evaluation | Final evaluation | Initial evaluation | Final evaluation | ||||||
| Pre-BD | Post-BD | Pre-BD | Post-BD | Pre-BD | Post-BD | Pre-BD | Post-BD | ||
| FVC | 72 (50–92) | 69 (50–93) | 70 (52–92) | 68 (50–89) | 78 (56–92) | 78 (59–92) | 79 (64–94) | 80 (64–93) | 0.8400 |
| FEV1 | 72 (49–101) | 75 (49–103) | 70 (49–95) | 72 (51–99) | 76 (52–92) | 79 (56–97) | 76 (65–91) | 82 (66–98) | 0.0011a |
| FEV1/FVC | 99 (90–111) | 101 (92–115) | 99 (91–116) | 101 (89−114) | 99 (93–105) | 102 (96−105) | 99 (91−107) | 102 (97–107) | <0.0001a |
| FEF25−75% | 75 (38–156) | 85 (50–149) | 72 (41–140) | 78 (39–163) | 75 (41–95) | 85 (50–115) | 76 (58–120) | 93 (73–143) | <0.0001a |
Values are median (min-max).
The statistical test used was ANOVA on ranks transformation, showing a time effect of the training for both groups (p < 0.05) in relation to the pre- and post-bronchodilator (BD) test for each evaluation (initial and final) in all analyses, except for FVC. Pre-BD < Post-BD. Statistical analysis showed no interaction or group effect. N, number of subjects per group; FVC, forced vital capacity; FEV1, forced expiratory volume in one second; FEV1/FVC ratio, ratio of forced expiratory volume in 1 s to forced vital capacity; FEF25-75%, forced mean expiratory flow.
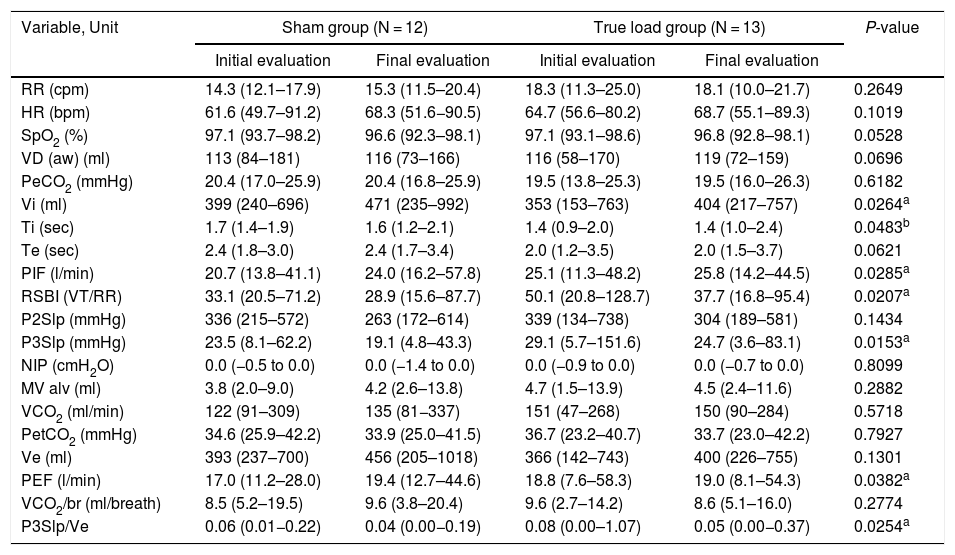
The results of volumetric capnography showed no statistically significant change (p > 0.05) in the variables evaluated in the comparison between the two groups (SG and TG), except for the inspiratory time (Ti) variable, which was significantly higher in the SG compared to the TG (p < 0.05, group effect). However, the following variables: inspiratory tidal volume (Vi), peak expiratory flow (PEF), phase 3 slope of the capnography curve (P3Slp), phase 3 slope normalized according to the expired tidal volume (P3Slp/Ve), peak inspiratory flow (PIF) and Tobin Index (RSBI), had a significant change regarding the time effect in both groups (p < 0.05) (Table 3).
Volumetric capnography.
| Variable, Unit | Sham group (N = 12) | True load group (N = 13) | P-value | ||
|---|---|---|---|---|---|
| Initial evaluation | Final evaluation | Initial evaluation | Final evaluation | ||
| RR (cpm) | 14.3 (12.1–17.9) | 15.3 (11.5–20.4) | 18.3 (11.3–25.0) | 18.1 (10.0–21.7) | 0.2649 |
| HR (bpm) | 61.6 (49.7–91.2) | 68.3 (51.6−90.5) | 64.7 (56.6–80.2) | 68.7 (55.1–89.3) | 0.1019 |
| SpO2 (%) | 97.1 (93.7–98.2) | 96.6 (92.3–98.1) | 97.1 (93.1–98.6) | 96.8 (92.8–98.1) | 0.0528 |
| VD (aw) (ml) | 113 (84–181) | 116 (73–166) | 116 (58–170) | 119 (72–159) | 0.0696 |
| PeCO2 (mmHg) | 20.4 (17.0–25.9) | 20.4 (16.8–25.9) | 19.5 (13.8–25.3) | 19.5 (16.0–26.3) | 0.6182 |
| Vi (ml) | 399 (240–696) | 471 (235–992) | 353 (153–763) | 404 (217–757) | 0.0264a |
| Ti (sec) | 1.7 (1.4–1.9) | 1.6 (1.2–2.1) | 1.4 (0.9–2.0) | 1.4 (1.0–2.4) | 0.0483b |
| Te (sec) | 2.4 (1.8–3.0) | 2.4 (1.7–3.4) | 2.0 (1.2–3.5) | 2.0 (1.5–3.7) | 0.0621 |
| PIF (l/min) | 20.7 (13.8–41.1) | 24.0 (16.2–57.8) | 25.1 (11.3–48.2) | 25.8 (14.2–44.5) | 0.0285a |
| RSBI (VT/RR) | 33.1 (20.5–71.2) | 28.9 (15.6–87.7) | 50.1 (20.8–128.7) | 37.7 (16.8–95.4) | 0.0207a |
| P2Slp (mmHg) | 336 (215–572) | 263 (172–614) | 339 (134–738) | 304 (189–581) | 0.1434 |
| P3Slp (mmHg) | 23.5 (8.1–62.2) | 19.1 (4.8–43.3) | 29.1 (5.7–151.6) | 24.7 (3.6–83.1) | 0.0153a |
| NIP (cmH2O) | 0.0 (−0.5 to 0.0) | 0.0 (−1.4 to 0.0) | 0.0 (−0.9 to 0.0) | 0.0 (−0.7 to 0.0) | 0.8099 |
| MV alv (ml) | 3.8 (2.0–9.0) | 4.2 (2.6–13.8) | 4.7 (1.5–13.9) | 4.5 (2.4–11.6) | 0.2882 |
| VCO2 (ml/min) | 122 (91–309) | 135 (81−337) | 151 (47–268) | 150 (90–284) | 0.5718 |
| PetCO2 (mmHg) | 34.6 (25.9–42.2) | 33.9 (25.0–41.5) | 36.7 (23.2–40.7) | 33.7 (23.0–42.2) | 0.7927 |
| Ve (ml) | 393 (237–700) | 456 (205–1018) | 366 (142–743) | 400 (226–755) | 0.1301 |
| PEF (l/min) | 17.0 (11.2–28.0) | 19.4 (12.7–44.6) | 18.8 (7.6–58.3) | 19.0 (8.1–54.3) | 0.0382a |
| VCO2/br (ml/breath) | 8.5 (5.2–19.5) | 9.6 (3.8–20.4) | 9.6 (2.7–14.2) | 8.6 (5.1–16.0) | 0.2774 |
| P3Slp/Ve | 0.06 (0.01−0.22) | 0.04 (0.00−0.19) | 0.08 (0.00–1.07) | 0.05 (0.00−0.37) | 0.0254a |
Values are median (min-max).
The statistical test used was ANOVA on ranks transformation, showing a time effect of the training for both groups (p < 0.05) in all analysis, except for Ti.
where significant difference between groups were independent of the training (group effect). Vi: initial evaluation < final evaluation; Ti: sham group > true load group; PIF: initial evaluation < final evaluation; RSBI: initial evaluation > final evaluation; P3Slp: initial evaluation > final evaluation; PEF: initial evaluation < final evaluation; P3Slp/Ve: initial evaluation > final evaluation There was no significant result in the statistical analysis of interaction in any of the variables. RR, respiratory rate; HR, heart rate; SpO2, oxygen saturation; VD (aw), anatomical dead space; PeCO2, mean end-tidal partial pressure of CO2; Vi, inspiratory tidal volume; Ti, inspiratory time; Te, expiratory time; PIF, peak inspiratory flow; RSBI, Tobin index; VT, tidal volume; P2Slp, phase 2 slope; P3Slp, phase 3 slope; NIP, negative inspiratory pressure; MV alv, alveolar minute volume; VCO2, CO2 production; PetCO2, end-tidal partial pressure of CO2; Ve, expiratory tidal volume; PEF, peak expiratory flow; VCO2/br, CO2 production per breath; P3Slp/Ve, phase 3 slope normalized according to expired tidal volume.
In both groups, the PImax and PEmax significantly increased after the IMT (p < 0.05, time effect). For the PEmax, there was a significant increase in the second evaluation, in relation to the first, and in the fourth evaluation, in relation to the third evaluation. Regarding the PImax, there was a significant increase in the second evaluation, compared to the first, and in the third, in relation to the second (Figure 2A and B).
 in the first, second, third, and last evaluation, PImax1 < PImax2 < PImax3, PImax4. B: Maximal expiratory pressure (PEmax) in the first, second, third, and last evaluation, PEmax1 < PEmax2, PEmax3 < PEmax4. Figure C: Medical Research Council (MRC) scale of dyspnea in the first and last evaluation, MRC1 > MRC2. Figure D: Distance measurements of the 6-minute walking test (6MWT) in the first and last evaluation, 6MWT1 < 6MWT2. The statistical test used was ANOVA on ranks transformation, showing a time effect of the training for both groups (p < 0.05). Statistical analysis showed no interaction or group effect. Values are median.")
A: Maximal inspiratory pressure (PImax) in the first, second, third, and last evaluation, PImax1 < PImax2 < PImax3, PImax4. B: Maximal expiratory pressure (PEmax) in the first, second, third, and last evaluation, PEmax1 < PEmax2, PEmax3 < PEmax4. Figure C: Medical Research Council (MRC) scale of dyspnea in the first and last evaluation, MRC1 > MRC2. Figure D: Distance measurements of the 6-minute walking test (6MWT) in the first and last evaluation, 6MWT1 < 6MWT2. The statistical test used was ANOVA on ranks transformation, showing a time effect of the training for both groups (p < 0.05). Statistical analysis showed no interaction or group effect. Values are median.
The MRC scale showed a significant reduction in the final evaluation of the values measured (p < 0.05, time effect), the pre-IMT and for both the SG and TG (Figure 2C), with the medians of both groups varying in an identical manner. No significant changes were detected in the MFIS.
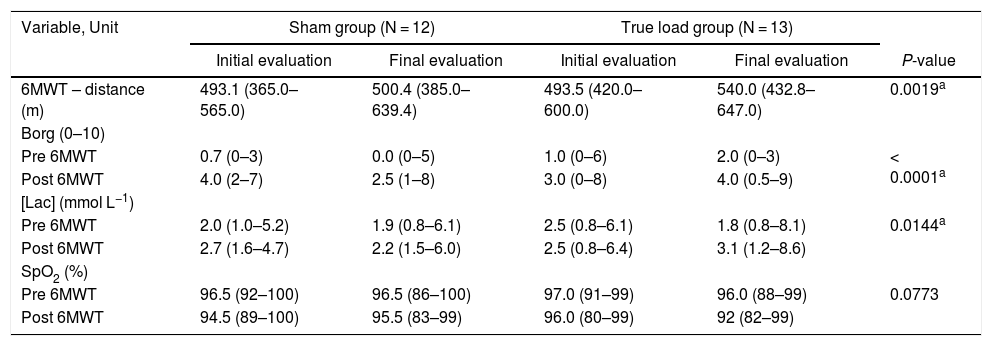
Six-minute walk test (6MWT)In both groups, there was a significant increase in the distance covered after the IMT, compared to the pre-IMT assessment (p < 0.05) (Figure 2D and Table 4).
six-minute walk test and related tests.
| Variable, Unit | Sham group (N = 12) | True load group (N = 13) | |||
|---|---|---|---|---|---|
| Initial evaluation | Final evaluation | Initial evaluation | Final evaluation | P-value | |
| 6MWT – distance (m) | 493.1 (365.0–565.0) | 500.4 (385.0–639.4) | 493.5 (420.0–600.0) | 540.0 (432.8–647.0) | 0.0019a |
| Borg (0–10) | |||||
| Pre 6MWT | 0.7 (0–3) | 0.0 (0–5) | 1.0 (0–6) | 2.0 (0–3) | < 0.0001a |
| Post 6MWT | 4.0 (2–7) | 2.5 (1–8) | 3.0 (0–8) | 4.0 (0.5–9) | |
| [Lac] (mmol L−1) | |||||
| Pre 6MWT | 2.0 (1.0–5.2) | 1.9 (0.8–6.1) | 2.5 (0.8–6.1) | 1.8 (0.8–8.1) | 0.0144a |
| Post 6MWT | 2.7 (1.6–4.7) | 2.2 (1.5–6.0) | 2.5 (0.8–6.4) | 3.1 (1.2–8.6) | |
| SpO2 (%) | |||||
| Pre 6MWT | 96.5 (92–100) | 96.5 (86–100) | 97.0 (91–99) | 96.0 (88–99) | 0.0773 |
| Post 6MWT | 94.5 (89–100) | 95.5 (83–99) | 96.0 (80–99) | 92 (82–99) | |
Values are median (min–max).
The [Lac] was significantly increased (p < 0.05), comparing pre- and post-6MWT, before and after IMT in both groups; however, there were no changes in the comparison between the initial and final evaluations (Table 4).
Modified Borg scale (Borg)The values reported by the patients on the Borg, used before and after the 6MWT application, showed a significant increase between the pre- and post-6MWT evaluations in both groups (p < 0.05), but there were no changes in the comparison between the initial and final evaluations (Table 4).
All the data were also analyzed in patients grouped according to the sickle cell disease severity, i.e., HbSS plus HbSβovs HbSC plus HbSβ+, and revealed no significant difference.
DiscussionThis study aimed to evaluate the effects of long-term IMT on sickle cell disease patients. In both groups, control or true load, there was a significant increase in inspiratory and expiratory muscle strength at the end of the training protocol, improvement in volumetric capnography variables, exercise tolerance and reduction of dyspnea in performing daily life activities. Regarding respiratory muscle strength, although the effects of the IMT on patients with sickle cell disease have been poorly studied,14 studies conducted on individuals with chronic obstructive pulmonary disease (COPD),10 older women26 or those with ankylosing spondylitis11 showed an increase in the PImax and PEmax after the termination of the training protocol. Ciesla27 includes the IMT as one of the types of breathing exercises and points out several benefits in these exercises, as it improves thoracic-cage mobility, increased tidal volume and increased inspiratory capacity. Our study, however, also showed a significant increase in respiratory muscle strength in the control group. We hypothesized that, as the two groups performed 10 min of deep inspiration daily, that is, they actually did breathing exercises, despite the real resistance to the inspiratory flow of home exercises for the TG, the IMT was possibly able to modify the respiratory mechanics in both groups, leading to an increase in the PImax and PEmax, not only for the true load group, but also for the control group.
The spirometry results here obtained showed no significant differences regarding the initial and final evaluations, in either group. Nor were there any changes in these variables reported for older women, COPD or heart failure.26,28,29 On the other hand, in our study the volumetric capnography showed significant changes in some variables after the IMT in both groups. Inspired volume (Vi), peak expiratory flow (PEF) and peak inspiratory flow (PIF) increased significantly, while the Tobin index (RSBI) decreased significantly. These changes suggest that daily deeper inspiratory exercises influenced an increase in inspired and exhaled air volume, even in the control group.
Another variable, the phase 3 slope (P3Slp), decreased significantly in both groups in the final assessment, compared to the initial assessment. As phase 3 of the capnogram represents the elimination of pure alveolar gas, the greater the plateau of the curve in this phase, the more homogenous the distribution of ventilation in distal airspaces.30 The alveolar recruitment is related to a reduced P3Slp.31 Therefore, the reduction in the P3Slp observed in this study suggests that there was alveolar recruitment after the IMT. Furthermore, considering that the higher the expired volume (Ve), the lower the P3Slp, this variable was normalized according to the expired tidal volume (P3Slp/Ve),32 which also decreased after the IMT, confirming the result presented by the P3Slp.
In both groups after the IMT, a significant reduction in dyspnea assessed by the MRC was observed. This scale has been used for many years to classify the limitation imposed by dyspnea on the DLA.21,33 The scale is a simple application tool, which allows the patient to indicate to what extent their dyspnea affects their mobility. This is a widely used scale for the assessment of dyspnea in patients with COPD; however, this scale has also been used as an instrument for the indirect measurement of dyspnea in a study of patients with sickle cell disease.6 Other studies that evaluated the effects of the IMT on patients with pulmonary arterial hypertension, as well as COPD, showed a reduction in dyspnea after the end of the training protocol in the true load group.34,35 In our study, improvement in dyspnea may have occurred due to increased respiratory muscle strength and increased post-IMT alveolar recruitment in both groups.
The MFIS, which allows for the indirect assessment of the impact of fatigue on the quality of life, did not change significantly at the end of the IMT in both groups. This scale, originally developed by Fisk et al. in 1994,36 though widely used to assess the impact of fatigue on the quality of life in patients with multiple sclerosis, has also been used to assess indirect fatigue in a study on patients with sickle cell disease.6 Both groups however, had a significant increase in the distance covered during the 6MWT, which can be considered a form of direct assessment of fatigue6 and exercise functional capacity. Some studies on patients with COPD and asthma have also reported reduced muscle fatigue and increased exercise functional capacity after the IMT.34,37 There is an increase in the level of metabolites in the circulation, such as lactate and hydrogen ions because of the increase in the anaerobic metabolism induced by exercise in hypoxia.13 Especially in the respiratory muscles, the IMT improves clearance ability and tolerance to the levels of lactate and hydrogen ions.38,39 Therefore, strengthening of inspiratory muscles probably attenuated the metaboreflex of the inspiratory muscles, which increased blood flow and oxygenation of limb muscles, reducing premature fatigue during exercise in hypoxia.13,40,41 Nevertheless, these results must be viewed with caution, since direct metaboreflex measurements were not performed in the present study.
Regarding the [Lac], normal values in healthy individuals should be between 0.5 and 2.0 mmol/l.42 However, there was a tendency for the [Lac] to be higher in patients evaluated before the 6MWT and therefore at rest, when compared to normal values in healthy individuals. Some of the evaluated patients had pre-TC6 maximum values between 5.2 mmol/l and 8.1 mmol/l, i.e., well above the maximum normal value found in healthy individuals. Some authors attribute the increase in the [Lac] in patients with sickle cell disease to the adaptation to the lower O2 availability to body cells, caused by the change from the basal to the anaerobic metabolic pathway, due to the sickle cell process. Thus, the anaerobic glycolysis increases the participation in the cellular energy metabolism, favoring the production and increase in the [Lac].43,44
The [Lac] showed no significant change in the comparison of the initial and final evaluation results. As expected, there was an increase in the [Lac] after the 6MWT, probably related to the greater participation of the anaerobic metabolism.45 The [Lac] tends to increase significantly to levels between 50% and 60% of the maximum oxygen uptake rate (VO2max).46 Patients with sickle cell disease may have a reduction in VO2max due to the pathophysiological changes of the disease itself that reduce the half-life of red blood cells, leading to reduced oxygen transport. In addition, intrinsic lung disease also worsens peripheral oxygenation, contributing to the lower oxygen uptake peak in these patients.43,47 Thus, these patients tend to have a greater increase in the [Lac] during exertion. Thus, IMT does not appear to have influenced an improvement in these conditions and, therefore, did not contribute to a lower elevation in the [Lac].
Finally, the comparison of patients grouped according to disease severity revealed no differences, suggesting homogeneity of the patients, probably due to the medical intervention in the natural history of the disease.
However, despite the important results found, we believe that other studies with a larger sample size and over a longer period should be made to test our hypothesis.
ConclusionIn this study on SCD, the inspiratory muscle training at home is a strategy that can be easily applied in outpatients, providing benefits, such as increasing respiratory muscle strength, improvement in Vcap and exercise tolerance and reducing dyspnea in activities of daily living. Further studies in a larger sample and over a longer period should be performed to obtain more details on the effects of the IMT on patients with SCD.
FundingThis study was funded in part by the grant #2011/51959-0 and 2017/21801-2d, the São Paulo Research Foundation (FAPESP) and the Ministry of Science, Technology, Innovations and Communications (CNPq) grant # 301676/2013-5.
Availability of data and materialsThe datasets generated during and/or analyzed during the current study are available upon request to the corresponding author.
Ethics approval and consent to participateThis study complied with the declaration of Helsinki and was approved by the Research Ethics Committee of the University of Campinas (CAAE 44635415.2.0000.5404).
Consent for publicationNot applicable.
Conflicts of interestThe authors declare that they have no competing interests. There is no professional relationship with companies or manufacturers who will benefit from the results of the present study.
Authors’ contributionsStudy design: FG, IAP and STOS; Data collection: FG, CTZ and MMM; Analysis of the data: FG, CTZ, IAP and STOS; Manuscript preparation: all authors. All authors read and approved the final manuscript.
The authors would like to thank Prof. Alberto Cliquet Jr. for providing a space at the Laboratory of Biomechanics and Locomotive Apparatus Rehabilitation at UNICAMP, Roberto Zulli for the statistical analysis and Raquel S. Foglio for the writing assistance and English revision.


