


COVID-19 disease presentation is heterogeneous, from asymptomatic up to severe life-threatening forms. Getting further insights into patients with specific diseases is of particular interest. We aimed to identify profiles of hematology patients hospitalized with COVID-19 that would be associated with survival and to assess the differences between cohorts
MethodsA binational cohort of 263 patients with COVID-19 and hematological disease was studied in Paris, France and São Paulo, Brazil. Patient profiles were based on age, comorbidities, biological measurements, COVID-19 symptoms and hematological disease characteristics. A semi-supervised learning method with a survival endpoint was first used, following which, a classifier was identified to allow the classification of patients using only baseline information
Main resultsTwo profiles of patients were identified, one being young patients with few comorbidities and low C-reactive protein (CRP), D-dimers, lactate dehydrogenase (LDH) and creatinine levels, and the other, older patients, with several comorbidities and high levels of the 4 biology markers. The profiles were strongly associated with survival (p < 0.0001), even after adjusting for age (p = 0.0002). The 30-day survival rate was 77.1% in the first profiles, versus 46.7% in the second. The Brazilian analysis emphasized the importance of age, while the French focused on the comorbidities
ConclusionThis analysis showed the importance of CRP, LHD and creatinine in the COVID-19 presentation and prognosis, whatever the geographic origin of the patients.
Since the coronavirus disease 19 (COVID-19) outbreak began in the province of Wuhan in China, the virus has spread throughout the world in an unprecedented way. France and Brazil confirmed the first cases in the European and South American regions, with high incidence rates in the peak of the first wave of contamination, accounting for more than 50 thousand new cases daily in France in April 2020, and later in Brazil, in July. As of March 2021, the two nations together registered 17.8 million confirmed cases and more than 428 thousand deaths since the index case.1,2
Patients with hematological disorders, especially malignancies, may be more vulnerable to SARS-CoV-2 infection because of the underlying disease and its treatment.3,4 In large cohorts, mortality rates were found to be 39% (95% CI: [34;44]) for hospitalized patients with hematologic malignancies4versus 22% (95% CI: [21;23]) for hospitalized patients without malignancies.5 Indeed, myelotoxic drugs, immunosuppressive therapies and, consequently, the immune dysfunction seem to contribute to the worst prognosis in patients with hematological diseases and COVID-19.4,6,7
Patients with malignancies and COVID-19 admitted to the hospital showed a wide range of clinical manifestations and laboratory abnormalities, usually presenting with cytopenias and higher levels of inflammatory biomarkers than the patients without cancer.8 Some of these features have been reported as prognostic factors associated with a worse evolution during hospitalization. Still, is not clear which patients, laboratory tests at hospitalization and underlying disease factors are associated with worse outcomes. Furthermore, the heterogeneous clinical manifestation of COVID-19 in patients with hematological disorders may not be exclusively related to COVID-19, but may also be due to the wide clinical spectrum of underlying hematological disorders.
The identification of patterns and clinical manifestations experienced by hematological patients during the moderate or severe SARS-CoV-2 infection might be helpful in deciphering interactions between the hematological disease and the COVID-19 infection, or in the allocation of scarce resources and care management, in areas of the world where it is relevant. In the last few years, the use of unsupervised or supervised learning methods has been boosted by the COVID-19 pandemic and the need to analyze a huge amount of data in an emergency scenario. However, to the best of our knowledge, there have been no reports about specific clinical profiles of patients with COVID-19 and underlying hematological diseases from two different countries with demographic and socioeconomic disparities.9–13
ObjectiveThe main objective of the study was to identify the profiles of hospitalized hematological patients with moderate or severe COVID-19, using the clinical information and patient survival outcomes from 2 different countries. The secondary objective was to assess the differences between Brazilian and French cohorts, as for the clinical profiles and outcomes. This allowed us to distinguish elements of the results that were dependent on, or independent of, local specificities.
Material and methodsStudy design and settingPatients were enrolled either in São Paulo, Brazil, or Paris, France, from two prospective independent databases of in-hospital COVID-19 patients and underlying hematological diseases. Hospitalization was indicated for patients with respiratory distress signs (accessory muscles use, nasal wing beat and respiratory rate ≥ 24 bpm) or capillary oxygen saturation < 93%. The ICU admission was considered if there was no improvement in respiratory distress, despite the oxygen supply (6 L/min), or hemodynamic instability. Regarding treatments, in France, all patients received antibiotics, at the physician's discretion. Systematic thromboembolic prophylaxis was first heterogeneous, then higher doses were used from April 4 onward, following the Groupe d'intérêt en Hémostase Périopératoire (GIHP) and Groupe Français d’études sur l'Hémostase et la Thrombose (GFHT) recommendations.14 Specific COVID-19 treatments were rarely administered, totaling approximately 10% using lopinavir, approximately 5%, hydroxychloroquine, and only a few, eculizumab or tocilizumab. In Brazil, patients received the drugs (ceftriaxone 2g for 5 days, azithromycin 500 mg for 5 days and oseltamivir 150 mg for 5 days or even a negative influenza test) and antithrombotic prophylaxis with enoxaparin or analog at admission. Following that, at both hospitals from July 2020 onward, after the publication of evidence regarding the benefit of using dexamethasone, all patients received dexamethasone 6 mg for 10 days.
All consecutive patients aged ≥ 18 years admitted to the COVID-19 care unit at both hematological reference centers until December 2020 were included in the analysis. São Paulo and Paris are the most populous cities of Brazil and France and have been the epicenters of COVID-19 in these two countries.
Participants and proceduresCOVID-19 cases were defined by SARS-CoV-2 positive real-time reverse transcriptase-polymerase chain reaction (RT-qPCR) and/or very suggestive clinical and radiological findings of COVID-19 or even, additionally, a positive serological test. All diagnostic laboratory procedures were performed in accordance with previously published methods and international standards.15,16 According to the institutional protocols, hospitalization was indicated for patients with respiratory distress signs or low levels of capillary oxygen saturation. The ICU admission was considered if there was no improvement in respiratory distress, despite the oxygen supply, or hemodynamic instability. Patients with a hospital stay of less than 24 hours were excluded from the analysis. All patients were followed until the end of their hospitalization and subsequent to their discharge, follow-up data were recovered from medical charts, outpatient consultations, or new hospitalizations, if data were available. The study was approved by the Institutional Review Boards (IRBs) at both centers. Supplementary Fig. S1 presents an overview of the cohort.
Data collection, variables and outcomesThe datasets containing records of all patients were exported, cleaned and merged in February 2021. Data on the clinical presentation of COVID-19, type of admission (ward or ICU), comorbidities (diabetes mellitus, high blood pressure, cardiovascular diseases, kidney failure or obesity) and laboratory tests (complete blood count, creatinine, C-reactive protein (CRP), Lactate Dehydrogenase (LDH) and D-dimer) were captured at hospital admission. Further, the data of hematological disease with ongoing or past treatment were obtained directly from the medical staff and from medical chart review. All data were recorded using REDCap data capture tools (https://www.project-redcap.org/). The study's primary outcome was the patient overall survival time after hospital admission, whatever the cause of death.
Statistical methodsSummary statistics were used, either frequencies and percentages for categorical variables, or median and interquartile range (IQR) for continuous or discrete variables. Differences between the Brazilian and French sub-cohorts of continuous and categorical variables were evaluated with the Wilcoxon rank sum test or the exact Fisher test, respectively.
The principal component analysis (PCA) was used as a visual tool to assess correlations between continuous variables and to display patient profiles. Categorical variables (symptoms of fever, dyspnea, cough or a rapid hospitalization (within 7 days of symptoms appearance), a high blood pressure comorbidity, a diagnosis of chronic lymphoid disease and an intermediate type of chemotherapy treatment) were modeled into a continuous archetype score, using a generalized low-rank model (GLRM) (Supplementary Fig. S2). The multiple imputation (MI) was performed to handle missing values on covariates and the PCA was carried out on the first imputed dataset. The MI model included age, C-reactive Protein (CRP), D-dimers, LDH, neutrophils, lymphocytes, platelets, creatinine level, number of comorbidities, the archetype and patient gender, as well as the Nelson-Aalen estimator and death indicator, as recommended.17 Imputation methods were predictive mean matching for continuous variables and logistic regression for the categorical variable. Fifteen imputed datasets were generated.
Prognostic variables were assessed through univariable Cox models.
To define patient profiles using baseline information, as well as survival information, we used the semi-supervised learning approach by Faucheux et al.18 Missing data were taken into account by applying the algorithm on the 15 imputed datasets described above. The analysis was also conducted using the Brazilian and the French cohort, separately.
Several graphical diagnostics were used for clinical interpretation. The boxplot and barplot were used to assess the clinical characteristics according to the type of variables. Survival curves were estimated, using the Kaplan-Meier method, and compared, using the log-rank test.
Last, a classifier was built to allow for the classification of new patients into one of the identified Surv.+ and Surv.- profiles, using the baseline information. The C5.0 rule-based classification model19 was used with 3 boosting iterations. The dataset was randomly split into a training set (70%) and a validation set (30%). All baseline raw data (i.e., not centered, not scaled and not imputed) were used to train the model that selected the most important variables. The accuracy was measured by the proportion of correctly classified patients.
All analyses were performed on the R 4.0.3 (https://www.R-project.org/).
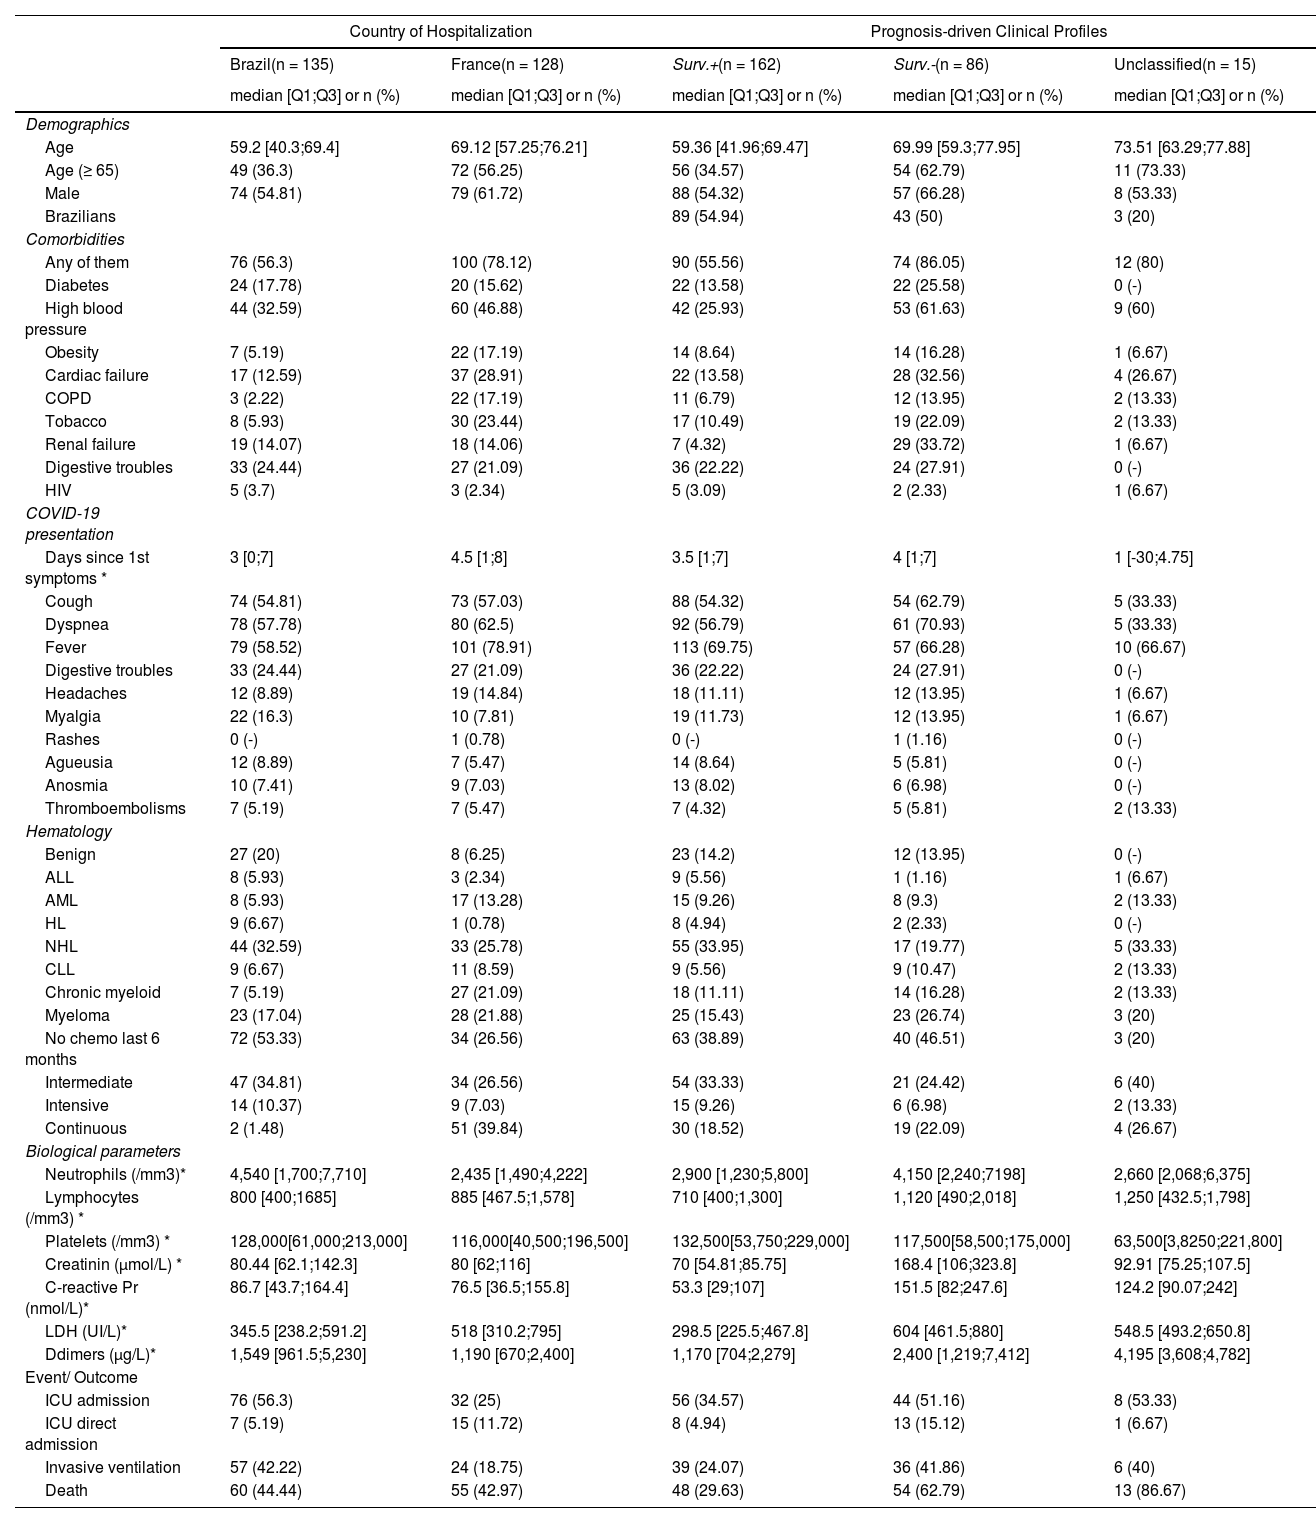
ResultsCohort descriptionThe patient characteristics of the overall cohort and according to the country are summarized in Table I. Male patients were more frequent (58%), the median age was 63.3 (IQR 51.7;73.1) years and 46% were elderly patients, 65 years old or over. The prevalence of comorbidities was high, mainly high blood pressure (39.5%), cardiac failure (20.5%) and diabetes mellitus (16.7%). Cough, fever and dyspnea were the most common symptoms at admission and most of the patients had hematological malignancies (86.7%). Non-Hodgkin Lymphoma (29.3%) and multiple myeloma (19.4%) were the most frequent hematological disorders.
Description of enrolled patients according to country and identified partition.
| Country of Hospitalization | Prognosis-driven Clinical Profiles | ||||
|---|---|---|---|---|---|
| Brazil(n = 135) | France(n = 128) | Surv.+(n = 162) | Surv.-(n = 86) | Unclassified(n = 15) | |
| median [Q1;Q3] or n (%) | median [Q1;Q3] or n (%) | median [Q1;Q3] or n (%) | median [Q1;Q3] or n (%) | median [Q1;Q3] or n (%) | |
| Demographics | |||||
| Age | 59.2 [40.3;69.4] | 69.12 [57.25;76.21] | 59.36 [41.96;69.47] | 69.99 [59.3;77.95] | 73.51 [63.29;77.88] |
| Age (≥ 65) | 49 (36.3) | 72 (56.25) | 56 (34.57) | 54 (62.79) | 11 (73.33) |
| Male | 74 (54.81) | 79 (61.72) | 88 (54.32) | 57 (66.28) | 8 (53.33) |
| Brazilians | 89 (54.94) | 43 (50) | 3 (20) | ||
| Comorbidities | |||||
| Any of them | 76 (56.3) | 100 (78.12) | 90 (55.56) | 74 (86.05) | 12 (80) |
| Diabetes | 24 (17.78) | 20 (15.62) | 22 (13.58) | 22 (25.58) | 0 (-) |
| High blood pressure | 44 (32.59) | 60 (46.88) | 42 (25.93) | 53 (61.63) | 9 (60) |
| Obesity | 7 (5.19) | 22 (17.19) | 14 (8.64) | 14 (16.28) | 1 (6.67) |
| Cardiac failure | 17 (12.59) | 37 (28.91) | 22 (13.58) | 28 (32.56) | 4 (26.67) |
| COPD | 3 (2.22) | 22 (17.19) | 11 (6.79) | 12 (13.95) | 2 (13.33) |
| Tobacco | 8 (5.93) | 30 (23.44) | 17 (10.49) | 19 (22.09) | 2 (13.33) |
| Renal failure | 19 (14.07) | 18 (14.06) | 7 (4.32) | 29 (33.72) | 1 (6.67) |
| Digestive troubles | 33 (24.44) | 27 (21.09) | 36 (22.22) | 24 (27.91) | 0 (-) |
| HIV | 5 (3.7) | 3 (2.34) | 5 (3.09) | 2 (2.33) | 1 (6.67) |
| COVID-19 presentation | |||||
| Days since 1st symptoms * | 3 [0;7] | 4.5 [1;8] | 3.5 [1;7] | 4 [1;7] | 1 [-30;4.75] |
| Cough | 74 (54.81) | 73 (57.03) | 88 (54.32) | 54 (62.79) | 5 (33.33) |
| Dyspnea | 78 (57.78) | 80 (62.5) | 92 (56.79) | 61 (70.93) | 5 (33.33) |
| Fever | 79 (58.52) | 101 (78.91) | 113 (69.75) | 57 (66.28) | 10 (66.67) |
| Digestive troubles | 33 (24.44) | 27 (21.09) | 36 (22.22) | 24 (27.91) | 0 (-) |
| Headaches | 12 (8.89) | 19 (14.84) | 18 (11.11) | 12 (13.95) | 1 (6.67) |
| Myalgia | 22 (16.3) | 10 (7.81) | 19 (11.73) | 12 (13.95) | 1 (6.67) |
| Rashes | 0 (-) | 1 (0.78) | 0 (-) | 1 (1.16) | 0 (-) |
| Agueusia | 12 (8.89) | 7 (5.47) | 14 (8.64) | 5 (5.81) | 0 (-) |
| Anosmia | 10 (7.41) | 9 (7.03) | 13 (8.02) | 6 (6.98) | 0 (-) |
| Thromboembolisms | 7 (5.19) | 7 (5.47) | 7 (4.32) | 5 (5.81) | 2 (13.33) |
| Hematology | |||||
| Benign | 27 (20) | 8 (6.25) | 23 (14.2) | 12 (13.95) | 0 (-) |
| ALL | 8 (5.93) | 3 (2.34) | 9 (5.56) | 1 (1.16) | 1 (6.67) |
| AML | 8 (5.93) | 17 (13.28) | 15 (9.26) | 8 (9.3) | 2 (13.33) |
| HL | 9 (6.67) | 1 (0.78) | 8 (4.94) | 2 (2.33) | 0 (-) |
| NHL | 44 (32.59) | 33 (25.78) | 55 (33.95) | 17 (19.77) | 5 (33.33) |
| CLL | 9 (6.67) | 11 (8.59) | 9 (5.56) | 9 (10.47) | 2 (13.33) |
| Chronic myeloid | 7 (5.19) | 27 (21.09) | 18 (11.11) | 14 (16.28) | 2 (13.33) |
| Myeloma | 23 (17.04) | 28 (21.88) | 25 (15.43) | 23 (26.74) | 3 (20) |
| No chemo last 6 months | 72 (53.33) | 34 (26.56) | 63 (38.89) | 40 (46.51) | 3 (20) |
| Intermediate | 47 (34.81) | 34 (26.56) | 54 (33.33) | 21 (24.42) | 6 (40) |
| Intensive | 14 (10.37) | 9 (7.03) | 15 (9.26) | 6 (6.98) | 2 (13.33) |
| Continuous | 2 (1.48) | 51 (39.84) | 30 (18.52) | 19 (22.09) | 4 (26.67) |
| Biological parameters | |||||
| Neutrophils (/mm3)* | 4,540 [1,700;7,710] | 2,435 [1,490;4,222] | 2,900 [1,230;5,800] | 4,150 [2,240;7198] | 2,660 [2,068;6,375] |
| Lymphocytes (/mm3) * | 800 [400;1685] | 885 [467.5;1,578] | 710 [400;1,300] | 1,120 [490;2,018] | 1,250 [432.5;1,798] |
| Platelets (/mm3) * | 128,000[61,000;213,000] | 116,000[40,500;196,500] | 132,500[53,750;229,000] | 117,500[58,500;175,000] | 63,500[3,8250;221,800] |
| Creatinin (µmol/L) * | 80.44 [62.1;142.3] | 80 [62;116] | 70 [54.81;85.75] | 168.4 [106;323.8] | 92.91 [75.25;107.5] |
| C-reactive Pr (nmol/L)* | 86.7 [43.7;164.4] | 76.5 [36.5;155.8] | 53.3 [29;107] | 151.5 [82;247.6] | 124.2 [90.07;242] |
| LDH (UI/L)* | 345.5 [238.2;591.2] | 518 [310.2;795] | 298.5 [225.5;467.8] | 604 [461.5;880] | 548.5 [493.2;650.8] |
| Ddimers (µg/L)* | 1,549 [961.5;5,230] | 1,190 [670;2,400] | 1,170 [704;2,279] | 2,400 [1,219;7,412] | 4,195 [3,608;4,782] |
| Event/ Outcome | |||||
| ICU admission | 76 (56.3) | 32 (25) | 56 (34.57) | 44 (51.16) | 8 (53.33) |
| ICU direct admission | 7 (5.19) | 15 (11.72) | 8 (4.94) | 13 (15.12) | 1 (6.67) |
| Invasive ventilation | 57 (42.22) | 24 (18.75) | 39 (24.07) | 36 (41.86) | 6 (40) |
| Death | 60 (44.44) | 55 (42.97) | 48 (29.63) | 54 (62.79) | 13 (86.67) |
Compared to Brazilians, French patients were almost ten years older (p < 0.0001). The prevalence of comorbidities was higher among French (78% vs. 56%, p = 0.0002), mainly cardiac failure and COPD. The clinical presentation at admission was similar in the two countries (all p > 0.18), except fever, that was more frequent in the French cohort (78.9% vs. 58.5%, p = 0.0005), and myalgia, that was more evident in the Brazilian group (16.3% vs. 7.8%, p = 0.039)). The proportion of benign diseases was higher in the Brazilian cohort (p = 0.001).
The median follow-up was 63 days (IQR 40;98). The overall in-hospital mortality rate was 115/263 (43.7% [37.6;49.9]). A total of 60 deaths in the Brazilian cohort and 55 deaths among French patients were observed, with no evidence of different overall survival across countries (p = 0.54, Figure 1). Moreover, there was no evidence of survival difference after adjusting for age, comorbidities and diagnosis (HR for France: 0.75, [0.51;1.11], p = 0.15). The ICU admission (56% versus 25%) and invasive ventilation (42% versus 19%) rates were notably higher among Brazilian patients due to scarce ICU beds during the peak of the transmission in France. Parameters associated with a poor survival were (i) patient-related, namely, age, number of comorbidities, cardiovascular disease, chronic renal disease and smoking status; (ii) related to their hematological disease, namely, malignancies, and; (iii) biology-related, namely, low platelet count, high creatinine, C-reactive protein, D-dimers and LDH levels (Supplementary Table SI).

As expected, blood cell counts were highly correlated, while age correlated with the number of comorbidities and creatinine levels (Supplementary Fig. S3A). No clear-cut separation by country origin was observed (Supplementary Fig. S3B), besides the older age of French patients. Similarly, patients overlapped whatever their hematological diagnosis, except for acute leukemia (AL) patients who exhibited low blood cell counts, likely illustrating their treatment-related aplasia (Supplementary Fig. S3C). There was no clear-cut separation regarding the ICU admissions (Supplementary Fig. S3D). In contrast, a slight separation of the survivors from those who died was observed (Supplementary Fig. S3E), possibly related to the patient age and number of comorbidities. Of note, a few outliers were scattered on the top-left of the PCA plot, corresponding to patients in aplasia (Supplementary Fig. S3F).
Semi-supervised learning identifies two profiles differing in comorbidities, inflammation and prognosisA semi-supervised prognosis-driven learning analysis identified two profiles, further labeled Surv.+ and Surv.-, regrouping 162 and 86 patients, respectively (Figure 2A). The Surv.- profile regrouped older patients with increased prevalence of comorbidities, high CRP, LDH, D-dimers and creatinine levels (Figure 2B) and a large proportion of male, myeloma and non-Hodgkin lymphoma (NHL) (Figure 2C). Similar COVID-19 initial presentation was observed in both profiles, except dyspnea, that was more prevalent in the Surv.- profile (71% vs. 57%). The two profiles did not differ on the country origin and included similar proportions of non-malignancies, asymptomatic COVID-19e patients, as well as time from symptoms onset and the hospitalization.
 and acute myeloid leukemia (AML); chronic lymphoid includes Hodgkin lymphoma (HL), non-Hodgkin lymphoma (NHL) and chronic lymphocytic leukemia (CLL). D. Kaplan-Meier survival curves for the prognosis-driven profiles.")
Prognosis-driven profiles - A. Projection of the prognosis-driven profiles obtained by semi-supervised learning. B. Boxplot for continuous parameters for the two prognosis-driven profiles. C. Prevalence of clinical parameters among the two prognosis-driven profiles. Acute leukemia includes acute lymphoblastic leukemia (ALL) and acute myeloid leukemia (AML); chronic lymphoid includes Hodgkin lymphoma (HL), non-Hodgkin lymphoma (NHL) and chronic lymphocytic leukemia (CLL). D. Kaplan-Meier survival curves for the prognosis-driven profiles.
Patients from the two profiles markedly differed in survival outcome (HR 2.72 [1.84; 4.02]; p < 0.0001), with the Surv.- profile being of poor prognosis (Figure 2D). Even after adjusting for well-known poor prognosis factors in the COVID-19 pandemic, such as the patient age, the prognostic value of the two profiles persisted (HR 2.19 [1.45; 3.31]; p = 0.0002), denoting the clinical implications of these profiles. Notwithstanding, the patients from the Surv.- profile experienced more ICU admissions (51% vs. 35%) and needed invasive ventilation (42% vs. 24%). Note that 15 patients remained unclassified due to the absence of consensus. These patients were quite old, with high CRP and D-dimers levels, but with low creatinine levels and a low number of comorbidities (Table 1).
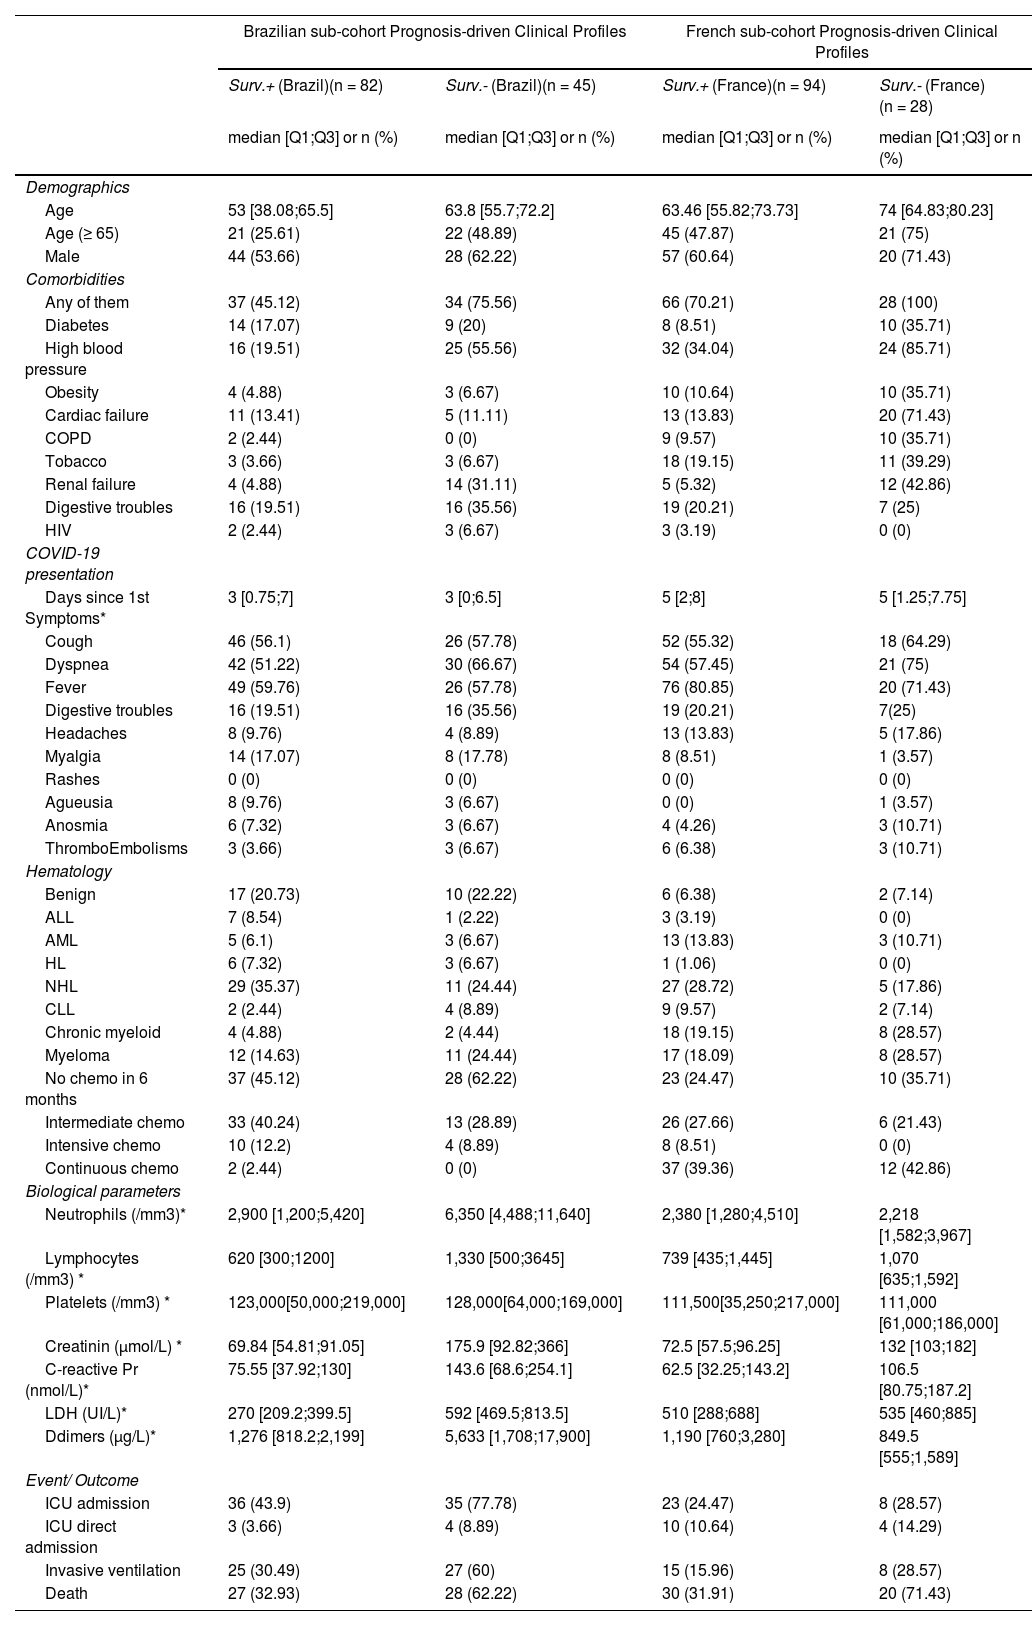
Brazilian- and French-specific analyses highlighted the role of comorbiditiesThe analysis was then conducted on the Brazilian and French cohorts, independently, with close findings, both in terms of clinical characteristics (Table 2) and prognosis (Figure 3). First, the classification obtained by the Brazilian cohort was highly similar to that obtained for the whole cohort. The main differences of the Brazilians (younger, with fewer comorbidities) were reflected in the profile characteristics, with additional differences in neutrophil and D-dimer levels. Similarly, the differences of the French cohort, in terms of comorbidities and creatinine levels, were highlighted in the obtained classification.
Summary of country-specific analyses.
| Brazilian sub-cohort Prognosis-driven Clinical Profiles | French sub-cohort Prognosis-driven Clinical Profiles | |||||||
|---|---|---|---|---|---|---|---|---|
| Surv.+ (Brazil)(n = 82) | Surv.- (Brazil)(n = 45) | Surv.+ (France)(n = 94) | Surv.- (France)(n = 28) | |||||
| median [Q1;Q3] or n (%) | median [Q1;Q3] or n (%) | median [Q1;Q3] or n (%) | median [Q1;Q3] or n (%) | |||||
| Demographics | ||||||||
| Age | 53 [38.08;65.5] | 63.8 [55.7;72.2] | 63.46 [55.82;73.73] | 74 [64.83;80.23] | ||||
| Age (≥ 65) | 21 (25.61) | 22 (48.89) | 45 (47.87) | 21 (75) | ||||
| Male | 44 (53.66) | 28 (62.22) | 57 (60.64) | 20 (71.43) | ||||
| Comorbidities | ||||||||
| Any of them | 37 (45.12) | 34 (75.56) | 66 (70.21) | 28 (100) | ||||
| Diabetes | 14 (17.07) | 9 (20) | 8 (8.51) | 10 (35.71) | ||||
| High blood pressure | 16 (19.51) | 25 (55.56) | 32 (34.04) | 24 (85.71) | ||||
| Obesity | 4 (4.88) | 3 (6.67) | 10 (10.64) | 10 (35.71) | ||||
| Cardiac failure | 11 (13.41) | 5 (11.11) | 13 (13.83) | 20 (71.43) | ||||
| COPD | 2 (2.44) | 0 (0) | 9 (9.57) | 10 (35.71) | ||||
| Tobacco | 3 (3.66) | 3 (6.67) | 18 (19.15) | 11 (39.29) | ||||
| Renal failure | 4 (4.88) | 14 (31.11) | 5 (5.32) | 12 (42.86) | ||||
| Digestive troubles | 16 (19.51) | 16 (35.56) | 19 (20.21) | 7 (25) | ||||
| HIV | 2 (2.44) | 3 (6.67) | 3 (3.19) | 0 (0) | ||||
| COVID-19 presentation | ||||||||
| Days since 1st Symptoms* | 3 [0.75;7] | 3 [0;6.5] | 5 [2;8] | 5 [1.25;7.75] | ||||
| Cough | 46 (56.1) | 26 (57.78) | 52 (55.32) | 18 (64.29) | ||||
| Dyspnea | 42 (51.22) | 30 (66.67) | 54 (57.45) | 21 (75) | ||||
| Fever | 49 (59.76) | 26 (57.78) | 76 (80.85) | 20 (71.43) | ||||
| Digestive troubles | 16 (19.51) | 16 (35.56) | 19 (20.21) | 7(25) | ||||
| Headaches | 8 (9.76) | 4 (8.89) | 13 (13.83) | 5 (17.86) | ||||
| Myalgia | 14 (17.07) | 8 (17.78) | 8 (8.51) | 1 (3.57) | ||||
| Rashes | 0 (0) | 0 (0) | 0 (0) | 0 (0) | ||||
| Agueusia | 8 (9.76) | 3 (6.67) | 0 (0) | 1 (3.57) | ||||
| Anosmia | 6 (7.32) | 3 (6.67) | 4 (4.26) | 3 (10.71) | ||||
| ThromboEmbolisms | 3 (3.66) | 3 (6.67) | 6 (6.38) | 3 (10.71) | ||||
| Hematology | ||||||||
| Benign | 17 (20.73) | 10 (22.22) | 6 (6.38) | 2 (7.14) | ||||
| ALL | 7 (8.54) | 1 (2.22) | 3 (3.19) | 0 (0) | ||||
| AML | 5 (6.1) | 3 (6.67) | 13 (13.83) | 3 (10.71) | ||||
| HL | 6 (7.32) | 3 (6.67) | 1 (1.06) | 0 (0) | ||||
| NHL | 29 (35.37) | 11 (24.44) | 27 (28.72) | 5 (17.86) | ||||
| CLL | 2 (2.44) | 4 (8.89) | 9 (9.57) | 2 (7.14) | ||||
| Chronic myeloid | 4 (4.88) | 2 (4.44) | 18 (19.15) | 8 (28.57) | ||||
| Myeloma | 12 (14.63) | 11 (24.44) | 17 (18.09) | 8 (28.57) | ||||
| No chemo in 6 months | 37 (45.12) | 28 (62.22) | 23 (24.47) | 10 (35.71) | ||||
| Intermediate chemo | 33 (40.24) | 13 (28.89) | 26 (27.66) | 6 (21.43) | ||||
| Intensive chemo | 10 (12.2) | 4 (8.89) | 8 (8.51) | 0 (0) | ||||
| Continuous chemo | 2 (2.44) | 0 (0) | 37 (39.36) | 12 (42.86) | ||||
| Biological parameters | ||||||||
| Neutrophils (/mm3)* | 2,900 [1,200;5,420] | 6,350 [4,488;11,640] | 2,380 [1,280;4,510] | 2,218 [1,582;3,967] | ||||
| Lymphocytes (/mm3) * | 620 [300;1200] | 1,330 [500;3645] | 739 [435;1,445] | 1,070 [635;1,592] | ||||
| Platelets (/mm3) * | 123,000[50,000;219,000] | 128,000[64,000;169,000] | 111,500[35,250;217,000] | 111,000 [61,000;186,000] | ||||
| Creatinin (µmol/L) * | 69.84 [54.81;91.05] | 175.9 [92.82;366] | 72.5 [57.5;96.25] | 132 [103;182] | ||||
| C-reactive Pr (nmol/L)* | 75.55 [37.92;130] | 143.6 [68.6;254.1] | 62.5 [32.25;143.2] | 106.5 [80.75;187.2] | ||||
| LDH (UI/L)* | 270 [209.2;399.5] | 592 [469.5;813.5] | 510 [288;688] | 535 [460;885] | ||||
| Ddimers (µg/L)* | 1,276 [818.2;2,199] | 5,633 [1,708;17,900] | 1,190 [760;3,280] | 849.5 [555;1,589] | ||||
| Event/ Outcome | ||||||||
| ICU admission | 36 (43.9) | 35 (77.78) | 23 (24.47) | 8 (28.57) | ||||
| ICU direct admission | 3 (3.66) | 4 (8.89) | 10 (10.64) | 4 (14.29) | ||||
| Invasive ventilation | 25 (30.49) | 27 (60) | 15 (15.96) | 8 (28.57) | ||||
| Death | 27 (32.93) | 28 (62.22) | 30 (31.91) | 20 (71.43) | ||||

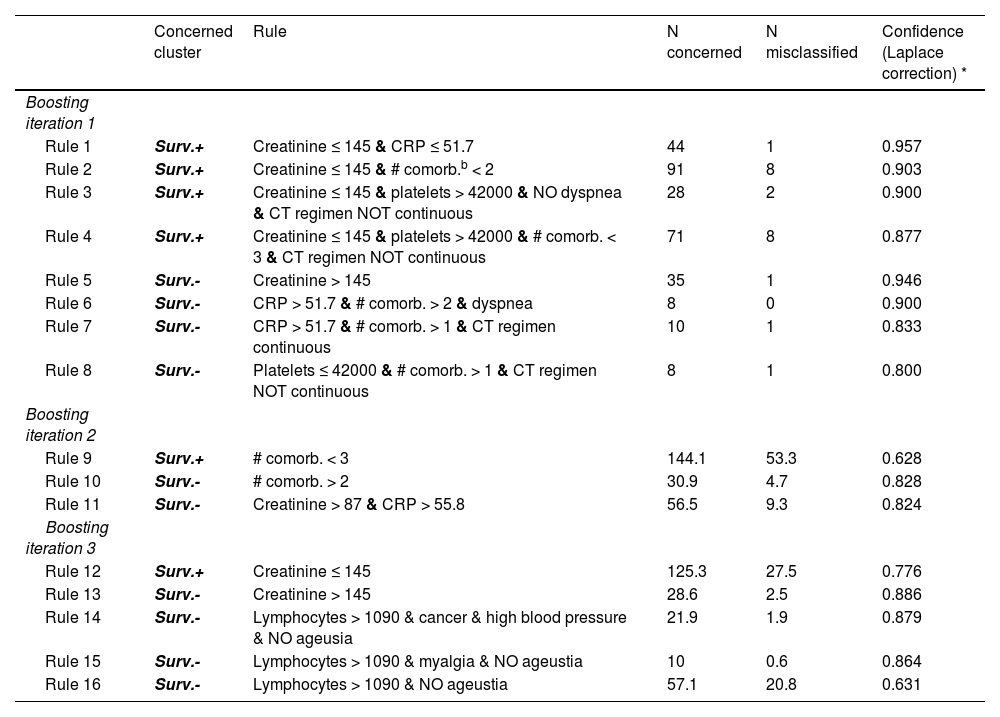
We identified a set of rules to classify patients into the Surv.+ and Surv.- profiles, using only information available at hospital admission. The baseline predictors consecutively selected by the model were the number of comorbidities, creatinine, C-reactive protein, a continuous regimen of chemotherapy, platelets and lymphocytes counts, a symptom of ageusia, dyspnea, malignancy of the hematological disease, high blood pressure and symptom of myalgia (Table 3). Its accuracy was high, namely, 97.7% on the training set and 84.9% on the validation set. We were thus able to label new patients into the Surv.+ and Surv.- profiles, using a simple set of rules on the baseline information.
Classifier rules.
| Concerned cluster | Rule | N concerned | N misclassified | Confidence (Laplace correction) * | |
|---|---|---|---|---|---|
| Boosting iteration 1 | |||||
| Rule 1 | Surv.+ | Creatinine ≤ 145 & CRP ≤ 51.7 | 44 | 1 | 0.957 |
| Rule 2 | Surv.+ | Creatinine ≤ 145 & # comorb.b < 2 | 91 | 8 | 0.903 |
| Rule 3 | Surv.+ | Creatinine ≤ 145 & platelets > 42000 & NO dyspnea & CT regimen NOT continuous | 28 | 2 | 0.900 |
| Rule 4 | Surv.+ | Creatinine ≤ 145 & platelets > 42000 & # comorb. < 3 & CT regimen NOT continuous | 71 | 8 | 0.877 |
| Rule 5 | Surv.- | Creatinine > 145 | 35 | 1 | 0.946 |
| Rule 6 | Surv.- | CRP > 51.7 & # comorb. > 2 & dyspnea | 8 | 0 | 0.900 |
| Rule 7 | Surv.- | CRP > 51.7 & # comorb. > 1 & CT regimen continuous | 10 | 1 | 0.833 |
| Rule 8 | Surv.- | Platelets ≤ 42000 & # comorb. > 1 & CT regimen NOT continuous | 8 | 1 | 0.800 |
| Boosting iteration 2 | |||||
| Rule 9 | Surv.+ | # comorb. < 3 | 144.1 | 53.3 | 0.628 |
| Rule 10 | Surv.- | # comorb. > 2 | 30.9 | 4.7 | 0.828 |
| Rule 11 | Surv.- | Creatinine > 87 & CRP > 55.8 | 56.5 | 9.3 | 0.824 |
| Boosting iteration 3 | |||||
| Rule 12 | Surv.+ | Creatinine ≤ 145 | 125.3 | 27.5 | 0.776 |
| Rule 13 | Surv.- | Creatinine > 145 | 28.6 | 2.5 | 0.886 |
| Rule 14 | Surv.- | Lymphocytes > 1090 & cancer & high blood pressure & NO ageusia | 21.9 | 1.9 | 0.879 |
| Rule 15 | Surv.- | Lymphocytes > 1090 & myalgia & NO ageustia | 10 | 0.6 | 0.864 |
| Rule 16 | Surv.- | Lymphocytes > 1090 & NO ageustia | 57.1 | 20.8 | 0.631 |
The confidence values represent the confidence in each rule to predict its associated class (Concerned cluster).
To predict the profile (Surv.+ or Surv.-) of a new patient, each boosting iteration votes for the profile associated to the rule that is verified by the patient's observation. If more than 1 rule are verified within a boosting iteration, the one with the largest confidence is selected. If no rule is verified of a boosting iteration, the vote goes to the Surv.+ profile by default. If all boosting iterations agree, on a same profile, it is attributed to the patient. Otherwise, the prediction is made according to a sum of profile votes weighted by the rules confidence.
For example, for a patient that verifies rules 2, 4, 11 and 12, the 3 boosting iterations select Rule 2, Rule 11 and Rule 12, respectively, and therefore, 2 votes are recorded for the Surv.+ profile and one for the Surv.- profile. The predicted probability of the Surv.+ profile is (Rule 2 confidence + Rule 12 confidence) / sum of rules 2, 11 and 12 confidences = (0.903 + 0.776)/ (0.903 + 0.776 + 0.824) = 0.67; similarly, the predicted probability for the Surv.- profile is 0.33. Ultimately, the Surv.+ profile is predicted for that patient.
In this paper, we analyzed a binational cohort of hospitalized patients with a hematological disorder and a COVID-19 infection. This allowed us to distinguish elements of the results that were country-specific from those that were country-independent. Firstly, we compared baseline characteristics of patients, according to the country of hospitalization. Compared to Brazilians, French patients were almost ten years older and had more comorbidities. However, at admission, the clinical presentation of the COVID-19 patients was quite similar in the two cohorts. Another difference was that the proportion of benign hematological diseases was higher in the Brazilian cohort. Those baseline differences could have induced a higher mortality rate among French patients. However, there was no evidence of any difference in outcomes across the two populations, even after adjusting for those baseline differences. In both cities, patients were treated at a university hospital, where all the supportive care and treatment protocols seemed to be the same. However, some studies have speculated that demographics, including ethnicity and socioeconomic factors, may influence COVID-19 mortality rates in Brazil,20-22 which possibly counterbalanced the pejorative effect of age and comorbidities in France.
Despite those differences and because of them, we aimed to provide patient profiles of COVID-19 patients with hematological diseases, to better understand their presentation and outcome, using those two cohorts. Based on a semi-supervised learning approach, we found two distinct profiles involving age, comorbidities and biological parameters previously identified as being associated with COVID-19 severity in the literature, such as CRP, D-dimers, LDH and creatinine levels.23 In contrast, the initial clinical presentation and country of origin were found to be less informative. Regarding the hematological diseases, most of the information was obtained from lymphomas, as opposed to myelomas. A set of rules was identified using only baseline information, allowing for the sorting of new patients into the two prognosis-driven profiles.
Other main findings could be highlighted. First, it seems that there were only a few specificities of this hematological population, regarding the SARS-CoV-2 infection, compared to non-hematological patients requiring hospital admission. Secondly, the COVID-19 appeared rather similar in the initial clinical presentation and outcome in both countries, even if the specificities of the two populations (notably their differences in age distribution and comorbidities) may be highlighted. Overall, the country-specific learning analyses emphasized those specificities: the younger age of Brazilians versus the multiple comorbidities of the French. Interestingly, these country-dependent specificities faded at the population level, as the profiles identified with the whole cohort mostly relied on parameters, such as the CRP level or the number of comorbidities, independently of the country origin.
Our study has some limitations. First, it used only a sample of 263 patients, while huge samples of thousands of COVID-19 patients have been analyzed, with country-specific cohorts,9 or with multinational cohorts.3 Nevertheless, we focused on patients with a hematological disease, a population in which the SARS-CoV-2 infection was not widely studied,3 and mostly within large and broad cancer cohorts.24,25 The data collection used two different databases, though recorded information was largely standardized across the two countries, regarding both the SARS-CoV-2 infection and the hematological disease. We used a semi-supervised learning approach, rather than a multivariable Cox model, as commonly used in this setting. However, identifying profiles from a survival analysis would not ensure the accountability of the variability and heterogeneity in the original data. On the contrary, it is the aim of the semi-supervised approach to identifying patterns of associated variables. Moreover, the semi-supervised strategy allows for a large number of variables to be dealt with, whatever the number of events, contrary to survival models. Furthermore, in semi-supervised learning, the partition is constructed by analyzing variable associations, while those must be individually specified in survival analysis.
Second, all collected data relate to patients who contracted the SARS-CoV-2 in the first year of the COVID-19 pandemic, that is, to the first wave and part of the second wave, in both countries studied. The situation related to the COVID-19 infection evolves rapidly and treatments and care strategies have also evolved, notably with the availability of vaccines. However, the dynamics of the epidemic, as well as vaccination rates, have been very heterogeneous across the world. This study brings insights on the prognostic value of standard laboratory markers for patients with a hematological disorder and affected by COVID-19, which may be directly relevant in countries with low vaccination rates. Moreover, this study also proposes a framework for analyzing COVID-19-related data, which is identifying prognosis-related patient profiles through semi-supervised learning. This analysis framework could be applied to other cohorts of COVID-19-affected patients, or to any other severe infections.
ConclusionIn conclusion, in this study, a novel analysis strategy was used, which consisted in identifying clinical-based patient profiles that directly relate to a survival outcome. We were thus able to identify two profiles of hospitalized hematological patients infected with SARS-CoV-2 who differed in outcomes. These profiles mainly differed on age, number of comorbidities and four standard biology markers: CRP, D-dimers, LDH and creatinine. The profiles appeared to be non-specific of the country specificities. These prognostic profiles should be confirmed in further analyses, using larger or more recent cohorts.
FundingThis research did not receive any specific grant from funding agencies in public, commercial, or not-for-profit sectors.
Author contributionsLBOA and VR recorded the data from Brazil. SC recorded the data from France. SC performed the data integration. LF performed the data analysis. LF, LBOA, SC and VR wrote the article. All authors read and approved the final manuscript.
Supporting informationFigure S1. Flow Chart of the study and histogram of the hospital admission dates, according to country origin.
Figure S2. Contribution of the categorical variables to the archetype.
Figure S3. Principal component analysis. A. Projection of the continuous variables (correlation circle). Arrows indicate the contribution of the variables to the PCA projection, for example, a patient with a high (resp. low) neutrophil count will tend to be on the bottom-right (resp. top-left) corner, while older patients with tend to be on the top-right corner. Additionally, overlapping arrows indicate correlated variables; right-angled arrows indicate independent variables. B-F. Projection of the patients, with color according to country (B), hematological diagnosis (C) ICU admission (D), survival status of the patient, and; (E) aplasia (F). Interpretation can be made according to panel A, for example, patients in aplasia (panel F) are the ones with low neutrophils, lymphocytes and platelets counts.
Table SI. Predictive factors of death.
The Saint Louis CORE group is a collaborating group of clinicians, radiologists, biologists, pharmacists and clinical research assistants of the Saint Louis Hospital. They all have participated in the care of patients with COVID-19 and/or to research into COVID-19 at the Saint Louis Hospital, Paris, during the SARS-COV2 epidemic. They decided to share their data to enhance the local research on COVID-19.
The authors thank the members of the Saint Louis CORE group: Achili Y, Ades L, Aguinaga L, Archer G, Benattia A, Bercot B, Bergeron A, Bertinchamp R, Bondeelle L, Bouaziz JD, Bouda D, Boutboul D, Brindel Berthon I, Bugnet E, Caillat Zucman S, Celli Lebras K, Chabert J, Chaix ML, Chevret S, Clément M, Davoine C, De Castro N, De Kerviler E, De Margerie-Mellon C, Delaugerre C, Denis B, Depret F, Djaghout L Dupin C, Farge-Bancel D, Fauvaux C, Feghoul L, Feredj E, Feyeux D, Fontaine JP, Fremeaux-Bacchi V, Galicier L, Garestier J, Harel S, Jegu AL Kozakiewicz E Lebel M Baye A, Le Goff J, Le Guen P, Lengline E, Liegeon G, Lorillon G, Madelaine Chambrin I, Mahjoub N, Martin de Frémont G, Maylin S, Meunier M, Molina JM, Morin F, Oksenhendler E, Peffault de la Tour R, Peyrony O, Plaud B, Raffoux E, Rouveau M, Salmona M, Saussereau J, Schnepf N, Soret J, Thegat M, Tremorin MT and Vallet N.


