


Oncohematological patients require the evaluation for possible infiltration of the central nervous system (CNS) by neoplastic cells at diagnosis and/or during the monitoring of the chemotherapeutic treatment. Morphological analysis using conventional microscopy is considered the method of choice to evaluate the cerebrospinal fluid (CSF) samples, despite technical limitations.
ObjectiveThis study aimed to compare the performance of the cytomorphology and flow cytometric immunophenotyping (FC) in the detection of CNS infiltration.
MethodWe evaluated 520 CSF samples collected from 287 oncohematological patients for whom the detection of neoplastic cells was simultaneously requested by cytomorphology and FC.
ResultsLaboratory analyses revealed 435/520 (83.7%) conclusive results by the two methods evaluated, among which 385 (88.5%) were concordant. Discordance between the methods was observed in 50/435 (11.5%) samples, 45 (90%) being positive by FC. Furthermore, the FC defined the results in 69/72 (95.8%) inconclusive samples by cytomorphology. The positivity of FC was particularly higher among hypocellular samples. Among 431 samples with a cell count of < 5/μL, the FC identified neoplastic cells in 75 (17.4%), while the cytomorphology reported positive results in 26 (6%). Among the samples that presented adequate cell recovery for evaluation by both methods (506/520), the comparative analysis between FC and cytomorphology revealed a Kappa coefficient of 0.45 (CI: 0.37–0.52), interpreted as a moderate agreement.
ConclusionThe data showed that the CSF analysis by FC helps in the definition of CNS infiltration by neoplastic cells, particularly in the cases with dubious morphological analysis or in the evaluation of samples with low cellularity.
Evaluation of central nervous system (CNS) infiltration by neoplastic cells is indicated for the classification and staging of hematological neoplasms, such as acute leukemias and lymphomas. The investigation is usually performed at diagnosis and periodically during the monitoring of the chemotherapeutic treatment of these conditions.1-5
Conventional microscopy (cytomorphology) is considered the method of choice for the analysis of cerebrospinal fluid (CSF) samples to define the presence of CNS infiltration.2,3,6 However, this methodology has certain limitations, such as the scarcity of cells to be evaluated because of the limited volume and the hypocellularity of the CSF samples, in addition to the possible technical difficulty in distinguishing normal from neoplastic cells.1,4-10
Flow cytometry (FC) has been used as a complementary method in the investigation of neoplastic cells in CSF samples by specialized laboratories. It brings us the advantages of high analytical sensitivity and ability to differentiate normal from neoplastic cells with a high degree of certainty, considering as a reference the aberrant immunophenotype of the neoplastic cell detected at diagnosis in bone marrow and/or venous blood samples by the same methodology.1,5,6,10-16
At our service, the FC was made available in the clinical laboratory for the investigation of neoplastic cells in CSF samples and other body fluids in 2011. This analysis has been routinely performed as a complementary method to cytomorphology in the first CSF sample obtained from children and adolescents with acute lymphoid leukemia (ALL) to evaluate the CNS involvement in the diagnosis, which is associated with greater aggressiveness of the disease. To analyze samples collected during the monitoring of the ALL chemotherapy treatment, the FC evaluation has been requested to confirm positive morphology findings and/or to clarify questionable morphological analyses. In view of the clinical suspicion of the CNS involvement in ALL and other oncohematological diseases, the analysis by FC has been performed in a complementary manner to cytomorphology on request by the attending physician.
The primary objective of this study was to describe the laboratory findings regarding CSF samples obtained from patients with hematological neoplasms (2011 - 2019) and simultaneously analyzed by cytomorphology and FC, with the aim of comparing the performance of both methodologies in the detection of CNS infiltration by neoplastic cells.
Materials and methodsThis is a retrospective study performed with the data collection of the participants in the laboratory computerized system. The patients included were those submitted to the collection of CSF samples in the routine of diagnosis, treatment and/or monitoring of the respective disease processes. No sample was collected or analyzed for the sole purpose of research. This study was approved by the Institutional Research Ethics Committee.
PatientsThe study included 287 patients (147 children/adolescents and 140 adults) seen at a university hospital with their clinical condition under investigation or an established diagnosis of oncohematological disease and who had been submitted to the collection of one or more CSF samples for neoplastic cell detection using the cytomorphology and FC methods in the period between April 2011 and September 2019.
The study population included patients with B-lineage acute lymphoblastic leukemia (B-ALL; 97 children and 34 adults), T-cell acute lymphoblastic leukemia (T-ALL; 19 children and 12 adults), acute myeloid leukemia (AML; 32 patients), chronic lymphoproliferative disease (B-CLPD: 65; T-CLPD: 10), chronic myeloid leukemia (CML; 7), Hodgkin's lymphoma (2), and others, with neurological symptoms to be clarified, suspected of unconfirmed oncohematological disease (9). To summarize, 520 CSF samples collected at diagnosis, for which the investigation of neoplastic cells was simultaneously requested by cytomorphology and FC, were evaluated for recurrence or follow-up of the above-described patients.
MethodsThe CSF samples were collected in the patient care routine at an outpatient or hospital level by the attending physician of each case, adequately trained for the procedure. The samples collected (∼3 – 5mL) were aliquoted for shipment to the laboratory sectors responsible for the conventional CSF analysis and for the FC immunophenotyping.
The conventional analysis by microscopic examination included cell counts (red blood cells and leukocytes) performed in a counting chamber (Neubauer Chamber), with the results expressed in cells per microliter of sample (cells/µL). Subsequently, a differential leukocyte count with screening for neoplastic cells was performed on a slide obtained by cytocentrifugation of the sample and stained using the May-Grunwald-Giemsa method.
For FC analysis, samples were processed in the first 4 hours after the CSF collection because no preservative material was used. The samples were centrifuged for cell concentration and the sediment was distributed in 2 or 3 tubes (100 µL in each tube) for labeling with monoclonal antibodies, according to the panel defined for each case. After the addition of the monoclonal antibodies, the samples were incubated in a dark chamber at room temperature for 20 minutes. Following that, a red blood cell lysis solution (diethylene glycol, formaldehyde and sodium citrate) was added to the reaction tubes, which were incubated for 10 minutes, centrifugated and washed with isotonic solution. The sample acquisition was performed using the BD FACSCalibur Flow Cytometer System (Becton Dickinson, San Jose, CA, USA). The CellQuestTM program was used for data acquisition and for analyzing the results.
The panels of monoclonal antibodies used to analyze each sample were composed of markers conjugated to four distinct fluorochromes, i.e., fluorescein isothiocyanate (FITC), phycoerythrin (PE), chlorophyll pyridine protein (PerCP) and allophycocyanin (APC). The panels included one tube to investigate mature T-cell lines (CD3/CD8/CD45/CD4) and one or two tubes with antibody combinations selected according to the neoplastic cell immunophenotype defined at diagnosis in bone marrow or peripheral blood samples. The most frequently used combinations of antibodies by diagnostic category were: B-ALL: CD10/CD34/CD45/CD19 and CD10/CD38/CD45/CD19; T-ALL: CD1a/CD7/CD45/CD3, CD5/CD34/CD45/CD3 and TCRαβ/CD34/CD45/CD3; AML: CD13/CD117/CD45/CD33 and CD13/CD34/CD45/CD33; B-CLPD: CD10/CD19/CD20/CD45 and CD5/CD10/CD20/CD45; T-CLPD: CD1a/CD10/CD45/CD3, CD1a/CD7/CD45/CD3 and TCRαβ/TCRγδ/CD45/CD3, among others. Eventually, the CSF samples were processed without prior information to investigate primary CNS lymphomas.
Due to the low cellularity characteristic of the CSF samples, the acquisition of all events present in each tube was standardized. Samples that did not demonstrate identifiable cell cluster formation in the analysis of physical parameters (size and internal complexity) and CD45 expression were considered inconclusive due to the “absence of adequate cell recovery for analysis”. In the eventual cases of samples with high cellularity, the quantitative level of 20,000 events was reached.
The exclusion of debris was performed as the first step of the analysis procedure by selecting the cell cluster to be studied in a gate in the FSC (Forward Scatter) x SSC (Side Scatter) dot plot graph. The strategic analysis comprised selecting neoplastic cells (precursors or mature) by physical parameters (size and internal complexity), CD45 expression, expression of lineage markers (B-lymphoid, T-lymphoid, or myeloid) and aberrant antigen expressions.
The samples were considered positive for neoplastic cells when meeting the criteria for detecting a cluster of at least 10 events with the same immunophenotypic profile defined at diagnosis for each case.6,15Figure 1 shows the strategic analysis used.
 samples using flow cytometry. The case illustrated refers to a diagnosis of B-ALL from our series, with the immunophenotype CD45+weak, CD10+, CD19+ and CD38+, which presented, in a CSF sample collected in the D15 of chemotherapy treatment, a zero nucleated/µL cell count, negative research of blasts by cytomorphology and positive result for the presence of blasts by flow cytometry. In the flow cytometry analysis, the neoplastic precursor cells were initially selected by the physical characteristics (R2), the CD45+weak expression (R8) and the CD19 lineage marker (R7). The expression of the aberrant markers CD10 and CD38 was evaluated in the G15 region, formed by the combination of R7 + R8. The finding of a cluster of 22 cells with the same phenotypic profile characterized at diagnosis defined the positive result for examining neoplastic cells in this sample.")
Analysis model of neoplastic cell research in cerebrospinal fluid (CSF) samples using flow cytometry. The case illustrated refers to a diagnosis of B-ALL from our series, with the immunophenotype CD45+weak, CD10+, CD19+ and CD38+, which presented, in a CSF sample collected in the D15 of chemotherapy treatment, a zero nucleated/µL cell count, negative research of blasts by cytomorphology and positive result for the presence of blasts by flow cytometry. In the flow cytometry analysis, the neoplastic precursor cells were initially selected by the physical characteristics (R2), the CD45+weak expression (R8) and the CD19 lineage marker (R7). The expression of the aberrant markers CD10 and CD38 was evaluated in the G15 region, formed by the combination of R7 + R8. The finding of a cluster of 22 cells with the same phenotypic profile characterized at diagnosis defined the positive result for examining neoplastic cells in this sample.
The BD Calibrite beads (Becton Dickinson, San Jose, CA, USA) were used to adjust instrument settings, set fluorescence compensation and check instrument sensitivity daily before sample processing.
The data were analyzed using descriptive statistics. The Kappa coefficient was used for analyzing concordance between the laboratory methods evaluated (cytomorphology and FC) and was interpreted according to the following classification: 0 - 0.19 (very weak); 0.20 - 0.39 (weak); 0.40 - 0.59 (moderate); 0.60 - 0.79 (substantial), and; 0.80 - 1.0 (almost perfect).
ResultsAmong the 520 CSF samples evaluated, 246 (47.3%) were collected from children and adolescents under the age of 18 years and 274 (52.7%) from those aged 18 years and over.
The ALL was the main indication for detection of CNS infiltration by neoplastic cells in children and adolescents (207/246 samples; 84.1%), especially B-ALL (163/246 samples; 66.3%). In patients older than 18 years, the main associated conditions were chronic lymphoproliferative diseases (96/274 samples; 35%), B-ALL (93/274 samples; 33.9%) and T-ALL (42/274 samples; 15.3%).
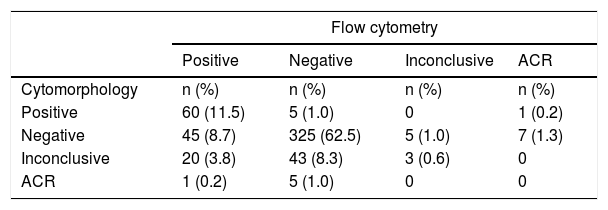
Laboratory analyses revealed 435/520 (83.7%) conclusive results for the investigation of neoplastic cells by the two methods evaluated, i.e., results reported as positive or negative using cytomorphology and FC. Seventy-one results (13.7%) were reported as inconclusive (indeterminate) by at least one of the methods (63 by cytomorphology, 5 by CF and 3 by both). Fourteen samples (2.7%) did not have cells recovered for analysis by one of the methods (6 by cytomorphology and 8 by FC).
Among the samples with conclusive results by both methods, 385/435 (88.5%) showed agreement between them, with 325/385 (84.4%) negative and 60/385 (15.6%) positive for the detection of neoplastic cells.
Disagreement between the methods was verified in 50/435 (11.5%) samples with conclusive results. In these cases, the FC analysis identified neoplastic cells in 45/370 (12.2%) samples considered negative by cytomorphology and ruled out CNS infiltration in 5/65 (7.7%) samples defined as positive by morphological analysis. Table 1 shows a description of the reported results.
Description of the results of the detection of neoplastic cells in the cerebrospinal fluid samples analyzed using the cytomorphology and flow cytometry (n = 520).
ACR: absence of cell recovery for analysis.
Considering the samples inconclusive by cytomorphology and those that did not have cells recovered for analysis by this method (72 samples), the evaluation by FC showed the presence of neoplastic cells in 21/72 (29.2%) and ruled out CNS infiltration in 48/72 (66.7%). Three samples out of 72 (4.2%) remained without elucidation.
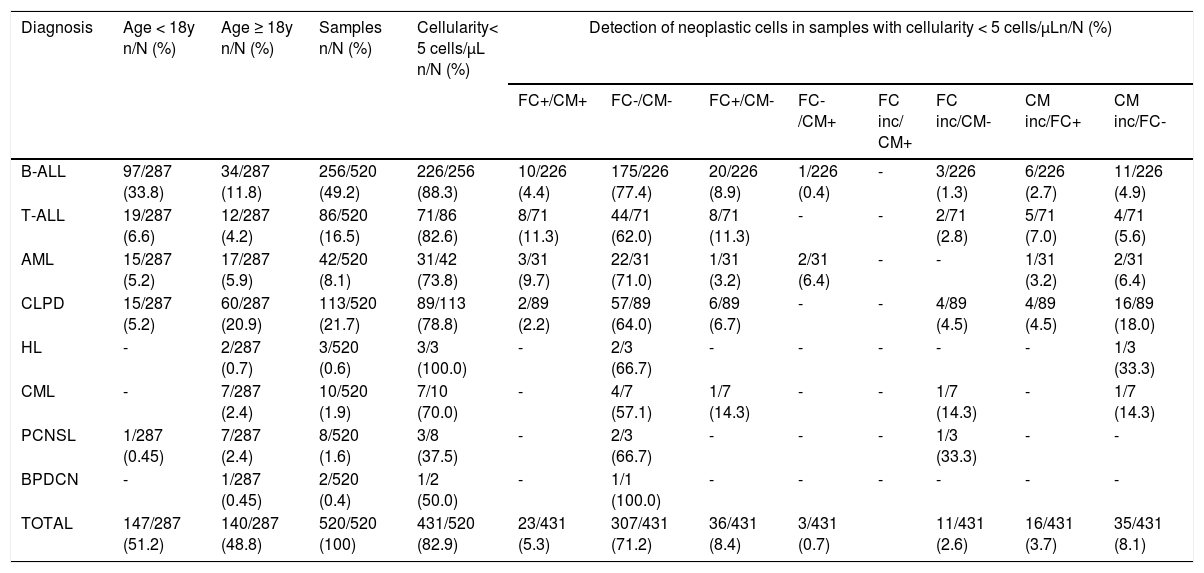
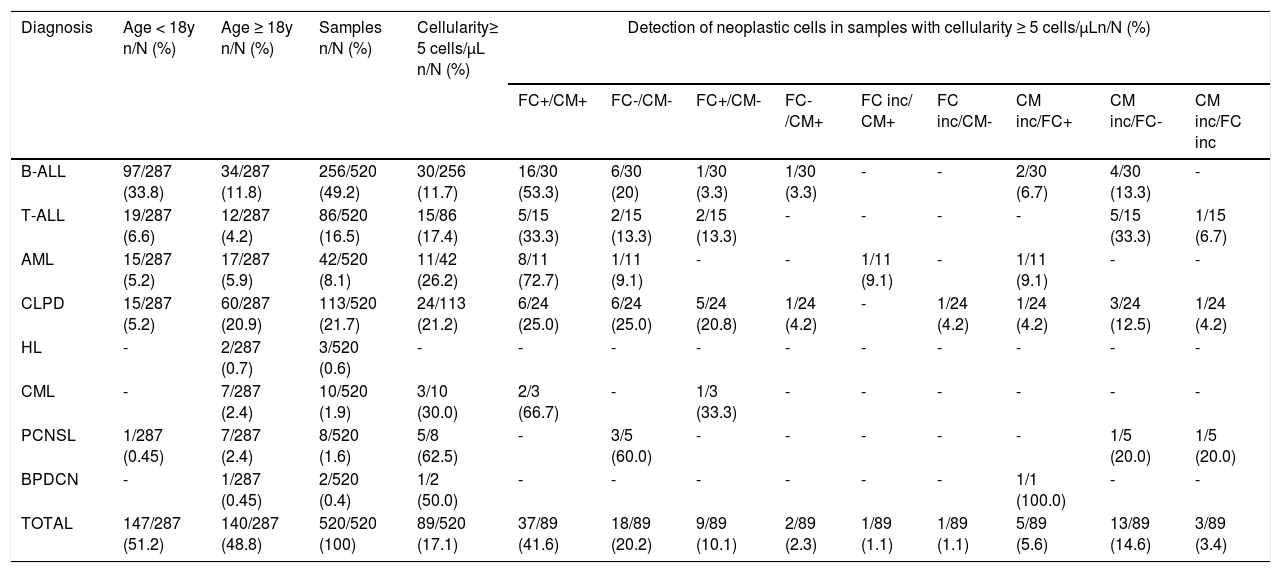
The data analysis of CSF samples with leukocyte counts less than 5/µL (431/520; 82.9%) revealed that the FC clarified the 51 (11.8%) inconclusive cytomorphology results (16 positives and 35 negatives by FC), including samples that had no cells recovered for morphological analysis. In addition, the FC evidenced the presence of neoplastic cells in 36/343 (10.5%) samples considered negative by cytomorphology. Tables 2and3 show the distribution of neoplastic cell detection results using cytomorphology and FC in the total of samples analyzed (520), stratified by diagnosis and according to normal (< 5 cells/µL) or increased (≥ 5 cells/µL) cellularity, respectively.
Distribution of the results of neoplastic cell detection using the cytomorphology and flow cytometry in the cerebrospinal fluid samples with normal cellularity (< 5 cells/µL), stratified according to the diagnosis.
FC: flow cytometry; CM: cytomorphology; FC inc: flow cytometry inconclusive; CM inc: cytomorphology inconclusive; B-ALL: B-lineage acute lymphoblastic leukemia; T-ALL: T-cell acute lymphoblastic leukemia; AML: acute myeloid leukemia; CLPD: chronic lymphoproliferative disease; HL: Hodgkin's lymphoma; CML: chronic myeloid leukemia; PCNSL: primary central nervous system lymphoma; BPDCN: blastic plasmacytoid dendritic cell neoplasm.
*For purposes of plotting the data, inconclusive results included samples that did not show cell recovery for analysis by the respective method.
Distribution of the results of the neoplastic cell detection using the cytomorphology and flow cytometry in cerebrospinal fluid samples with increased cellularity (≥ 5 cells/µL), stratified according to the diagnosis.
FC: flow cytometry; CM: cytomorphology; FC inc: flow cytometry inconclusive; CM inc: cytomorphology inconclusive; B-ALL: B-lineage acute lymphoblastic leukemia; T-ALL: T-cell acute lymphoblastic leukemia; AML: acute myeloid leukemia; CLPD: chronic lymphoproliferative disease; HL: Hodgkin's lymphoma; CML: chronic myeloid leukemia; PCNSL: primary central nervous system lymphoma; BPDCN: blastic plasmacytoid dendritic cell neoplasm.
*For purposes of plotting the data, inconclusive results included samples that did not show cell recovery for analysis by the respective method.
Considering only the samples obtained from children and adolescents under 18 years of age diagnosed with ALL, 182/207 (87.9%) were found to have low cellularity (< 5 cells /µL), of which 174 (95.6%) were negative or inconclusive for blast detection using cytomorphology, or yet did not show cells recovered by cytocentrifugation for analysis using this method. Of these, 26/174 (14.9%) presented blasts detected by the FC, which allowed for the classification definition for CSF infiltration as CNS-2 (< 5 cells/µL with the presence of blasts).
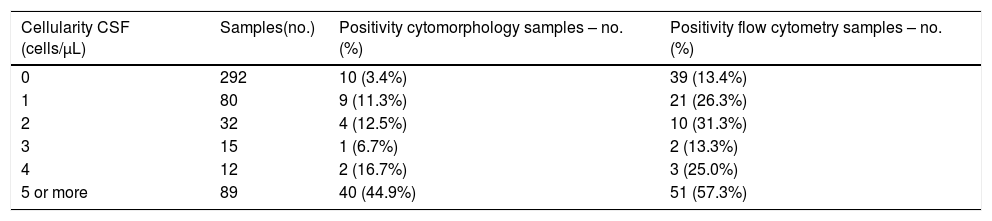
Among the 520 samples that were evaluated, the positivity for the detection of neoplastic cells was higher in the FC analysis, compared to the cytomorphology method, especially in the CSF samples with low cellularity, as shown in Table 4.
Distribution of the results of the CSF analyses (n = 520), stratified according to the cellularity of the samples, in relation to the positivity for the detection of neoplastic cells using the cytomorphology and flow cytometry.
CSF: cerebrospinal fluid; cells/µL: nucleated cells/µL; no.: number.
The comparative analysis between the conclusive results by the two methods (n = 435) showed 88.5% of concordance between cytomorphology and FC, with a Kappa coefficient of 0.64 (CI: 0.55 to 0.73), indicative of substantial agreement. By including samples with inconclusive results by one or both methods in the calculations (n = 506), a decrease in the concordance rate (76.7%) and the Kappa coefficient: 0.45 (CI: 0.37 to 0.52) was now interpreted as a moderate agreement. Analysis by the diagnostic category (for those with a minimum of 10 samples evaluated) revealed a substantial agreement between the FC and cytomorphology methods only in AML, with a Kappa coefficient of 0.63 (CI: 0.43 to 0.84). The other categories showed weak (CLPD and CML) to moderate (B-ALL and T-ALL) agreement.
Moreover, it is important to report the contribution of immunophenotyping by the FC in the diagnosis clarification of certain less common isolated cases. As an example, we can mention the case of an adult patient diagnosed with T-cell lymphoblastic lymphoma defined from an immunohistochemical study of the lymph node, without signs of neoplastic infiltration in the bone marrow. This patient had a modified diagnostic conclusion after the CSF analysis showing increased cellularity (14 cells/µL) with the detection of atypical lymphoid cells by cytomorphology and immunophenotype compatible with adult T-cell lymphoma/leukemia (CD3+/CD4+ cells with loss of CD7 expression).
DiscussionThe investigation of CNS involvement in patients with oncohematological diseases is routinely performed and considered as an essential tool for defining clinical management in many cases. The detection of neoplastic cells in CSF samples by cytomorphology represents the method traditionally used for this purpose and is still considered to be the method of choice.2,3,6 The finding of an increased number of nucleated cells (≥ 5 cells/µL) with characteristic morphological changes defines the CNS involvement by the neoplasm in question and undoes the requirement for complementary analyses. However, considering the usual hypocellularity of these samples and the eventual technical difficulty in morphological distinction between normal and neoplastic cells, it is desirable to incorporate complementary methods in the laboratory routine. In this study, a significantly higher number of inconclusive results was observed by cytomorphology in which the definitive characterization of suspected cells was not possible. This important limitation of the morphological method may be related to the level of technical training of the observer; however, doubts in the analysis may also arise due to the presence of discrete morphological changes presented by normal cells secondary to the chemotherapy treatment which hinders the definition of the result. Added to these are the cases in which the cytocentrifugation of the sample did not allow for the adequate recovery of the cells for morphological evaluation. The analyses in this study revealed that it was possible to define the results in more than 95% of the samples initially inconclusive by morphology by adding the evaluation by the FC method, which allows for the characterization of the aberrant antigen expression of the neoplastic cell. It is noteworthy that approximately 30% of these results were reported positive for the presence of neoplastic cells with an impact on the therapeutic management of the patients.
Relevant findings were observed in children and adolescents with ALL in which the CNS infiltration by leukemic blasts is considered a poor prognostic factor, thus determining the intensification of chemotherapeutic treatment by different clinical protocols.17 The CNS infiltration is defined by the presence of at least 5 nucleated cells/µL in the sample, associated with the detection of blasts by cytomorphology (CNS3). However, even in samples with low cellularity (< 5 cells/µL), the presence of blasts in the CSF at diagnosis or during treatment monitoring is associated with a higher incidence of CNS recurrence, thus justifying the adoption of additional therapeutic measures.13,14,18,19 As shown in this study, the FC presents better performance in the detection of blasts in CSF samples with low cellularity, assisting in the classification of CNS2 (< 5 cells/µL, with the presence of blasts). As observed, the FC allowed for the classification of 26/174 (14.9%) negative or inconclusive samples by cytomorphology as CNS2. These patients received intensifying treatment with extra doses of intrathecal chemotherapy, according to the clinical protocol adopted by the institution, which provides for treatment with variable intensity, based on the risk stratification. However, it is important to emphasize that the clinical significance and the prognostic impact of CNS2 on childhood ALL are still controversial in the literature, especially regarding the detection of blasts solely by the FC.14,16,17,19,20
Regarding the discordant results between the two techniques, which occurred in 11.5% of the 435 samples with conclusive results by both methods, a higher positivity in the FC was observed, as neoplastic cells were detected by the FC in 12.2% of the samples considered negative by cytomorphology. This is an expected finding, as the flow cytometer allows for the recovery of a significantly larger number of cells for analysis, compared to CSF cytocentrifugation for making microscope slides, which contributes to the higher sensitivity of the method in detecting neoplastic cells in hypocellular samples. These results are in agreement with the findings of other studies that also demonstrated greater sensitivity of the FC in the detection of neoplastic cells in CSF samples, especially in those with normal cell counts (< 5 cells/µL). Bento et al.5 analyzed 414 samples, defining 72 positive by the FC and 35 by the cytomorphology, 55.6% of which presented < 5 cells/µL; Quijano et al.6, in an analysis of 123 samples from patients with B-Cell Non-Hodgkin's Lymphoma, found 27 positive by the FC and only 7 positive by the cytomorphology, with simultaneous positivity by both methods being higher in hypercellular samples; Hedge et al.11 analyzed 51 samples from patients with B-cell lymphomas and detected occult/subclinical CNS involvement in 11 samples by the FC, only one of which was also positive by cytomorphology; Bromberg et al.12 analyzed 219 samples from patients with hematologic malignancies at diagnosis and found 44 positive by the FC and 19 positive by the cytomorphology, with a higher positivity of the cytomorphology being associated with higher cell counts; Martínez-Laperche et al.13 evaluated 108 children with ALL at diagnosis, defining subclinical CNS involvement by the FC in 30 samples (27.8%) and by the cytomorphology in only 3 samples (2.8%), and; Domingues et al.21 reported that, among 72 samples of patients with CNS infiltration, 40 (55.6%) were positive by the FC and cytomorphology, 26 (36.1%) were positive only by the FC and 6 (8.3%) were positive only by the cytomorphology and that the positivity of the cytomorphology was higher in patients with higher cell counts.
The FC has also shown value in disregarding the presence of neoplastic cells in 7.7% of the samples considered positive using cytomorphology. The false-positive results of the morphological analysis can be justified by the possible technical difficulty in distinguishing normal from neoplastic cells, as previously mentioned. In these cases, by characterizing the normal antigenic expression of the analyzed cells, the FC removed the possibility of CNS infiltration raised by the morphological analysis.
It is interesting to note that, when evaluating the concordance between methods by diagnostic category, substantial agreement was found only in the AML. It is reasonable to think that this finding is due to the greater accuracy in the morphological characterization of myeloblasts, compared to lymphoblasts or atypical lymphoid cells.
Furthermore, it is worth mentioning that the benefit of the CSF analysis by the FC may be extended to cases in which no other materials are available for analysis, such as primary CNS lymphomas, without medullary infiltration or circulating neoplastic cells. In these situations, the immunophenotyping of atypical cells present in the CSF can directly assist in the classification of neoplasia and in the definition of the diagnosis.
This study allowed us to analyze data from numerous CSF samples that were obtained from patients with different hematologic malignancies and evaluated simultaneously by the FC and cytomorphology. Among the limitations presented, it is important to highlight the attainment of samples without the use of stabilization media (Transfix® or RPMI 1640), which aim to provide cell preservation. The literature is emphatic in recommending the use of these media, as the CSF samples are characteristically hypocellular and may present rapid cell degeneration after collection.4-6,12 However, stabilization media are not available in the laboratory routine at our service. To overcome this issue, we only processed samples collected at our institution, provided they had been received within a maximum period of 4 hours after collection. It is worth mentioning that other authors adopted a similar standardization.1,11,14,15 Another limitation presented refers to the variation between panels of monoclonal antibodies used for the FC analyses, which may have impaired the comparison of results between samples. However, as we predominantly processed samples from patients with an established diagnosis of hematologic malignancy and therefore, with an immunophenotype already defined in a bone marrow or peripheral blood sample, we chose to define the panel based on the aberrant immunophenotype, selecting the most informative markers for each case to achieve a better test performance.
ConclusionTo summarize, we can observe that the data collected in this study showed that the CSF analysis by the FC helps in the definition of CNS infiltration by neoplastic cells, especially in cases that present with dubious morphological analysis or in the evaluation of samples with low cellularity. Therefore, the availability of the FC as an additional method in the morphological evaluation of the CSF is desirable, particularly in the reference services for the care of hematological neoplasms.
Author contributionRocha JMC, Murao M, Cancela CSP and Oliveira BM contributed equally to the study design, analysis and interpretation of data, drafting the article and revising it. Oliveira LP, Perim LP and Santos JP contributed to the data collection and database assembly and participated in the data analysis. All authors approved the final version of the submitted article.


