
The ETV6-RUNX1 is a fusion gene associated with a good outcome in B-cell precursor lymphoblastic leukemia.
ObjectiveThis study aimed to re-evaluate the CD9 cellular expression by flow cytometry (FC) as a possible tool to predict the presence of ETV6-RUNX1.
MethodChildhood B-cell precursor lymphoblastic leukemia cases were included (n=186). The percentage of CD9-labeled cells and the median fluorescence intensity ratio were used for correlation with the molecular tests. Receiver Operating Characteristic curves were performed to determine the likelihood of the CD9 expression predicting ETV6-RUNX1.
ResultsThe ETV6-RUNX1 was found in 44/186 (23.6%) cases. Data analysis revealed that the best cutoff for CD9 percentage was 64%, with an accuracy of 0.84, whereas the best cutoff for CD9 median fluorescence intensity ratio was 12.52, with an accuracy of 0.80. A strong association was observed between the level of CD9 expression and the presence of ETV6-RUNX1.
ConclusionThese data confirm that the CD9 expression could be used for risk stratification in clinical practice.
B-cell precursor acute lymphoblastic leukemia (BCP-ALL) is a heterogeneous disease with a variety of prognostic risk factors.1 For better understanding of this disease, different etiologic, clinical, analytical and multidisciplinary approaches are necessary. Immunophenotyping, in combination with cytogenetic-molecular characterization, is of great importance in the identification and classification of different subtypes. The chromosomal translocation t(12;21) (p13;q22), resulting in the ETV6-RUNX1 gene fusion (previously named TEL-AML1), is present in 22–25% of BCP-ALL. This alteration is specific to BCP-ALL, which is primarily CD10 positive, and correlates with good outcome.2 Fast detection of the molecular-cytogenic risk group is crucial to help ensure that the patient receives the appropriate treatment type, intensity and benefit from a high survival rate and low long-term side effects. In this regard, immunophenotyping to predict gene fusions can be used to optimize the diagnosis, as suggested in previous studies.3,4 Low CD9 expression has been suggested as a possible screening tool for predicting ETV6-RUNX1.5,6 The CD9 protein is a member of the transmembrane tetraspanin 4 (TM4) family that is involved in adhesion, motility and apoptosis. This protein is detected in a variety of epithelial and hematopoietic cells, including B-cell precursors, mature lymphocytes, monocytes, and megakaryocytes, among others.7–9 In the present study, we have investigated whether and how the CD9 cellular expression could be used to optimize the diagnosis of molecular BCP-ALL subgroups, by predicting the ETV6-RUNX1.
Material and methodsPatient samplesChildren aged 1–18 years diagnosed with BCP-ALL during 2011–2013 were eligible patients for this study. A total of 186 bone marrow (BM) aspirates and/or peripheral blood (PB) samples accrued from 14 centers in 11 Brazilian states, and prior to receiving any oncological treatment, were available for analysis. The time from sample collection to the immunophenotypic analysis varied from 8 to 36h, depending on the distance from the sampling center. The referring physicians provided demographic and clinical information, including age, sex and white blood cell (WBC) count. Both the data collection and laboratory procedures were evaluated and approved by the Ethics Committee of the Instituto Nacional de Câncer – INCA (33243214.7.0000.5274).
Leukemia diagnosis and flow cytometryThe diagnosis of leukemia was established by morphology, immunophenotyping and molecular-cytogenetic techniques according to standard methods.10–12 Samples were collected in tubes containing ethylenediaminetetraacetic acid (EDTA). Subsequently, all the procedures described below were performed centrally in the reference laboratory. First, leukemic cells were submitted to erythrocyte lysis using an ammonium/chloride/potassium (ACK) solution. The nucleated cells were counted in a Neubauer chamber, using Trypan Blue, to evaluate viability; all samples included in this analysis presented at least 70% viable cells. Immunophenotyping of BM aspirates was performed at diagnosis using a panel of monoclonal antibodies (MoAbs) recommended by the European group for the immunological characterization of leukemias (EGIL).13 For sample staining, fluorochrome-labeled MoAbs were set up in triplets or quadruplets and combined with fluorescein isothiocyanate (FITC), phycoerythrin (PE), peridinin chlorophyll protein Cyanin 5 (PerCP-Cy5.5), and allophycocyanin (APC) conjugates. The diagnostic panel included cytoplasmic (cy) CD79α (clone HM57), CD20 (clone B-Ly1), cyCD3 (clone UCHT1), CD4 FITC (clone MT310), CD8PE (clone DK25), CD13 (clone WM47), CD34 (clone BIRMA-K3), HLA-DR (clone AB3), and nuclear (nu) TdT (clone HT-6) from Dako (Glostrup, Denmark), CD19 (clone SJ25C1), cyIgM (clone G20127), CD9 (clone M-L13), CD45 (clone HI30), cyMPO (clone 5B8), and CD33 (clone WM53) from Becton Dickinson (San Diego, CA, USA), CD10 (clone CB-CALLA) from eBioscience (San Diego, CA, USA), and CD22 (clone SJ10.1H11) from Beckman Coulter (Marseille, France).
In addition to the standard aforementioned tubes, a tube containing the membrane markers CD9-FITC/CD10-PE/CD19PerCP-Cy5.5/CD45-APC was evaluated. Nonspecific immunoglobulin controls were used to define negative staining. A FACS Calibur flow cytometer (Becton Dickinson, CA, USA) and the Cellquest software program (BD Bioscience) were used for acquisition, and 15,000 events were acquired in the region gated for blast cells. Calibration of the FACS Calibur, using BD Calibrite™ beads (BD Bioscience) in FACSComp (BD Bioscience) software, was performed daily. Scatter settings were based on the usage of normal human peripheral blood (PB), and the lymphocyte gate was analyzed for compensation. Compensation was adjusted based on CD4-FITC, CD8-PE, CD19 PerCP-Cy5.5, and CD3-APC expression. The CD9 expression was evaluated by median fluorescence intensity (MFI) and percentage of positive blast cells, identified by the CD45 negative/low or intermediate expression and the CD19 positive normalization of the MFI of CD9 was defined as the ratio (MFI-r) between the CD9 MFI value on leukemic blast cells and on the population of cells nonspecifically stained with IgG of the same isotype conjugated to the same fluorochrome as the CD9 antibody. Cells were analyzed with the Summit 5.2 software (Dako, Glostrup, Denmark).
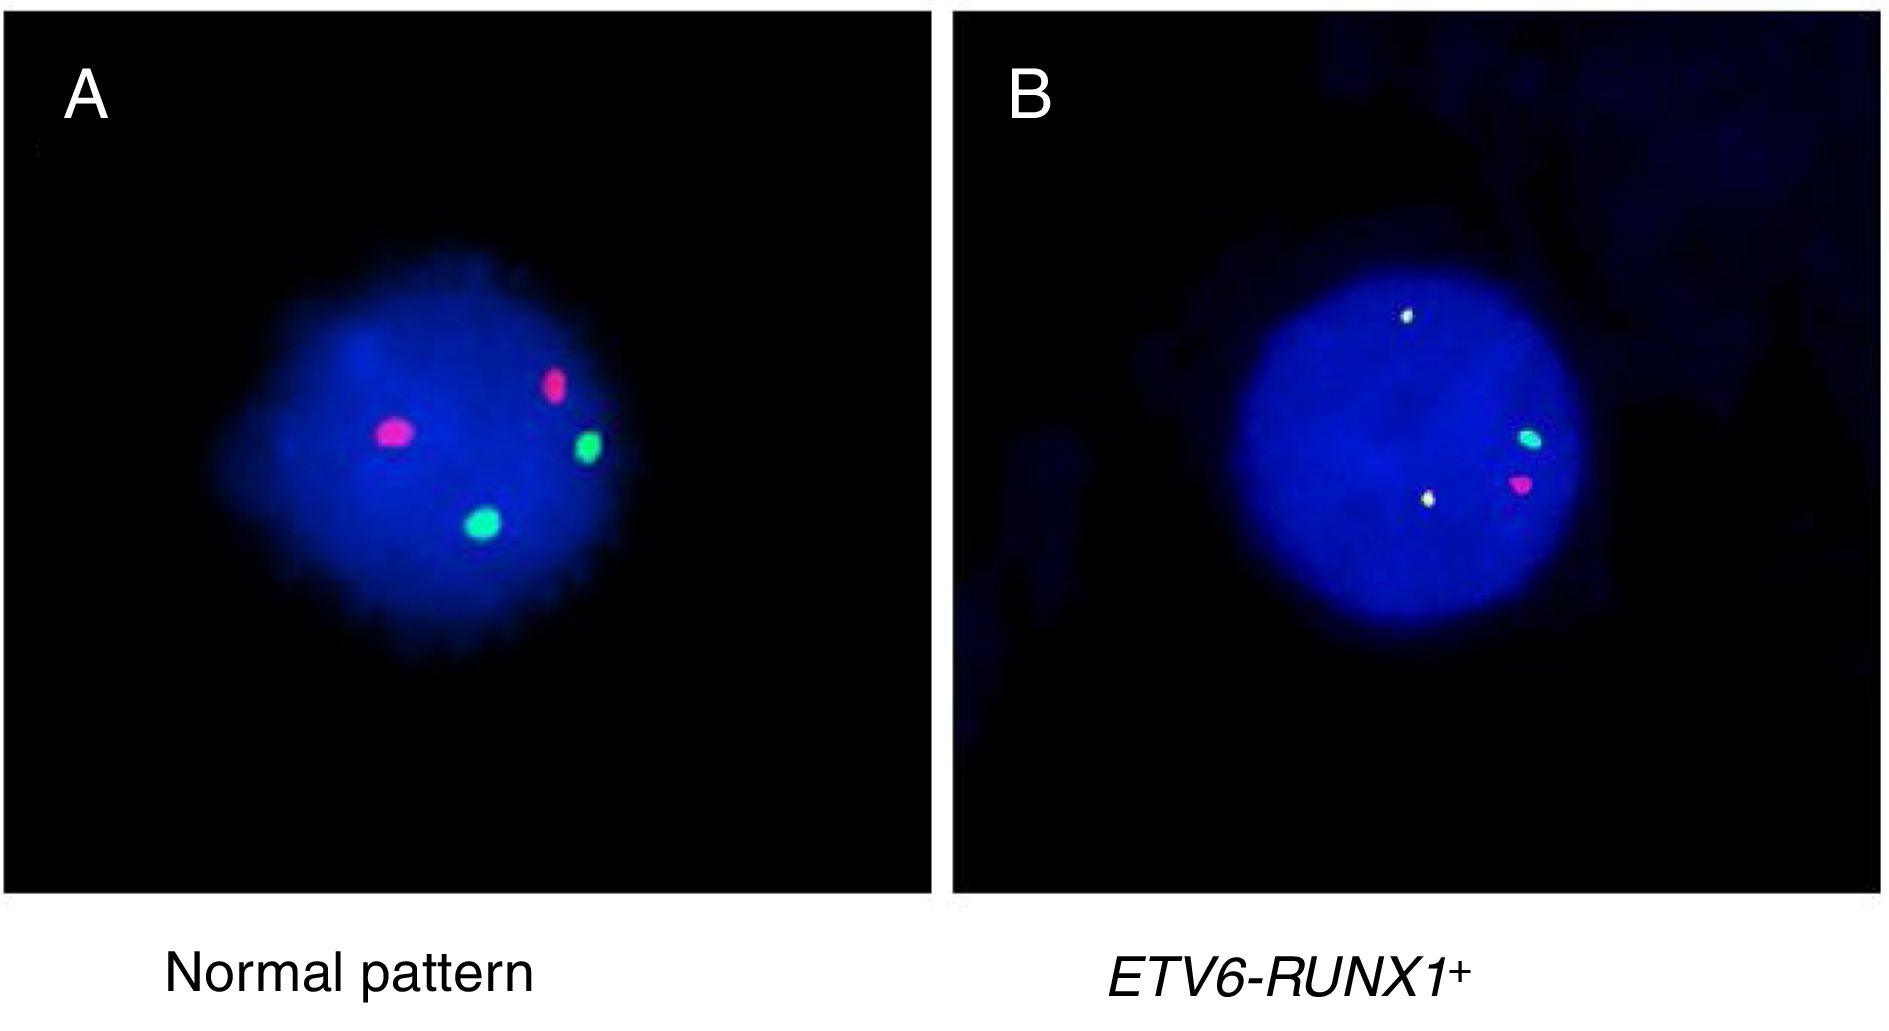
Detection of ETV6-RUNX1Either reverse transcriptase PCR (RT-PCR) or the fluorescence in situ hybridization (FISH) techniques were used to detect ETV6-RUNX1. The RT-PCR technique was performed using specific oligonucleotides, as previously described.11 The FISH analyses were performed using the commercial probe TEL/AML1 Translocation, Dual Fusion LPH 012 (Cytocell). Both probe hybridization and fluorescence signals detection were performed according to the manufacturer's recommendations (Cytocell). The sample was defined as ETV6-RUNX1 positive when at least 7% of the cells presented the following pattern: 2 co-localized yellow signals (green plus red), 1 separate green signal and 1 separate red signal (Figure 1).
Statistical analysis showing (A) the normal pattern (2 orange and 2 green signals) and (B) the ETV6-RUNX1 gene fusion (1 orange signal, 1 green signal and two co-localizations).")
The CutoffFinder, a method that optimizes cutoff definition for biomarkers, was used to set the best cutoff point for CD9 expression to predict ETV6-RUNX1. For this present analysis, the model based on the Receiver Operating Characteristic (ROC) curve, in which the sum of sensitivity and specificity is maximized, was the chosen method.14 Statistical analyses were performed with the GraphPad Prism 5 program. The ROC curves with the ROCR package (version 2.10)15 used in the statistical environment R (version 3.1)16 were performed to determine the likelihood of expression of these molecules for predicting the genotype. The accuracy, sensitivity, specificity, positive predictive value (PPV) and negative predictive value (NPV) were calculated. The ANOVA and Tukey tests were used to test the correlation between variables, such as CD9 MFI-r, CD9 percentage of positive leukemic blasts and BCP-ALL subgroups. The Pearson product moment correlation coefficient (PPMC) was performed to verify the correlation of CD9 to either the ETV6-RUNX1 or other genetic alterations.
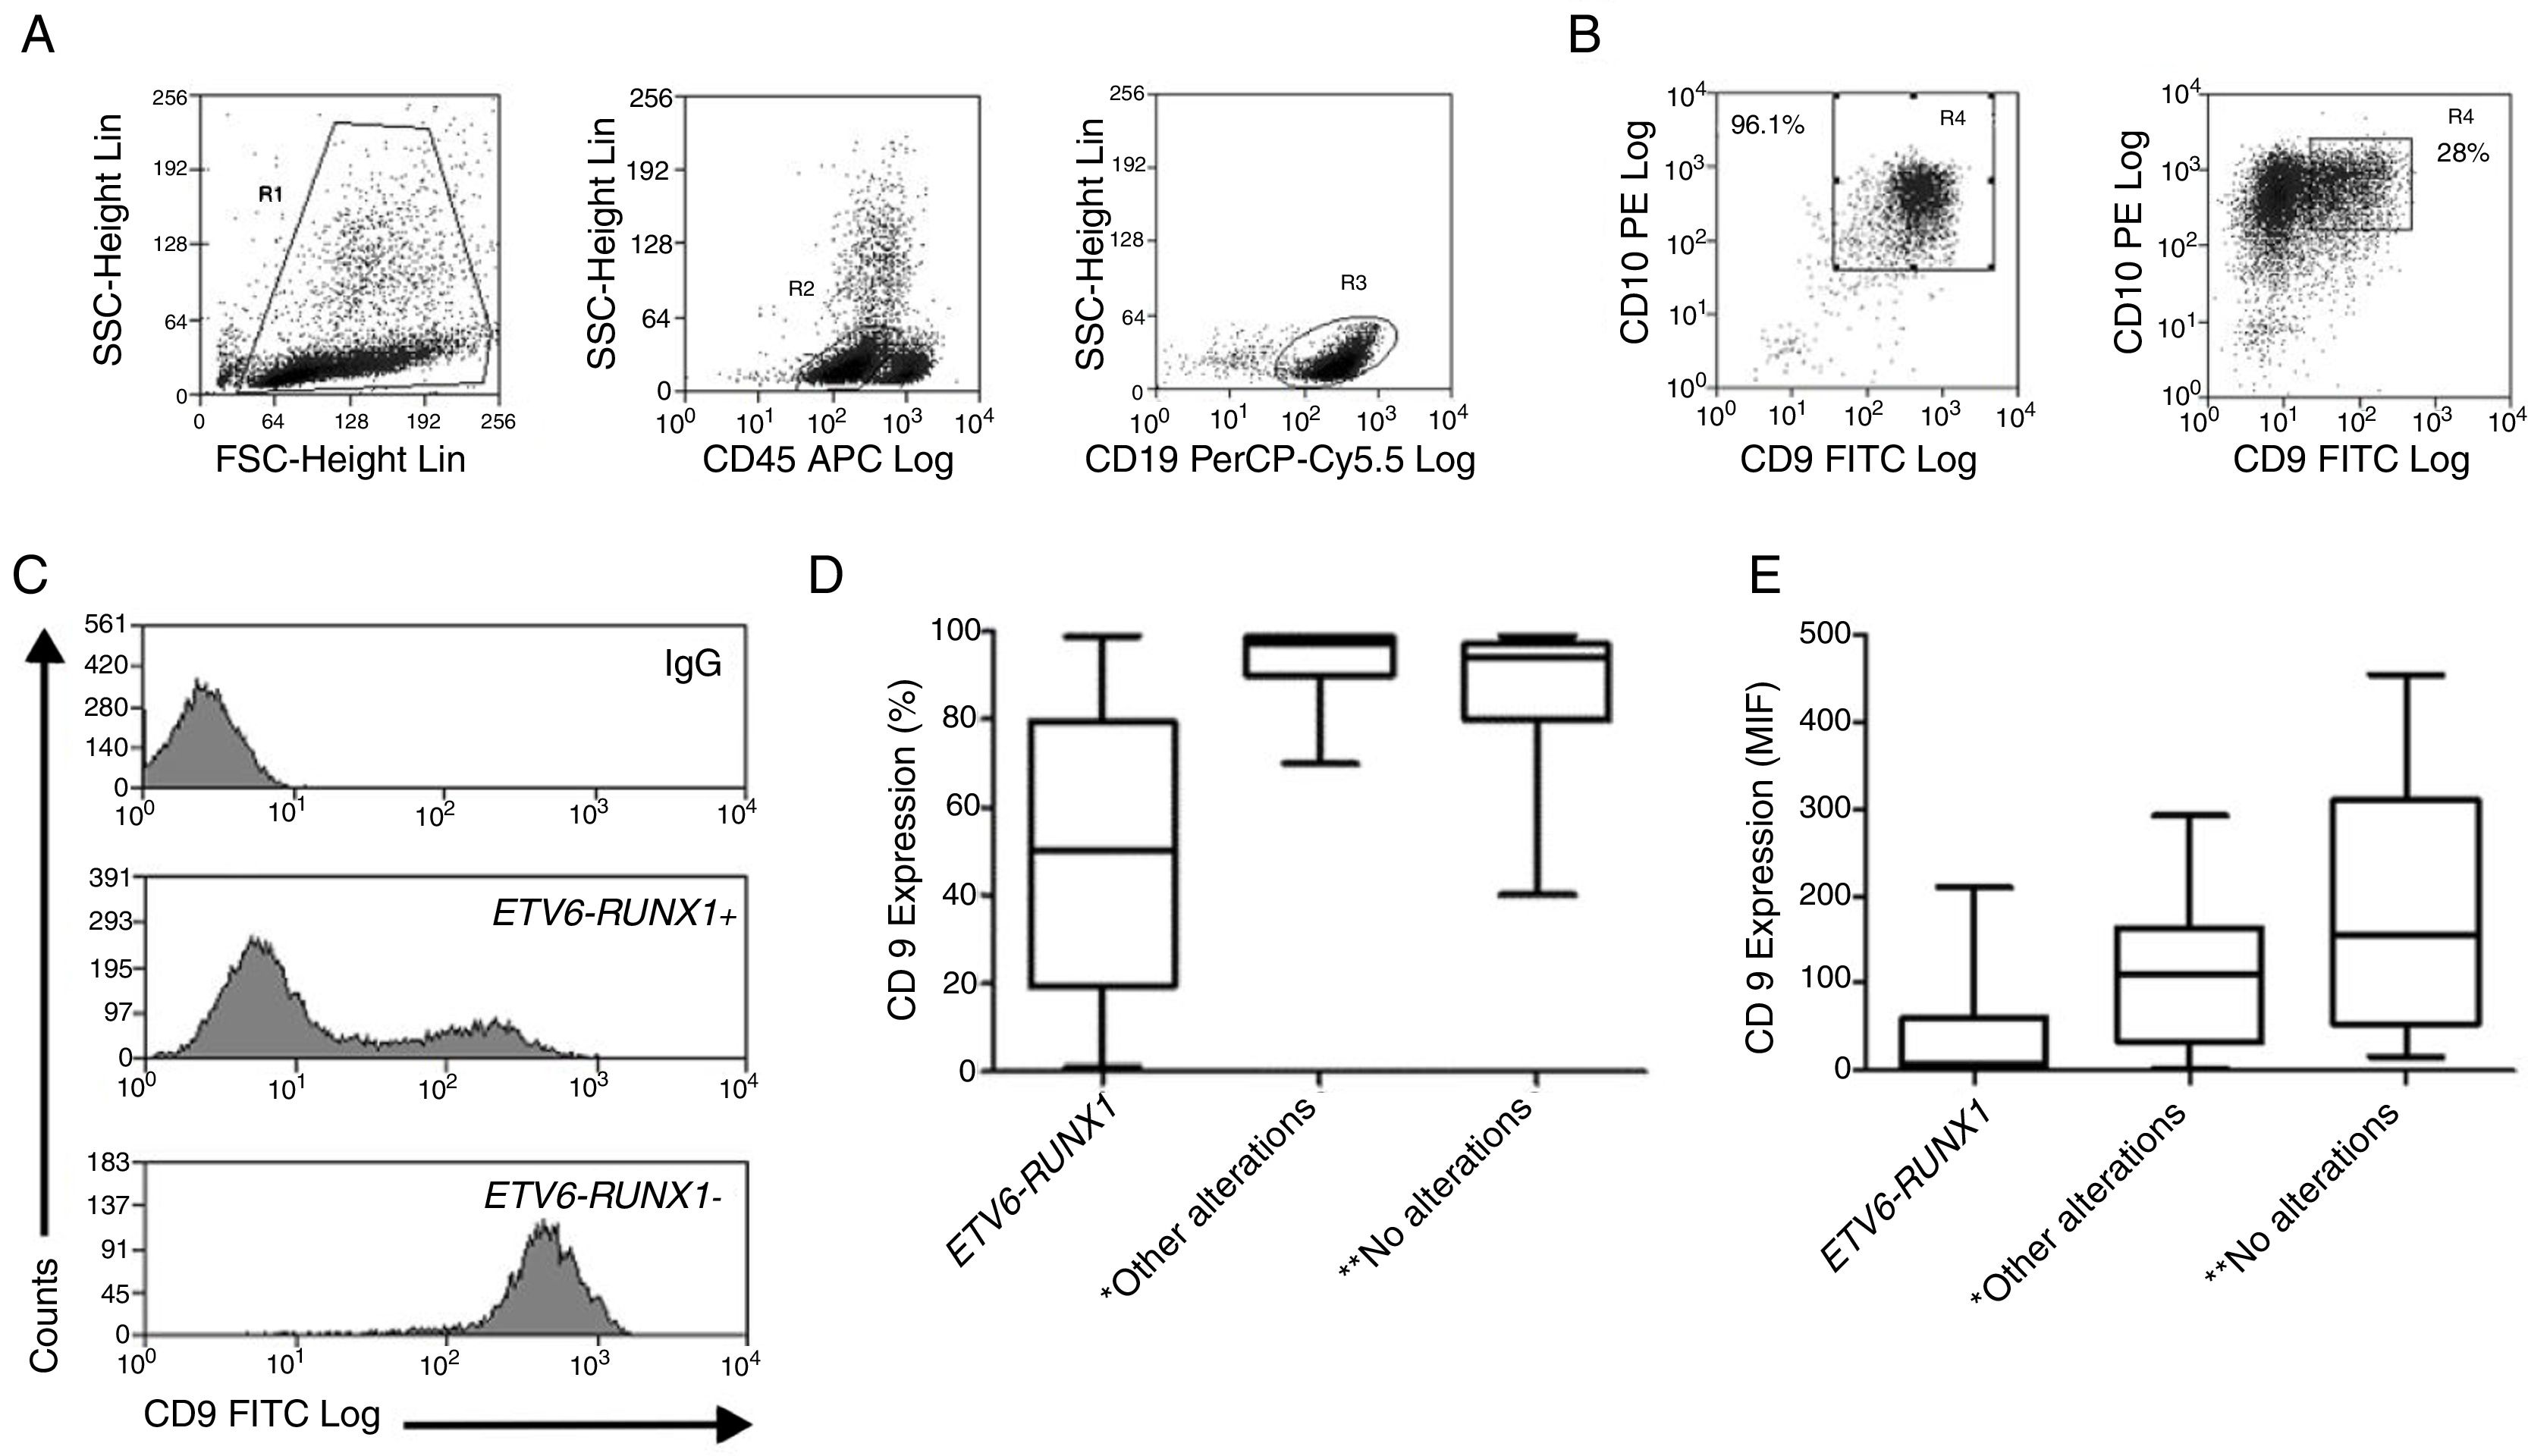
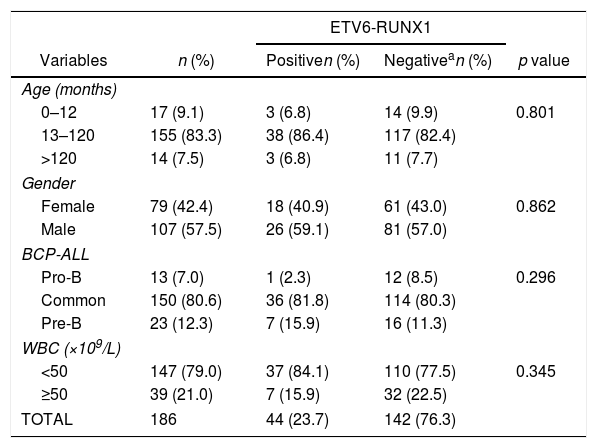
ResultsThe demographic and molecular characteristics of patients are shown in Table 1. The ETV6-RUNX1 was found in 44/186 (23.6%) cases. Figure 2A shows the gating of viable cells, which was based on the Forward Scatter (FSC)×Side Scatter (SSC), followed by the blast definition, using the CD45×SSC dot plot. The CD9 percentage was evaluated in the CD45-negative/low or intermediated and CD19-positive blast cells. In Figure 2B, the left dot plot represents the CD9 high-percentage expression, whereas the right dot plot represents the CD9 low-percentage expression. The CD9 MFI-r is exemplified in Figure 2C. The upper panel shows the IgG (negative) control, whereas the middle panel shows the typical CD9 MFI-r low expression in a sample with ETV6-RUNX1 and the lower panel shows the CD9 MFI-r high expression in a sample without ETV6-RUNX1.
Demography and laboratory characteristics of patients according to ETV6-RUNX1 status.
| ETV6-RUNX1 | ||||
|---|---|---|---|---|
| Variables | n (%) | Positiven (%) | Negativean (%) | p value |
| Age (months) | ||||
| 0–12 | 17 (9.1) | 3 (6.8) | 14 (9.9) | 0.801 |
| 13–120 | 155 (83.3) | 38 (86.4) | 117 (82.4) | |
| >120 | 14 (7.5) | 3 (6.8) | 11 (7.7) | |
| Gender | ||||
| Female | 79 (42.4) | 18 (40.9) | 61 (43.0) | 0.862 |
| Male | 107 (57.5) | 26 (59.1) | 81 (57.0) | |
| BCP-ALL | ||||
| Pro-B | 13 (7.0) | 1 (2.3) | 12 (8.5) | 0.296 |
| Common | 150 (80.6) | 36 (81.8) | 114 (80.3) | |
| Pre-B | 23 (12.3) | 7 (15.9) | 16 (11.3) | |
| WBC (×109/L) | ||||
| <50 | 147 (79.0) | 37 (84.1) | 110 (77.5) | 0.345 |
| ≥50 | 39 (21.0) | 7 (15.9) | 32 (22.5) | |
| TOTAL | 186 | 44 (23.7) | 142 (76.3) | |
 Upper dot plots show the analysis strategy used to evaluate CD9 expression in the blast population, which was defined by the R1 (viable cells)+R2 (CD45 negative/low or intermediate) and R3 regions (CD19 positive cells). (B) R4 regions represent the percentage of CD9 positive blast cells. The left dot plot represents patients with a CD9 high-percentage expression (96%) and the right dot plot represents patients with a CD9 low-percentage expression (28%). (C) CD9 expression evaluated by ratio median fluorescence intensity (MFI-r) in blast population. In the upper histogram, non-specific IgG control histogram. The middle panel represents the low CD9 MFI-r expression in a patient ETV6-RUNX1+. The last panel represents the high CD9 MFI-r expression in a patient ETV6-RUNX1−. (D) CD9 percentage according to the common alterations (high hyperdiploidy, TCF3-PBX1, BCR-ABL1, KMT2A rearrangements) in BCP-ALL. (E) CD9 MFI-r, according to the common alterations in BCP-ALL. Horizontal lines inside the bars represent the median CD9 expression percentage or MFI-r obtained from the studied cases. *Other alterations refer to MLL-r (n=16); TCF3-PBX1 (n=4); BCR-ABL1 (n=1). **No alterations were identified with the screening methods used in this study.")
CD9 expression in blast cells analyzed by FC and correlation between the CD9 percentage/MFI-r and the major molecular alterations in BCP-ALL. (A) Upper dot plots show the analysis strategy used to evaluate CD9 expression in the blast population, which was defined by the R1 (viable cells)+R2 (CD45 negative/low or intermediate) and R3 regions (CD19 positive cells). (B) R4 regions represent the percentage of CD9 positive blast cells. The left dot plot represents patients with a CD9 high-percentage expression (96%) and the right dot plot represents patients with a CD9 low-percentage expression (28%). (C) CD9 expression evaluated by ratio median fluorescence intensity (MFI-r) in blast population. In the upper histogram, non-specific IgG control histogram. The middle panel represents the low CD9 MFI-r expression in a patient ETV6-RUNX1+. The last panel represents the high CD9 MFI-r expression in a patient ETV6-RUNX1−. (D) CD9 percentage according to the common alterations (high hyperdiploidy, TCF3-PBX1, BCR-ABL1, KMT2A rearrangements) in BCP-ALL. (E) CD9 MFI-r, according to the common alterations in BCP-ALL. Horizontal lines inside the bars represent the median CD9 expression percentage or MFI-r obtained from the studied cases. *Other alterations refer to MLL-r (n=16); TCF3-PBX1 (n=4); BCR-ABL1 (n=1). **No alterations were identified with the screening methods used in this study.
The correlation of CD9 with other markers commonly studied in BCP-ALL, including CD19, CD20, cyCD79a, cytIgM, CD10, CD34, nuTdT, and HLA-DR, was also tested. A weak positive correlation between the CD9 and CD10 expression was observed (r=0.16; p=0.03). There was no CD9 correlation with other markers: nuTdT (r=−0.05; p=0.55); cyCD79a (r=0.15; p=0.65); cyIgM (r=−0.38; p=0.08); CD34 (r=0.03; p=0.69); HLA-DR (r=−0.01; p=0.87); CD20 (r=−0.09; p=0.32); and CD19 (r=0.05; p=0.55).
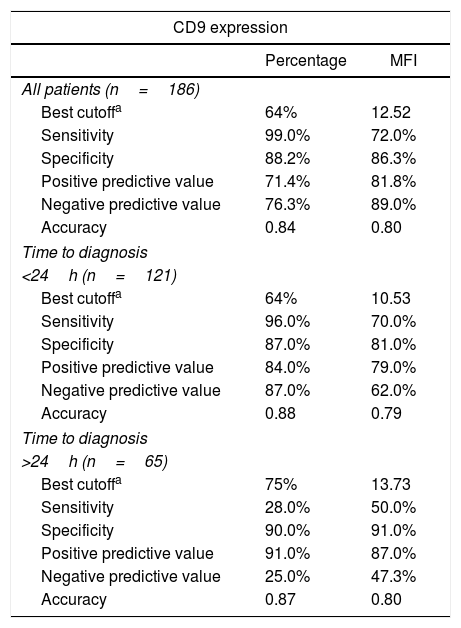
Accuracy tests were conducted to define the best cutoff point for both the CD9 percentage and the MFI-r considering all patients, but also stratifying the patients according to time to diagnosis (Table 2). The overall analysis revealed that the best cutoff point for using the CD9 expression to predict the ETV6-RUNX1 was 64% of the cells and 12.52 for the MFI-r, which resulted in accuracies of 0.84 and 0.80, respectively. The best cutoff found for samples processed within 24h was also 64% for the CD9 percentage and 10.73 for the MFI-r, which resulted in accuracies of 0.88 and 0.79, respectively. The best cutoff for samples processed after 24h from collection was 75% for the CD9 percentage and 13.73 for the MFI-r, which resulted in accuracies of 0.87 and 0.80, respectively. The cell viability was 19% lower in samples processed after 24h from collection (73% versus 54%).
ETV6-RUNX1 prediction values for CD9 percentage and MFI-r by flow cytometry.
| CD9 expression | ||
|---|---|---|
| Percentage | MFI | |
| All patients (n=186) | ||
| Best cutoffa | 64% | 12.52 |
| Sensitivity | 99.0% | 72.0% |
| Specificity | 88.2% | 86.3% |
| Positive predictive value | 71.4% | 81.8% |
| Negative predictive value | 76.3% | 89.0% |
| Accuracy | 0.84 | 0.80 |
| Time to diagnosis | ||
| <24h (n=121) | ||
| Best cutoffa | 64% | 10.53 |
| Sensitivity | 96.0% | 70.0% |
| Specificity | 87.0% | 81.0% |
| Positive predictive value | 84.0% | 79.0% |
| Negative predictive value | 87.0% | 62.0% |
| Accuracy | 0.88 | 0.79 |
| Time to diagnosis | ||
| >24h (n=65) | ||
| Best cutoffa | 75% | 13.73 |
| Sensitivity | 28.0% | 50.0% |
| Specificity | 90.0% | 91.0% |
| Positive predictive value | 91.0% | 87.0% |
| Negative predictive value | 25.0% | 47.3% |
| Accuracy | 0.87 | 0.80 |
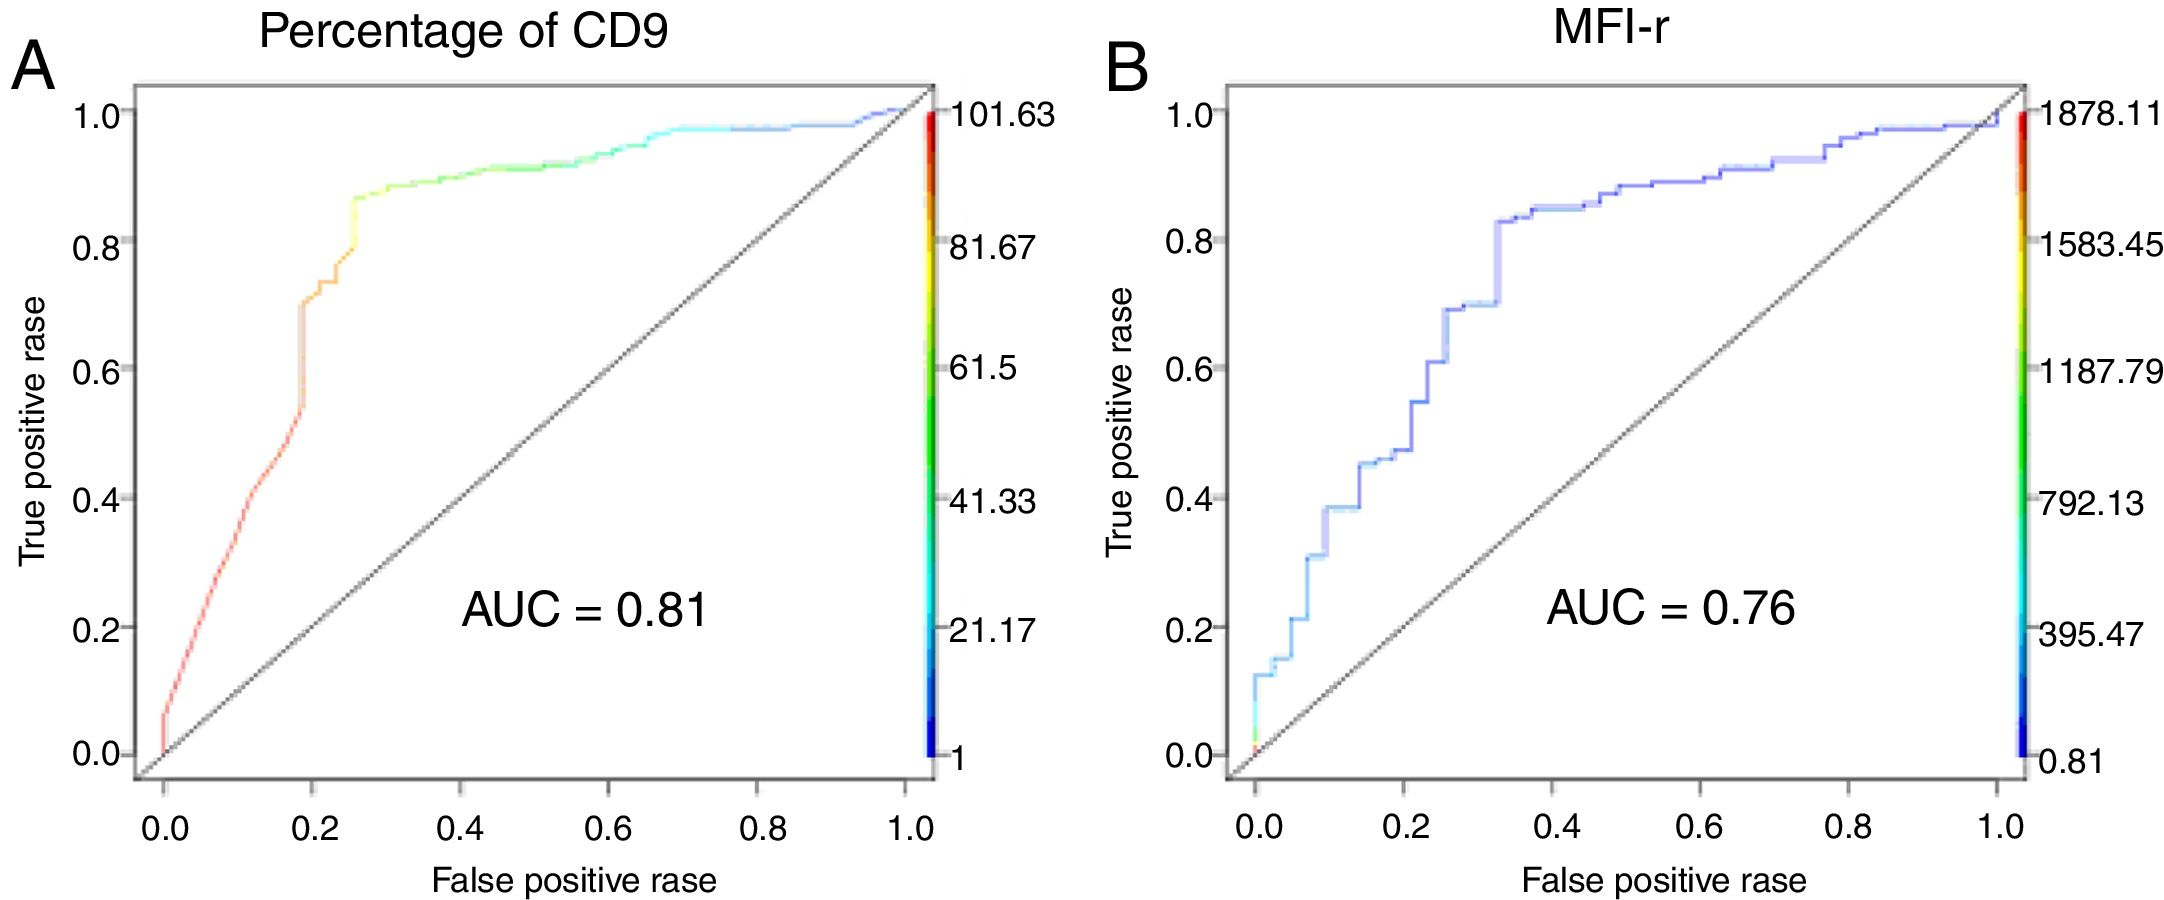
The low CD9 MFI-r was observed in patients with ETV6-RUNX1 and the high CD9 MFI-r was observed in patients without ETV6-RUNX1 (Figure 2C). The presence of ETV6-RUNX1 was associated with a low percentage of CD9 or MFI-r (p<0.001). While patients who had other or no molecular alterations had a significantly higher percentage of CD9 positivity and MFI-r (p=0.001) (Figure 2D and E). Analysis by ROC curves showed the potential of the CD9 percentage and MFI-r values to discriminate the ETV6-RUNX1 from other genetic changes in the BCP-ALL (Figure 3). The area under the curve (AUC) was greater using the percentage (0.81) than the MFI-r (0.76) measurement (Figure 3A and B).
 ROC curve of CD9 percentage predicting ETV6-RUNX1. (B) ROC curve of CD9 MFI-r predicting ETV6-RUNX1.")
Comparing the qualitative and quantitative methods of the CD9 expression, the data show that the sensitivity and specificity were slightly higher when using the CD9 percentage than the MFI (99% and 88.2% versus 72% and 86.3%, respectively). On the contrary, the positive predictive value (PPV) and negative predictive value (NPV) were slightly higher when using the MFI rather than the CD9 percentage (81.8% and 89% versus 71.4% and 76.3%, respectively). After analyzing the samples according to time to diagnosis, it was observed that the sensitivity and NPV values were markedly decreased for samples analyzed 24h after collection for both measurement methods (Table 2).
DiscussionAlthough the survival rates of BCP-ALL are considerably high, up to 25% of patients still relapse,17 and some children can benefit from improved risk stratification algorithms. Currently, genetic abnormalities are recognized as important prognostic markers at diagnosis and should be routinely tested before the assignment of a treatment protocol (i.e., short time-frame). Of note, in a country such as Brazil, with a large continental size and many diverse characteristics, this might not be accessible at all care centers. Thus, this study aimed not only to evaluate accuracy values, using CD9 expression to predict ETV6-RUNX1, but also to address possible modulators of this association.
First, issues such as reproducibility and standardization need to be addressed. The data presented here clearly show that the establishment of a satisfactory cutoff is crucial to generating a tailored correlation (e.g., the CD9 expression versus ETV6-RUNX1), and we used a previously described standard application which enables biomarker optimization.14 For example, if the standard percent cutoff used to determine membrane surface markers in leukemia diagnosis had been used in our present correlation study (20%), the overall analysis would retrieve an accuracy of 0.75, whereas the best cutoff provided in our analysis (64%) had accuracy of 0.84. In our study, we retrieved the best cutoff, maximizing sensitivity and specificity to stratify patients into two groups, i.e., either ETV6-RUNX1 positive or negative. With this strategy, all the cases with low CD9 expression need to be validated for the presence of ETV6-RUNX1 by another method (e.g., RT-PCR or FISH). Therefore, the CuttoffFinder tool allowed us to translate laboratory data into a practical routine decision, with the best cost-benefit.
Currently, flow cytometry (FC) is considered an important tool for stratification and therapeutic monitoring in BCP-ALL, as it can detect the differential expression of certain markers. The CD9 has been recommended in a panel proposed by the Euroflow group for diagnosing BCP-ALL, which may contribute to assessment of minimal residual disease.18,19 The CD9 is associated with several signaling pathways and epigenetic modifications that regulate stem cell properties, showing that the CD9 also plays an important role in leukemogenesis. Furthermore, experimental data have shown that CD9-positive cells exhibit greater tumorigenic potential, drug resistance, and deregulation of cancer-related genes. This is concordant with the observed low CD9 expression in patients with ETV6-RUNX1, a non-aggressive ALL molecular subtype. Furthermore, the development of an anti-CD9 monoclonal antibody showed that it has a significant inhibitory effect on the proliferation of B-ALL cells. Therefore, targeting the CD9 with a monoclonal antibody seems to be a promising strategy for treating some BCP-ALL cases.20 Further studies are needed to evaluate the impact of the CD9 expression on prognosis and its relevance to current therapy in a protocol-adjusted cohort of patients.
Our study revealed a strong potential for the CD9 in predicting the presence of ETV6-RUNX1. A former study also demonstrated that the CD9, in combination with the CD20, could discriminate cases with ETV6-RUNX1. They found a sensitivity of 88% and a specificity of 71% for ETV6-RUNX1, but the PPV was only 47%.4 In another study, Gandemer et al. showed that the CD9, in combination with the CD10, predicted ETV6-RUNX1 with specificity, accuracy rate, and PPV of 92.1%, 90%, and 75%, respectively.5,6 As a practical consequence in the laboratory routine, this predictive power allows for the limitation of the use of molecular tests, thus optimizing the time and costs of the entire diagnostic procedure. For example, those patients with a high CD9 expression are first tested for other recurrent genetic abnormalities, and only the negative ones will be tested for ETV6-RUNX1. In accordance, those with a low CD9 expression are first tested for ETV6-RUNX1, and only the negative ones will be tested for other recurrent genetic abnormalities.
Overall, no significant differences were observed when comparing the percentage and MFI measurements, suggesting that both methods can be standardized to predict the gene fusion. Nevertheless, as expected, significant differences were observed when evaluating the impact of the time between sample collection and processing. This finding is probably partially explained by the impact of time on cell viability. Indeed, our data showed a reduction in cell viability of non-fresh samples. Additionally, it is well-known that fluctuation in temperature causes changes in membrane expression of some antigens.21 Interestingly, physical factors, such as blood settling may also induce the rapid degradation of blood after collection, imposing logistical limitations on the utilization of blood cells in diagnostics and scientific investigations.22 Therefore, the time until sample analysis must be taken into consideration when performing multi-center flow-cytometric diagnostics on leukemias, particularly in hot areas, such as Brazil, where room temperature is usually higher than 18–25°C. Because the FC and/or molecular analyses are not always available at every treatment center worldwide, sample transportation is a reality that sometimes cannot be avoided.
ConclusionsIn summary, our study confirms that low surface expression of CD9 measured by the FACS can predict the presence of ETV6-RUNX1 in cases of BCP-ALL. This prediction is reliable, using both the percentage of stained cells (qualitative approach) and MFI measurements (quantitative approach), but may be compromised by the time between sample collection and processing. This predictive power allows us to limit the use of molecular tests, thus optimizing the time and cost of the entire diagnostic procedure.
Conflicts of interestThe authors declare no conflicts of interest.
We are grateful to the children and their parents for participating in the study. We thank Camilla Andrade and Alessandra Faro for their technical support and Bruno Lopes for contributing with illustrations artwork. The project was partially funded by grants from INCT-Controle do Cancer (CNPq#573806/2008-0, FAPERJ#E026/170.026/2008 and FAPERJ#E-26/110.509/2010; FAPERJ#E-26/110.823/2012). MSPO has been supported by CNPq research scholarships (#309091/2007) and FAPERJ (#E026/101.562/2010). GW is supported by Vice-Presidência de Ensino, Informação e Comunicação/Pró-Reitoria–IOC/FIOCRUZ and Ministry of Health of Brazil. FP acknowledges the support of FAPERJ and CNPq. FP and the Bioinformatics Unit acknowledge the support of the Fundação do Câncer and the Ministry of Health of Brazil.


