
The purpose of this study was to compare data obtained from the reticulocyte channel (RET channel) heated to 41°C with those obtained from impedance channel (I-Channel) at room temperature in the samples with the mean corpuscular hemoglobin concentration (MCHC)<370g/L and in samples with the MCHC>370g/L, in the presence of cold agglutinins.
MethodsIn this study, 60 blood samples (group 1) with the MCHC<370g/L (without cold agglutinins) and 78 blood samples (group 2) with the MCHC>370g/L (with cold agglutinins) were used to compare the two analytical channels of the XN-9000 analyzer in different preanalytical conditions. The parameters evaluated in both groups were the following: red blood cell (RBC), hemoglobin (HGB), hematocrit (HCT), mean cell volume (MCV), RBC-most frequent volume (R-MFV), mean hemoglobin concentration (MCH) and mean cellular hemoglobin concentration (MCHC).
ResultsThe results of this study showed an excellent correlation with both channels of the XN-9000 analyzer in samples with and without cold agglutinins, except for the MCHC. The bias between the values obtained in the I-channel and those obtained in the RET channel of both groups was insignificant and remained within the limits of acceptability, as reported by Ricos et al. for all considered parameters, except for MCHC.
ConclusionsThe presence of cold agglutinins in blood samples can be detected by a spurious lowering of the RBC count and by a spurious increase in the MCHC. The RET channel represents a great opportunity to correct the RBC count in a rapid manner without preheating. However, neither methodology can completely solve the residual presence of cold agglutinins in all samples, despite the MCHC values being < 370g/L.
Autoimmune hemolytic anemia (AIHA) includes a heterogeneous group of pathological conditions characterized by the presence of “warm or cold” autoantibodies directed against the red blood cells (RBCs), with consequent hemolysis.1
From the clinical point of view, it is possible to distinguish primary or idiopathic forms of AIHA (not associated with other pathologies) from secondary forms, with an acute or chronic course. The most common causes of the secondary autoimmune hemolytic anemia from warm agglutinins (wAIHA) include lymphoproliferative diseases (e.g., Hodgkin’s lymphoma), immunological disorders (e.g., systematic lupus erythematosus) and certain chronic inflammatory diseases (e.g., ulcerative colitis). The AIHA from cold autoantibodies (CA) are instead caused by lymphoproliferative disorders of B lymphocytes (e.g., chronic lymphocytic leukemia) and mainly by infections (e.g., Epstein-Barr virus, Mycoplasma pneumoniae, chickenpox or infectious mononucleosis).1–4 The CA forms include two distinct clinical entities, cold agglutinin disease (CAD) and paroxysmal cold hemoglobinuria (PCH).5
The AIHAs are classified based on the thermal properties in which the antibodies bind to erythrocytes, on the class of immunoglobulin (Ig) involved and on the ability to activate or not the complement.4–7 The forms of warm autoantibodies (WA) (48–70% of the cases), belonging to the immunoglobulin G (IgG) class, are activated at a thermal optimum of 37°C. The WA (IgG) have a lower ability to activate the complement and, once binding to the epitopes of the Rh System of the RBCs, make them recognizable to the cells of the monocyte-macrophage system (present in the spleen/liver) that remove them from the circulatory stream and destroy them. The destruction of the RBCs occurs with a so-called antibody-dependent cell cytotoxicity (ADCC) mechanism, in which the cells of the monocyte-macrophage system engulf the RBCs through the recognition of the fragment crystallizable of IgG (or complementary fractions, such as the C3b).6 Hemolysis is therefore extravascular and occurs mostly in the spleen and sometimes in the liver. Furthermore, there are some subtypes of immunoglobulin G (IgG1 and IgG3) also endowed with a strong ability to activate the complement and, therefore, to cause intravascular hemolysis. The forms of CA (16–32% of the cases), belonging to the IgM class, are directed against the self-antigens of System I and activated at a thermal optimum of 4°C (thermal range 20°–24°C). These autoantibodies have a high avidity and ability to activate the complementary cascade up to the final lytic complex (C5–C9), which determines the lysis of the RBCs directly in the circulatory stream (intravascular hemolysis) through the activation of “perforins” and other cytotoxic factors.6 The PCH is caused by the presence of an IgG class antibody, defined as a biphasic Donath-Landsteiner hemolysin, because it acts in two stages: it binds to RBCs at a temperature between 4°–20°C and activates the complement between 20°–37°C, destroying red blood cells (intravascular hemolysis).8–10 Finally, some patients may present both types of autoantibodies and, in this case, mixed AIHA is defined (3% of the cases).8
The blood count in patients with CAD is complicated for the commercially available automatic analyzers. Normally, in AIHA from CA, autoantibodies are active at 4°C, however, in some severe cases with a high antibody titer, their thermal amplitude increases; it causes the agglutination of RBCs in vivo with consequent hemolysis. For this reason, at temperatures below 30°C, agglutination also occurs in vitro, regardless of the type of anticoagulant used,11 with a decrease in the RBCs and hematocrit (HCT), false high value of mean cell volume (MCV) and false increase of the Wintrobe indices, the mean hemoglobin concentration (MCH) and mean cellular hemoglobin concentration (MCHC).12 To overcome this problem, the sample is incubated at 37°C in a water bath for 2h and then immediately analyzed. Incubation at 37°C makes agglutination reversible in most cases, even if it is not resolved completely. The increase in the HCT and RBC values consequently leads to a correction of the Wintrobe indices.
The XN-9000 analyzer uses two different types of technology to count RBCs. In addition to the traditional impedance method (RBC-I) with hydrodynamic focusing, it also uses a second optical method (RBC-O) to count RBCs in the RET channel by fluorescence flow cytometry, after stabilization and warming at 41°C in the incubation chamber for 1min.
In this study, we have therefore compared data obtained with the optical method from the channel reticulocytes heated to 41°C with those obtained from the I-channel at room temperature in samples with an MCHC<370g/L (without cold agglutinins) and in samples with an MCHC>370g/L (with cold agglutinins) after incubation at 37°C for 2h in a water bath.
Materials and methodsInstrumental characteristicsThe cell count and volumetric measurements of RBCs by the Sysmex XN-9000 automated analyzer (Sysmex, Kobe, Japan) are carried out using the resistive or impedance method (RBC-I), with hydrodynamic focusing. The use of hydrodynamic focusing allows for the reduction of anomalous impulses, improving the distribution curves of cellular volumes. The MCV and HCT are directly measured on the Sysmex XN-9000 analyzer. The HTC is measured using the cumulative height of the electrical pulse produced by each cell when passing through electrodes.11,12 This parameter is reported as a percentage of the total volume of the sample. The MCV is an average of all RBC size measuraments collected in the impedance counter. In addition to the MCV, the Sysmex XN-9000 automated analyzer provides a new parameter, which is provided by the I-Channel: the RBC-most frequent volume (R-MFV). This parameter represents the median value of RBC volumes, that defines the peak of the curve.13 The MFV is used to recalculate the HCT (Rec-HCT), once the RBCs are counted in the RET channel. The recalculation of the hematocrit is performed automatically by the application count blood optical (APP-CBO), using the following formula: RBC-OxMFV/10. The hemoglobin concentration (HGB) measurement is analyzed, using a cyanide-free sodium lauryl sulphate reagent, by the photometric method. Measured parameters, such as the HGB, RBC and HCT, allow for the calculation of the MCH (HGB/RBC) and the MCHC (HGB/HCT).13
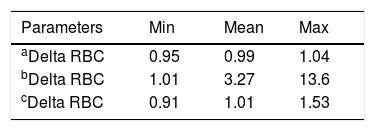
In addition to the traditional RBC counting method, a second optical method is used. In the RET channel, the surfactant perforates the cell membranes of RBCs, white blood cells (WBCs) and platelets (PLTs), thus allowing the fluorescence marker to penetrate the cell. The fluorescence marker then labels the nucleic acids of nucleated red blood cells (NRBCs), WBCs and reticulocytes (RETs). Using the forward scattered light and the fluorescence signal, the RETs can be separated from mature RBCs, WBCs and NRBCs. The reticulocyte population is separated from mature RBCs as a function of the RNA content and other nucleated cells in relation to the RNA/DNA content.14 On the service page, in addition to the reticulocyte count and the various fractions in percentage and absolute value, the optical number of mature red blood cells (RBC-O) and the delta RBC are also informed. The delta RBC is the ratio between RBC-O and RBC-I, counted from both channels at the same time.
From the RET channel, the hemoglobin content of the RBCs (RBC-He) used for the calculation from which the optical hemoglobin (HGB-O) is determined. The HGB-O is calculated using the following formula: RBC –HE x RBC-O/10. This parameter has already been shown to be correlated with the MCH for normal patients.14
Blood samplesFor this study, 138 blood samples were used, 60 blood samples (group 1, without cold agglutinins), with an MCHC under 370g/L and 78 blood samples with an MCHC over 370g/L (group 2, with cold agglutinins). All other samples with an MCHC>370g/L, but without cold agglutinins, confirmed by the optical microscope, were excluded from the analysis (data not shown). All samples were collected in vacutainer tubes containing anticoagulant ethylenediamine tetraacetic acid (K2ETDA) (Venosafe, Terumo Europe N. V, Leuven, Belgium).
Study designThe samples of group 1 were analyzed in both channels without preheating to evaluate the differences and the agreement of the following parameters: RBC, HGB, HCT, MCV, R-MFV, MCH and MCHC.
The samples of group 2 were analyzed without preheating, first in the I-Channel and immediately thereafter by the reflex test in the RET channel at 41°C. Subsequently, the samples were retested after 2h of incubation at 37°C in a water bath only in the I-Channel. For each sample, a blood smear was prepared before preheating at 37°C and immediately after preheating at 37°C to evaluate the presence of crioagglutinins. The parameters evaluated in the different preanalytical conditions were the following: RBC, HGB, HCT, MCV, MFV, MCH and MCHC.
After the cell count in all the samples of both groups, the presence of turbid plasma was evaluated.
For this type of study, informed consent is implicit and the ethical committee approval is not necessary. All the samples used in the study were made anonymous before the analysis. The data obtained from our study did not invalidate the patient's clinical results. The study was performed according to the Declaration of Helsinki requirements.
Statistical analysisThe results of this study were reported as minimum value, first quartile and median and maximum values. The verification of the normal distribution of data was performed with the Shapiro-Wilk test. The agreement between the different parameters was assessed with the Pearson’s correlation coefficient (r) and Passing-Bablok regression. Using Bland-Altman plots, the percentage variations between the different parameter categories were evaluated and, finally, they were compared to the current quality specifications for the desirable bias, which is derived from the intra-individual and inter-individual variations. Furthermore, the sensitivity and specificity of delta RBC were evaluated. Statistical analysis was performed using the Analyze-it software, version 3.90.1.
ResultsThe main results of our study are shown in Tables 1 and 2. The differences comparing the data in both groups 1 and 2 were evaluated by the Wilcoxon's test because of the abnormal fit distribution (Shapiro–Wilk, p<0.001).
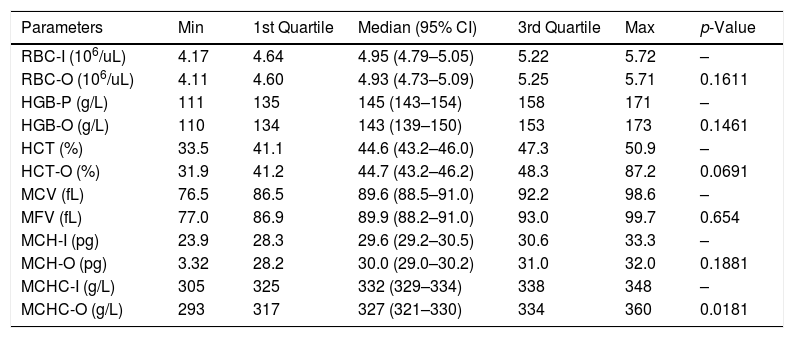
Group 1: comparison among parameters performed at room temperature in the I-channel and RET channel.
| Parameters | Min | 1st Quartile | Median (95% CI) | 3rd Quartile | Max | p-Value |
|---|---|---|---|---|---|---|
| RBC-I (106/uL) | 4.17 | 4.64 | 4.95 (4.79–5.05) | 5.22 | 5.72 | – |
| RBC-O (106/uL) | 4.11 | 4.60 | 4.93 (4.73–5.09) | 5.25 | 5.71 | 0.1611 |
| HGB-P (g/L) | 111 | 135 | 145 (143–154) | 158 | 171 | – |
| HGB-O (g/L) | 110 | 134 | 143 (139–150) | 153 | 173 | 0.1461 |
| HCT (%) | 33.5 | 41.1 | 44.6 (43.2–46.0) | 47.3 | 50.9 | – |
| HCT-O (%) | 31.9 | 41.2 | 44.7 (43.2–46.2) | 48.3 | 87.2 | 0.0691 |
| MCV (fL) | 76.5 | 86.5 | 89.6 (88.5–91.0) | 92.2 | 98.6 | – |
| MFV (fL) | 77.0 | 86.9 | 89.9 (88.2–91.0) | 93.0 | 99.7 | 0.654 |
| MCH-I (pg) | 23.9 | 28.3 | 29.6 (29.2–30.5) | 30.6 | 33.3 | – |
| MCH-O (pg) | 3.32 | 28.2 | 30.0 (29.0–30.2) | 31.0 | 32.0 | 0.1881 |
| MCHC-I (g/L) | 305 | 325 | 332 (329–334) | 338 | 348 | – |
| MCHC-O (g/L) | 293 | 317 | 327 (321–330) | 334 | 360 | 0.0181 |
Min: lowest value; CI: confidence interval; Max: highest value; RBC: red blood cell; HGB: hemoglobin concentration; HCT: hematocrit; MCV: mean cell volume; MFV: most frequent volume; MCH: mean hemoglobin concentration; MCHC: mean cellular hemoglobin concentration; O: optical; I: impedance; P: photometric.
Statistically significant differences in bold. Statistically significant variation (p-value < 0.0001) compared the parameters obtained in the I-channel at room temperature with the parameters of the RET channel.
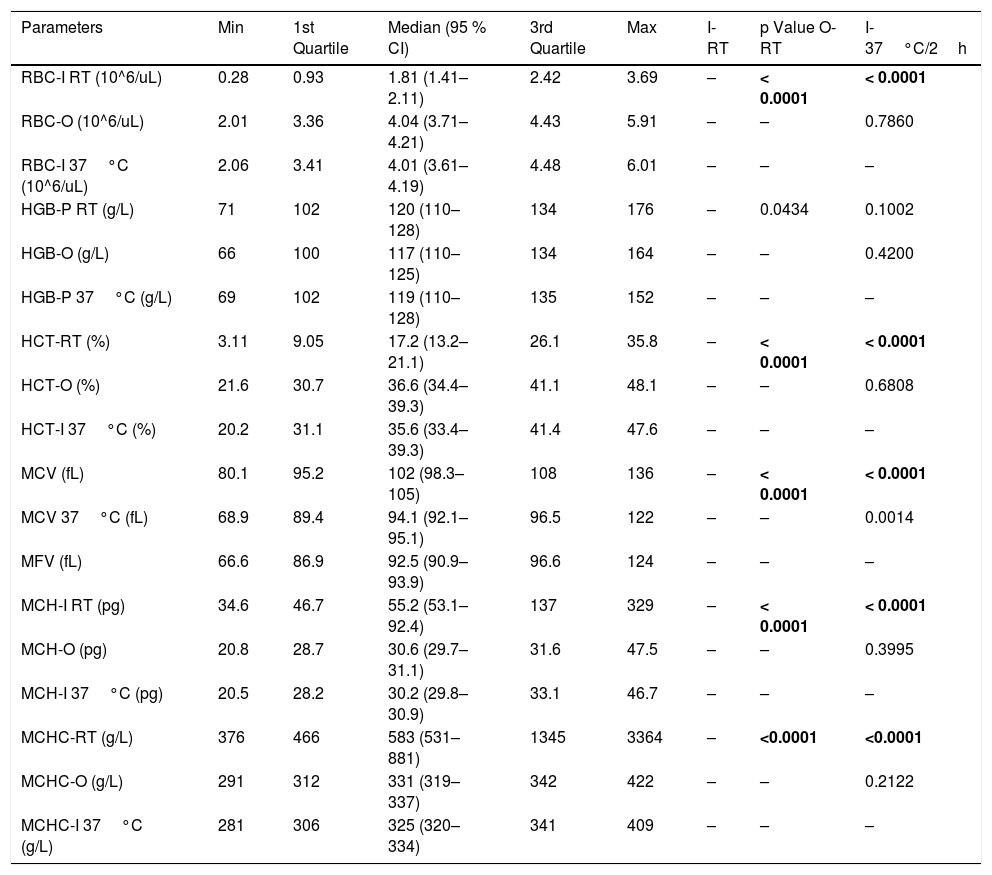
Group 2: comparison between the parameters performed in the I-channel at room temperature and after warming to 37°C/2h with those obtained in the RET channel.
| Parameters | Min | 1st Quartile | Median (95 % CI) | 3rd Quartile | Max | I-RT | p Value O-RT | I-37°C/2h |
|---|---|---|---|---|---|---|---|---|
| RBC-I RT (10^6/uL) | 0.28 | 0.93 | 1.81 (1.41–2.11) | 2.42 | 3.69 | – | < 0.0001 | < 0.0001 |
| RBC-O (10^6/uL) | 2.01 | 3.36 | 4.04 (3.71–4.21) | 4.43 | 5.91 | – | – | 0.7860 |
| RBC-I 37°C (10^6/uL) | 2.06 | 3.41 | 4.01 (3.61–4.19) | 4.48 | 6.01 | – | – | – |
| HGB-P RT (g/L) | 71 | 102 | 120 (110–128) | 134 | 176 | – | 0.0434 | 0.1002 |
| HGB-O (g/L) | 66 | 100 | 117 (110–125) | 134 | 164 | – | – | 0.4200 |
| HGB-P 37°C (g/L) | 69 | 102 | 119 (110–128) | 135 | 152 | – | – | – |
| HCT-RT (%) | 3.11 | 9.05 | 17.2 (13.2–21.1) | 26.1 | 35.8 | – | < 0.0001 | < 0.0001 |
| HCT-O (%) | 21.6 | 30.7 | 36.6 (34.4–39.3) | 41.1 | 48.1 | – | – | 0.6808 |
| HCT-I 37°C (%) | 20.2 | 31.1 | 35.6 (33.4–39.3) | 41.4 | 47.6 | – | – | – |
| MCV (fL) | 80.1 | 95.2 | 102 (98.3–105) | 108 | 136 | – | < 0.0001 | < 0.0001 |
| MCV 37°C (fL) | 68.9 | 89.4 | 94.1 (92.1–95.1) | 96.5 | 122 | – | – | 0.0014 |
| MFV (fL) | 66.6 | 86.9 | 92.5 (90.9–93.9) | 96.6 | 124 | – | – | – |
| MCH-I RT (pg) | 34.6 | 46.7 | 55.2 (53.1–92.4) | 137 | 329 | – | < 0.0001 | < 0.0001 |
| MCH-O (pg) | 20.8 | 28.7 | 30.6 (29.7–31.1) | 31.6 | 47.5 | – | – | 0.3995 |
| MCH-I 37°C (pg) | 20.5 | 28.2 | 30.2 (29.8–30.9) | 33.1 | 46.7 | – | – | – |
| MCHC-RT (g/L) | 376 | 466 | 583 (531–881) | 1345 | 3364 | – | <0.0001 | <0.0001 |
| MCHC-O (g/L) | 291 | 312 | 331 (319–337) | 342 | 422 | – | – | 0.2122 |
| MCHC-I 37°C (g/L) | 281 | 306 | 325 (320–334) | 341 | 409 | – | – | – |
Min: lowest value; CI: confidence interval; Max: highest value; RBC: red blood cell; HGB: hemoglobin concentration; HCT: hematocrit; MCV: mean cell volume; MFV: most frequent volume; MCH: mean hemoglobin concentration; MCHC: mean cellular hemoglobin concentration; O: optical; I: impedance; P: photometric; RT: room temperature.
Statistically significant variation p-value < 0.0001. Statistically significant differences in bold.
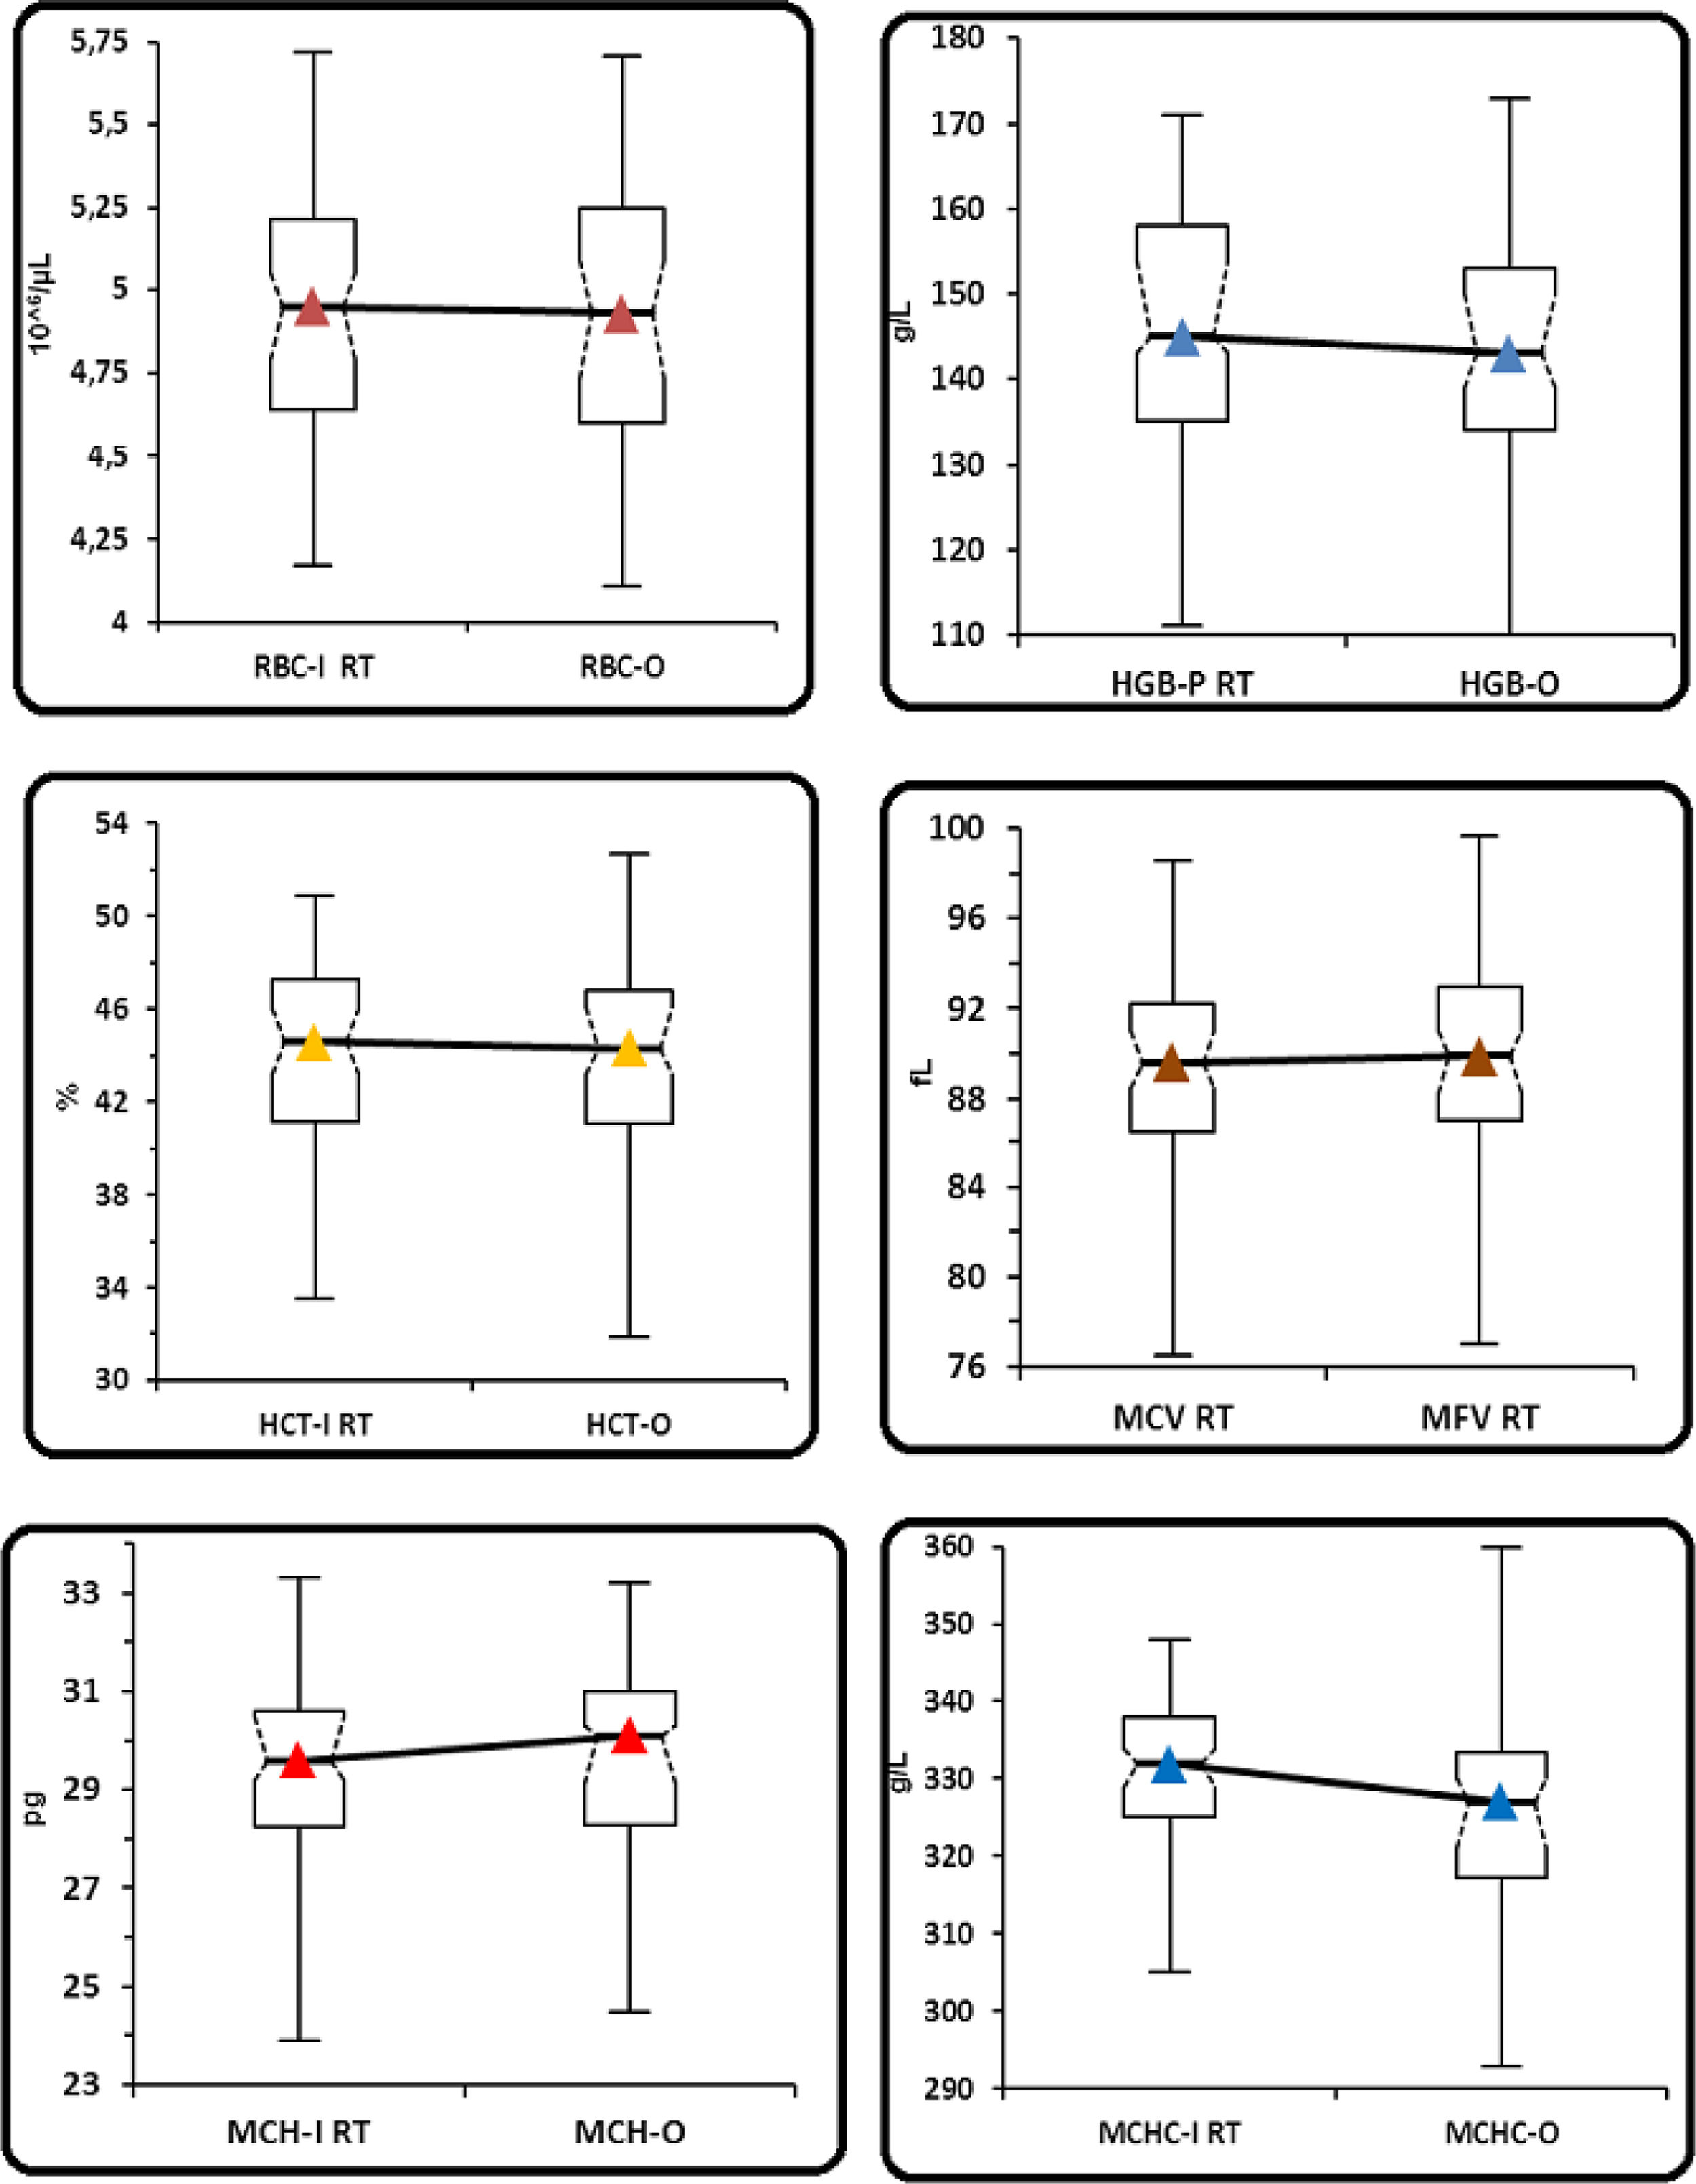
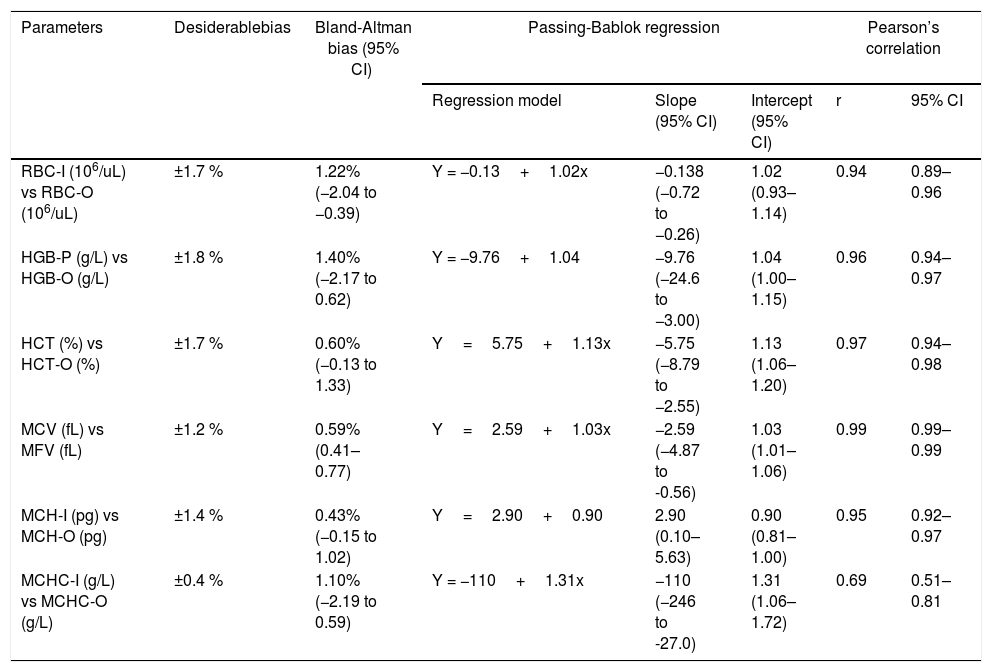
In the control group samples (group 1), no statistically significant differences were observed between RBC-I and RBC-O (p=0.1611), HGB and HGB-O (p=0.1461), HCT and rec-HCT-O (p=0.0691), MCV and MFV (p=0.0654), MCH-I and rec-MCH-O (p=0.1881) and MCHC-I and rec-MCHC-O (p= 0.018) (Table 1 and Figure 1). A strong correlation was observed for all the parameters, considered with a coefficient of correlation (r) between 0.94 and 0.99, except for the MCHC with a value of r=0.69. (Table 4). The bias between the values obtained in the I-Channel and those obtained in the RET channel for all considered parameters was insignificant and remained within the limits of acceptability, as reported by Ricos et al., except for the MCHC (Table 4).9 The mean value of delta RBC (ratio between RBC-O and RBC-I, without preheating at 37°C/2h) was 0.99, with a minimum value of 0.95 and a maximum value of 1.04 (Table 3).
. Comparison between the parameters performed in the I-channel at room temperature and after warming at 37°C/2h with those obtained in the RET channel through box and whiskers plot. Box and whiskers plot that corresponds to: median, 1st and 3rd quartiles, minimum and maximum of the values and IC 95% for the median indicated as a plot notch on the box. RBC: Red blood cell; HGB: hemoglobin concentration; HCT: hematocrit; MCV: mean cell volume; MFV: most frequent volume; MCH: mean hemoglobin concentration; MCHC: mean cellular hemoglobin concentration, O: optical; I: Impedance; P: photometric.")
(Group 1). Comparison between the parameters performed in the I-channel at room temperature and after warming at 37°C/2h with those obtained in the RET channel through box and whiskers plot. Box and whiskers plot that corresponds to: median, 1st and 3rd quartiles, minimum and maximum of the values and IC 95% for the median indicated as a plot notch on the box.
RBC: Red blood cell; HGB: hemoglobin concentration; HCT: hematocrit; MCV: mean cell volume; MFV: most frequent volume; MCH: mean hemoglobin concentration; MCHC: mean cellular hemoglobin concentration, O: optical; I: Impedance; P: photometric.
Group 1: comparison among all parameters performed in the I-channel whithout prewarming and RET channel by Bland-Altman Bias, Passing-Bablok regression and Pearson’s correlation.
| Parameters | Desiderablebias | Bland-Altman bias (95% CI) | Passing-Bablok regression | Pearson’s correlation | |||
|---|---|---|---|---|---|---|---|
| Regression model | Slope (95% CI) | Intercept (95% CI) | r | 95% CI | |||
| RBC-I (106/uL) vs RBC-O (106/uL) | ±1.7 % | 1.22% (−2.04 to −0.39) | Y = −0.13+1.02x | −0.138 (−0.72 to −0.26) | 1.02 (0.93–1.14) | 0.94 | 0.89–0.96 |
| HGB-P (g/L) vs HGB-O (g/L) | ±1.8 % | 1.40% (−2.17 to 0.62) | Y = −9.76+1.04 | −9.76 (−24.6 to −3.00) | 1.04 (1.00–1.15) | 0.96 | 0.94–0.97 |
| HCT (%) vs HCT-O (%) | ±1.7 % | 0.60% (−0.13 to 1.33) | Y=5.75+1.13x | −5.75 (−8.79 to −2.55) | 1.13 (1.06–1.20) | 0.97 | 0.94–0.98 |
| MCV (fL) vs MFV (fL) | ±1.2 % | 0.59% (0.41–0.77) | Y=2.59+1.03x | −2.59 (−4.87 to -0.56) | 1.03 (1.01–1.06) | 0.99 | 0.99–0.99 |
| MCH-I (pg) vs MCH-O (pg) | ±1.4 % | 0.43% (−0.15 to 1.02) | Y=2.90+0.90 | 2.90 (0.10–5.63) | 0.90 (0.81–1.00) | 0.95 | 0.92–0.97 |
| MCHC-I (g/L) vs MCHC-O (g/L) | ±0.4 % | 1.10% (−2.19 to 0.59) | Y = −110+1.31x | −110 (−246 to -27.0) | 1.31 (1.06–1.72) | 0.69 | 0.51–0.81 |
RBC: red blood cell; HGB: hemoglobin concentration; HCT: hematocrit; MCV: mean cell volume; MFV: most frequent volume; MCH: mean hemoglobin concentration; MCHC: mean cellular hemoglobin concentration; O: optical; I: impedance; P: photometric.
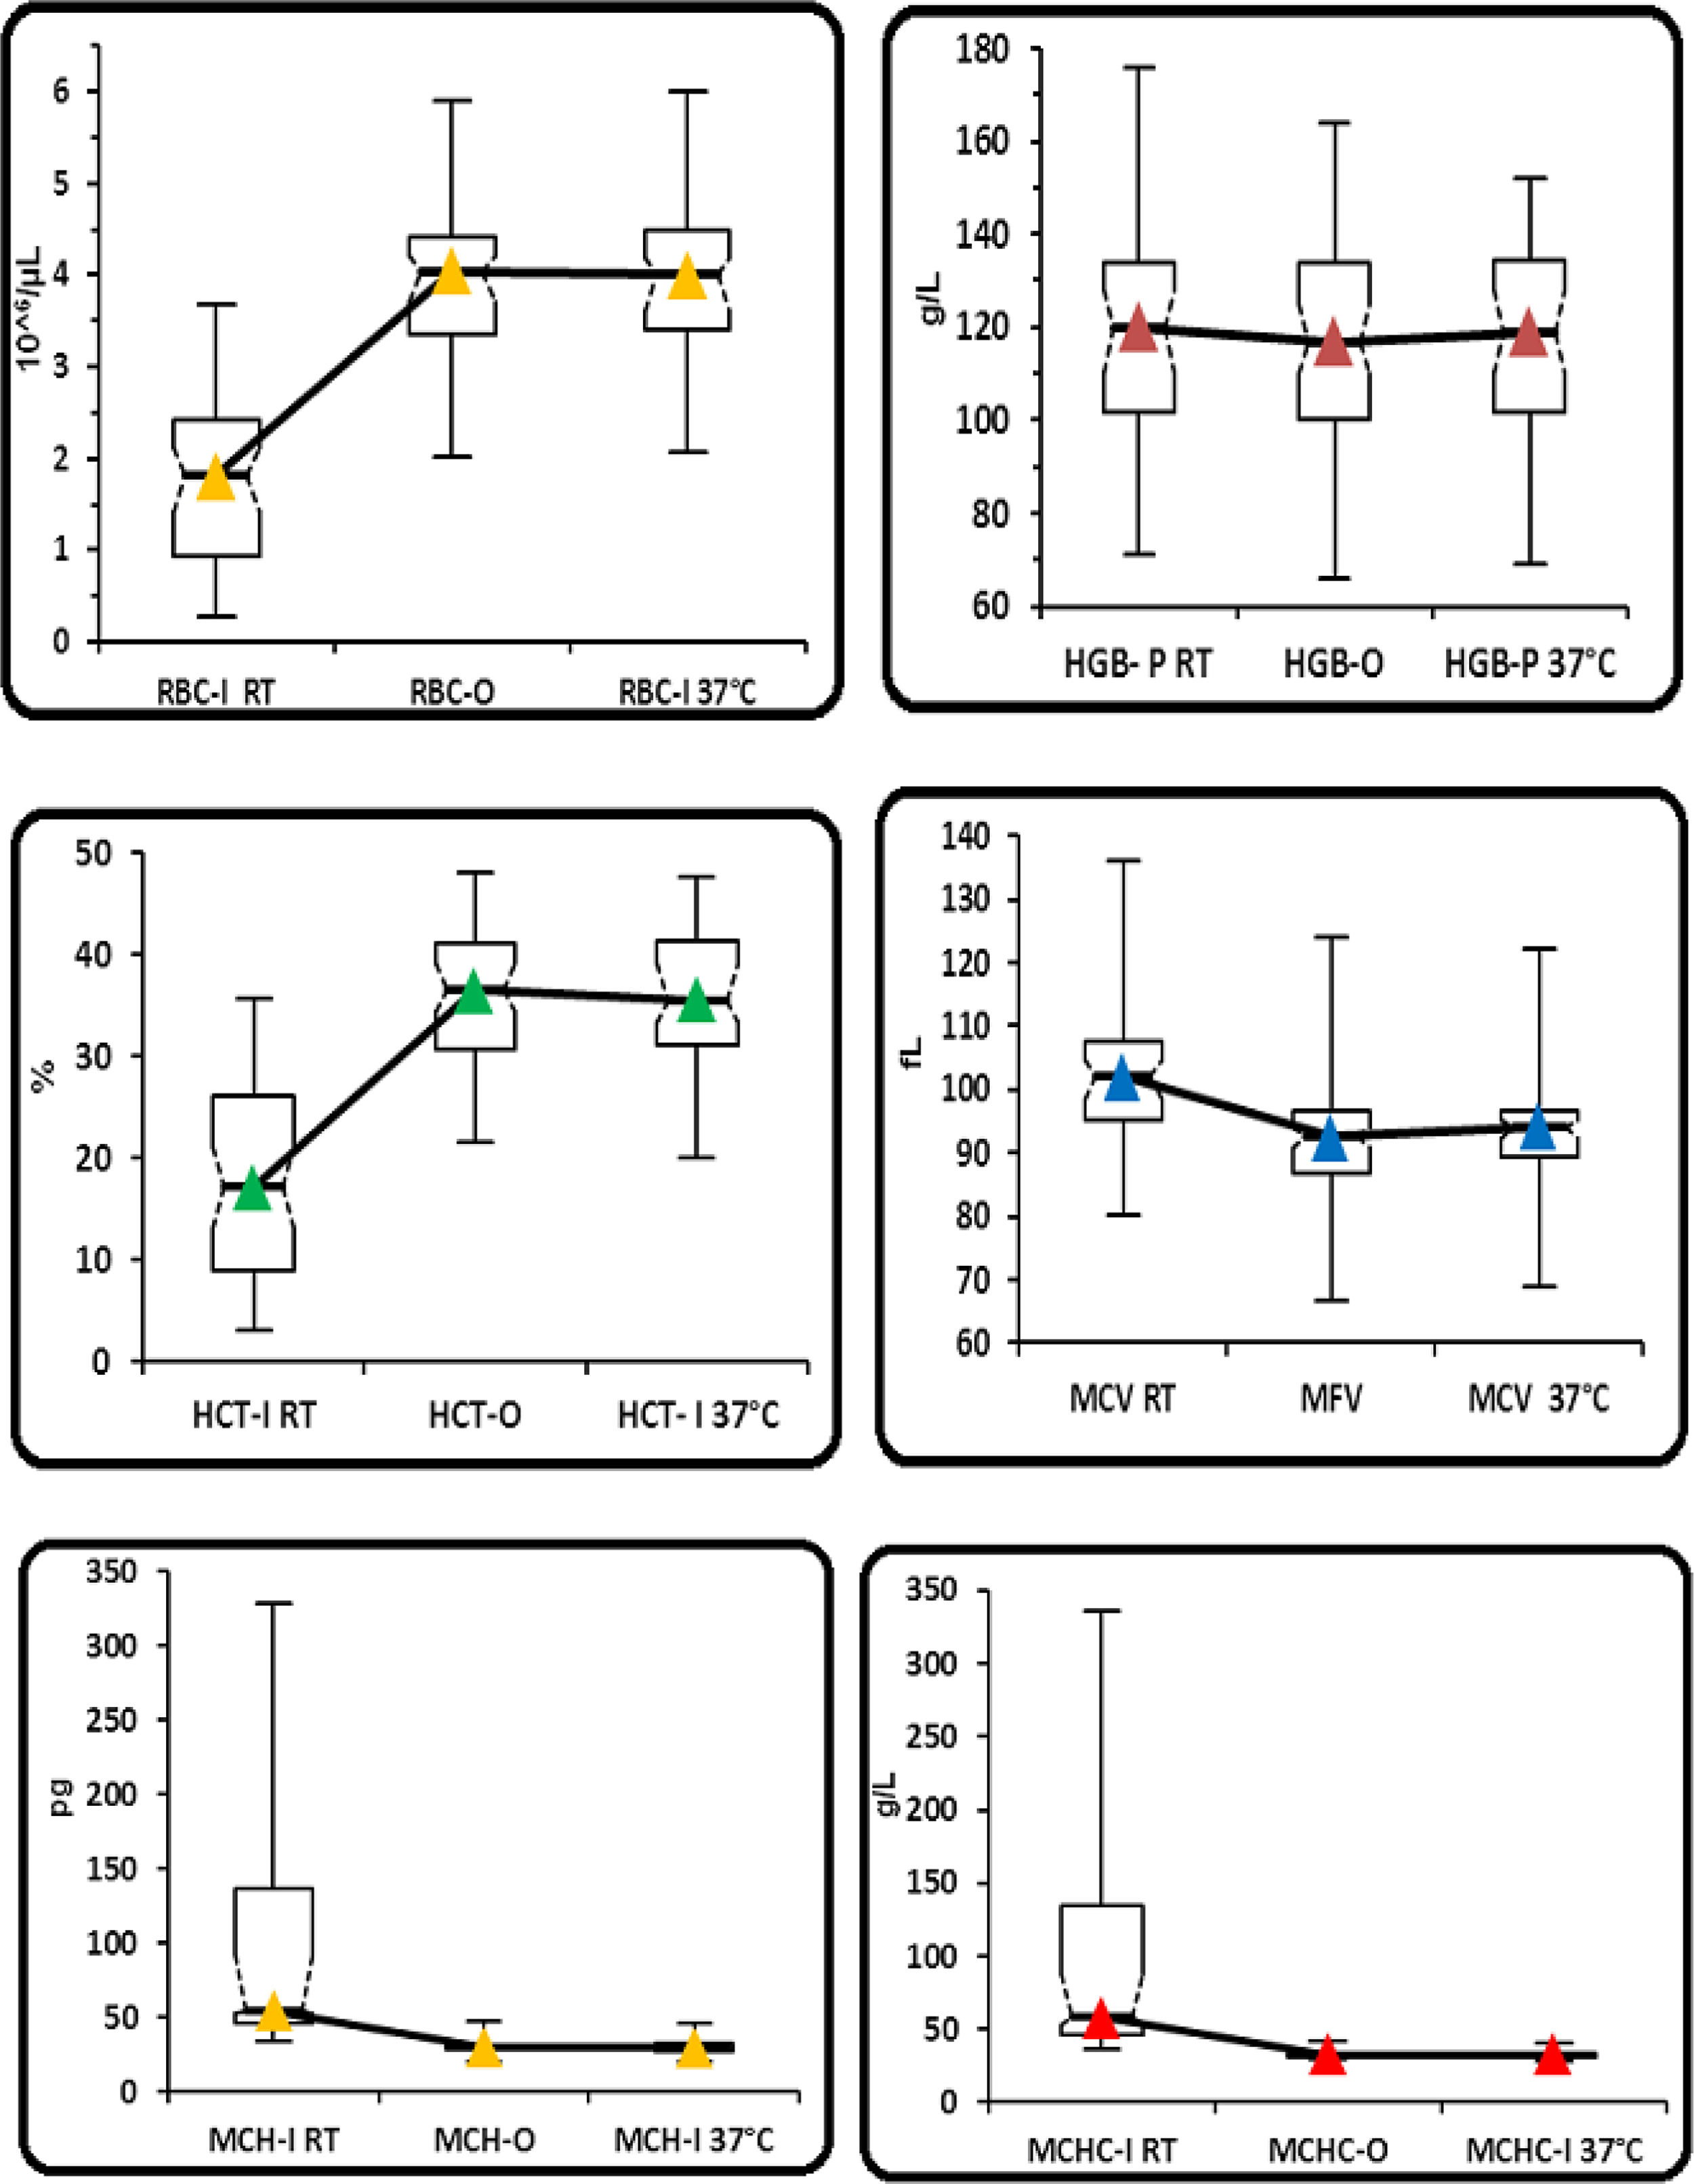
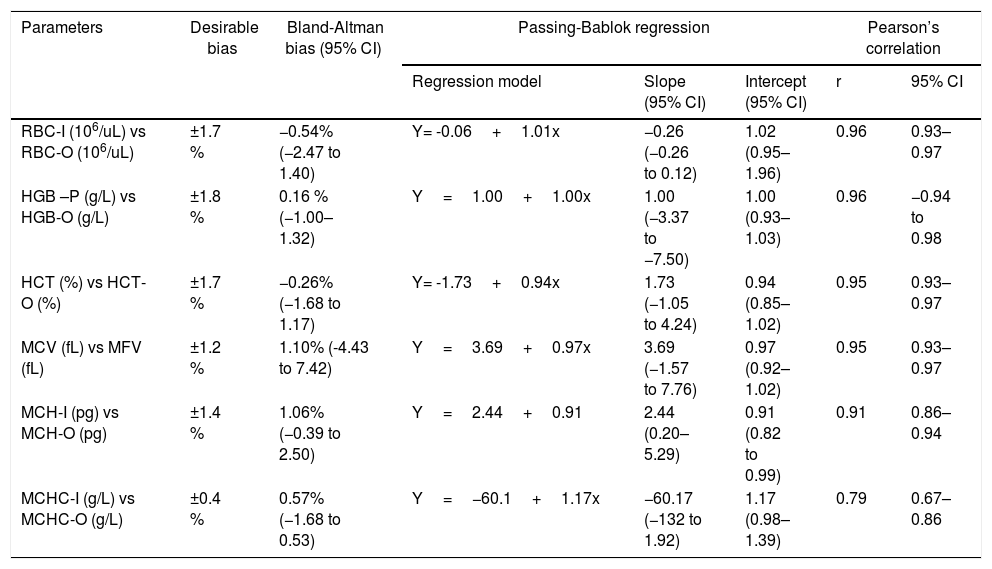
In group 2, statistically significant differences were observed for all the parameters obtained without preheating and those obtained with the optical method and with the impedance method, after preheating to 37°C/2h, except for the HGB (Table 2 and Figure 2). No statistically significant differences were found between the RBC-I preheated to 37°C/2h and the RBC-O (p=0.7860), as well as between the HGB and the HGB-O (p=0.4200), the HCT and the rec−HCT-O (p= 0.6808), the MFV and the MCV (p=0.0014), the MCH and the rec-MCH-O (p=0.3995) and the MCHC and the rec-MCHC-O (p=0.2122) (Table 2). An excellent correlation was found between all parameters obtained in the RET channel and the values obtained in the I-Channel, after preheating to 37°C/2h, except for the MCHC (r=0.79) (Table 5). The bias for all the parameters of the group 2 are shown in Table 5. The overall bias between all parameters obtained with the RET channel and I-channel after preheating to 37°C/2h were not relevant, except for the MCHC (Table 5). Furthermore, the percentage of the variations of all parameters has been compared to the current quality specifications. Values above the acceptable limit, as reported by Ricos et al., were observed only for the MCHC; for all other parameters, the bias remained within the acceptable limits (Table 5).15 The mean value of the delta RBC (ratio between RBC-O and RBC-I without preheating) was 3.27, with a minimum value of 1.01 and maximum value of 13.6. The mean value of the delta RBC (ratio between the RBC-O and RBC-I within preheating at 37°C/2h) was 1.01, with a minimum value of 0.91 and maximum value of 1.53 (Table 3). Moreover, the sensitivity and specificity of the delta RBC in the detection of RBCs with cold agglutinins was evaluated and calculated as 0.99% and 100% respectively, with an AUC=0.99 and a cut-off > 1.04.
. Comparison between the parameters performed in the I-channel at room temperature and after warming at 37°C/2h with those obtained in the RET channel through box and whiskers plot. Box and whiskers plot that corresponds to: median, 1st and 3rd quartiles, minimum and maximum of the values and IC 95% for the median indicated as a plot notch on the box. RBC: Red blood cell; HGB: hemoglobin concentration; HCT: hematocrit; MCV: mean cell volume; MFV: most frequent volume; MCH: mean hemoglobin concentration; MCHC: mean cellular hemoglobin concentration, O: optical; I: impedance; P: photometric.")
(Group 2). Comparison between the parameters performed in the I-channel at room temperature and after warming at 37°C/2h with those obtained in the RET channel through box and whiskers plot. Box and whiskers plot that corresponds to: median, 1st and 3rd quartiles, minimum and maximum of the values and IC 95% for the median indicated as a plot notch on the box.
RBC: Red blood cell; HGB: hemoglobin concentration; HCT: hematocrit; MCV: mean cell volume; MFV: most frequent volume; MCH: mean hemoglobin concentration; MCHC: mean cellular hemoglobin concentration, O: optical; I: impedance; P: photometric.
Group 2: comparison among all parameters performed in the I-channel prewarmed to 37°C/2h and RET channel by Bland-Altman Bias, Passing-Bablok regression and Pearson’s correlation.
| Parameters | Desirable bias | Bland-Altman bias (95% CI) | Passing-Bablok regression | Pearson’s correlation | |||
|---|---|---|---|---|---|---|---|
| Regression model | Slope (95% CI) | Intercept (95% CI) | r | 95% CI | |||
| RBC-I (106/uL) vs RBC-O (106/uL) | ±1.7 % | −0.54% (−2.47 to 1.40) | Y= -0.06+1.01x | −0.26 (−0.26 to 0.12) | 1.02 (0.95–1.96) | 0.96 | 0.93–0.97 |
| HGB –P (g/L) vs HGB-O (g/L) | ±1.8 % | 0.16 % (−1.00–1.32) | Y=1.00+1.00x | 1.00 (−3.37 to −7.50) | 1.00 (0.93–1.03) | 0.96 | −0.94 to 0.98 |
| HCT (%) vs HCT-O (%) | ±1.7 % | −0.26% (−1.68 to 1.17) | Y= -1.73+0.94x | 1.73 (−1.05 to 4.24) | 0.94 (0.85–1.02) | 0.95 | 0.93–0.97 |
| MCV (fL) vs MFV (fL) | ±1.2 % | 1.10% (-4.43 to 7.42) | Y=3.69+0.97x | 3.69 (−1.57 to 7.76) | 0.97 (0.92–1.02) | 0.95 | 0.93–0.97 |
| MCH-I (pg) vs MCH-O (pg) | ±1.4 % | 1.06% (−0.39 to 2.50) | Y=2.44+0.91 | 2.44 (0.20–5.29) | 0.91 (0.82 to 0.99) | 0.91 | 0.86–0.94 |
| MCHC-I (g/L) vs MCHC-O (g/L) | ±0.4 % | 0.57% (−1.68 to 0.53) | Y=−60.1+1.17x | −60.17 (−132 to 1.92) | 1.17 (0.98–1.39) | 0.79 | 0.67–0.86 |
RBC: red blood cell; HGB: hemoglobin concentration; HCT: hematocrit; MCV: mean cell volume; MFV: most frequent volume; MCH: mean hemoglobin concentration; MCHC: mean cellular hemoglobin concentration. O: optical; I: impedance; P: photometric.
Samples with the delta RBC (ratio between the RBC-O and RBC-I within preheating at 37°C/2h) > 1.04 was 34 out of 78, whereas samples with the delta RBC (ratio between the RBC-O and RBC-I without preheating at 37°C/2h) > 1.04 was 78 out of 78. The MCHC<370g/L obtained in the RET channel was found in 77 out of 78 samples, with cold agglutinins. Finally, in 76 out of 78 samples obtained after preheating at 37°C/2h, the MCHC<370g/L was found.
DiscussionThe presence of cold agglutinins is often a random laboratory finding associated with RBC counting difficulties, with a spurious increase in the MCHC and decrease in the RBCs. Several methods have been used to inhibit the presence of cold agglutinins, of which the most widely used so far is incubation at 37°C for 2h in a hot water bath.16 Recently the RBC count was proposed in the RET channel of the Sysmex analyzer heated to 41°C, without preheating.13
Before using the RET channel heated to 41°C for samples with cold agglutinins, it was decided to compare the two channels (I-channel and RET channel), using samples that showed no flag and with the MCHC<370g/L. A strong correlation was found for all parameters, except for the MCHC (r=0.69) (Table 4). Furthermore, all the parameters were compared to the current quality specifications and only for the MCHC a value above the acceptable limit ± 0.4% was observed, as reported by Ricos et al. (Table 4). For the MCHC, being a derived parameter, it is possible that the variability of the direct measurements that compose it tends to add up in its estimate, increasing the bias.
Considering these data, we decided to use the channel heated to 41°C as a reflex test also for all samples with the MCHC over 370g/L. The recalculation of the parameters (MCHC-O, MCH-O and HCT-O) obtained from the reflex test in the RET channel was managed automatically, using the APP-CBO. From the data of our study on the group of samples with cold agglutinins, it emerged that, in a high percentage of samples (77/78), the MCHC recalculated after the counting of RBCs in the RET channel was < 370g/L. Only in one sample the MCHC was discarded due to an incorrect value. This was due to the difficulty of the instrument in aspirating the sample because of the high content of cold agglutinins. Thus, the sample was obtained using the traditional method after incubation for 2h at 37°C. In 76/78 samples, the MCHC obtained from the impedance channel after heating at 37°C/2h was <370g/L. In the two samples with the MCHC>370g/L, in addition to the cold agglutinins, the presence of turbid plasma was found, with the consequent overestimation of the photometric hemoglobin. For these two samples, there is a difference in the HGB between the two methods (HGB-O and HGB-P) of 15g/L and 23g/L, respectively. After the substitution of the turbid plasma with the Cellpack, the photometric hemoglobin values were comparable to those of the optical hemoglobin obtained without plasma substitution. Despite the low MCHC, 44/78 samples show an incomplete reversibility of cold agglutinins, as shown by the delta RBC values (ratio between RBC-O and RBC-I within preheating at 37°C/2h) ranging between 0.91 and 1.55. This is due to, as also reported by La Gioia et al., the presence of small agglutinates.11 The small agglutinates are counted as large RBCs that cause a spurious increase in the MCV, with the consequent increase in the HTC and decrease in the MCHC.11
Other cases in which the spurious MCHC values may be due to the presence of turbid samples (icterus and lipemia), while in other cases the presence of high MCHC levels may be due to erythrocyte diseases, such as spherocytosis. For these reasons, in the case of high MCHC, a slide should be performed to assess whether the increase is due to the cold agglutinins or to other causes, as previously mentioned. Furthermore, in the case of cold agglutinins, a second slide should be made after preheating the sample to 37°C to confirm or exclude the presence of residual cold agglutinins.
ConclusionsThe presence of cold agglutinins in blood samples can be detected by a spurious lowering of the RBC count and by a spurious increase in the MCHC. The use of the heated RET channel can be considered an excellent opportunity for the hematological clinic, since the RBC-O values obtained after the 1-min incubation at 41°C correlate very well with the traditional RBC-I values. Furthermore, there is a marked decrease of the turnaround time, unlike the traditional method, and the possibility of automatically managing the calculation of the derived parameters, using the APP-CBO and avoiding impending errors in calculations and manual data entry. However, as shown by our data and in agreement with other studies, neither of these methodological approaches can completely solve the residual presence of cold agglutinins in all the samples, despite the MCHC values being < 370g/L.11,12
Conflicts of interestThe authors declare no conflicts of interest.


