
Aberrant expression of long non-coding RNAs (lncRNAs) has been detected in several types of cancer, including acute lymphoblastic leukemia (ALL), but lncRNA mapped on transcribed ultraconserved regions (T-UCRs) are little explored. The T-UCRs uc.112, uc.122, uc.160 and uc.262 were evaluated by quantitative real-time PCR in bone marrow samples from children with T-ALL (n=32) and common-ALL/pre-B ALL (n=30). In pediatric ALL, higher expression levels of uc.112 were found in patients with T-ALL, compared to patients with B-ALL. T-cells did not differ significantly from B-cells regarding uc.112 expression in non-tumor precursors from public data. Additionally, among B-ALL patients, uc.112 was also found to be increased in patients with hyperdiploidy, compared to other karyotype results. The uc.122, uc.160, and uc.262 were not associated with biological or clinical features. These findings suggest a potential role of uc.112 in pediatric ALL and emphasize the need for further investigation of T-UCR in pediatric ALL.
Acute lymphoblastic leukemia (ALL) is the most common childhood malignant neoplasia. Despite progress in current treatment, almost 20% of affected children relapse and the causes of the disease are still unknown.1 Considering the ALL heterogeneity, new efforts aim to understand the main features of each subtype, including differences between T-ALL and precursor B-ALL.
Recently, the expression patterns of long non-coding ribonucleic acids (lncRNAs) have been highly informative in differentiating several types of cancer, including ALL.2,3 Curiously, many lncRNAs are poorly conserved among different species, when compared to protein-coding genes.4 However, this lack of sequence conservation is not valid for lncRNAs mapped in ultraconserved regions.
Ultraconserved regions (UCRs) are 481 segments, longer than 200 nucleotides, initially identified as a result of bioinformatic comparisons between the human, mouse, and rat genomes. These regions are widely distributed and may overlap exonic, intronic, and intergenic regions.5 Additionally, most human tissues express these regions, the so-called transcribed UCRs (T-UCRs).6
The initial evidence for T-UCR association with cancer came from the description of distinct expression signatures in adult chronic lymphocytic leukemia and in colorectal and hepatocellular carcinoma.6 Since then, many studies have consistently shown T-UCR deregulation in several human tumors.7 However, in patients with ALL, these regions have not been investigated in patients with ALL.
The objective of the present study was to evaluate the expression levels of uc.112, uc.122, uc.160, and uc.262 in children with ALL. These T-UCRs are intergenic non-coding RNAs, and they were chosen due to their previously reported association with at least two different tumor types or hematopoietic processes.6–11
Materials and methodsPatientsBone marrow samples were obtained at diagnosis from patients with T-ALL (n=32) and common-ALL/pre-B ALL (n=30), treated according to the Brazilian Childhood Leukemia Treatment protocol.12 Among the samples from patients with B-ALL, seven had t(12;21) and nine showed hyperdiploidy. Unfavorable events (death due to any cause or relapse) occurred in 17 patients. Additional biological and clinical features are described in Table S1. The study was approved by the National Research Ethics Committee (CONEP, No. 7329/2009), and samples were collected after obtaining written informed consent.
RNA extraction, complementary deoxyribonucleic acid (cDNA) synthesis and quantitative real-time polymerase chain reaction (qRT-PCR)A Ficoll-Paque centrifugation gradient was used to separate mononucleated cells and total cellular RNA was extracted using the Trizol Reagent (Invitrogen, Carlsbad, CA, USA) and checked for RNA integrity with an Agilent Bioanalyzer 2100 (Agilent Technologies, Santa Clara, CA, US). An 800ng amount of total RNA, with an RNA integrity number (RIN) above 7 and treated with deoxyribonuclease (DNAse) (0.4 U), was retrotranscribed with random primers and the Superscript III (Applied Biosystems, Foster City, CA) and the RT-qPCR was performed using the SYBR Green dye staining. Each 20μl reaction contained 0.5μl cDNA, 1x Power SYBR Green PCR Master Mix (Applied Biosystems) and 200nM for each primer. The primer sequences used are described in Table S2 and the amplification efficiency of each primer was 95–105%.
The T-UCR levels were measured using the ABI 7500 Real-Time PCR System (PE Applied Biosystems). The relative expression was calculated by the 2−ΔΔCT method with two internal controls (GUS-GAPDH) and the expression in the ReH cell line was used as the calibrator for all reactions. The RT-qPCR was performed in triplicate and a maximum standard deviation of <0.5 was accepted. No template control was run in parallel within each experiment.
Statistical analysisA pilot study was performed with 18 patient samples (9 B-ALL and 9 T-ALL, representative of the entire cohort) in order to assess an effective expression of 6 T-UCRs (uc.112, uc.122, uc.160, uc.252, uc.262, uc.316), but uc.252 and uc.316 expression was detected in less than 45 % of the samples analyzed and these two regions were removed from further analysis. A small variation in endogenous β-glucuronidase (GUS) and glyceraldehyde-3-phosphate dehydrogenase (GAPDH) expression across different samples was also checked. Thirty B-ALL samples and 32 T-ALL samples were evaluated after these preliminary analyses.
The Mann–Whitney test was applied to determine the association between the variables analyzed (age, white blood cell count at diagnosis, immunophenotype, hyperdiploid karyotype, and t(12;21) presence) and T-UCR expression levels.
Patients were stratified according to values below and above the median for survival analyses. The Kaplan–Meier curves and log-rank test were used to estimate overall survival (OS), which was calculated from the date of diagnosis to death or to the last follow-up and event-free survival (EFS), which was calculated from the date of diagnosis to the last follow-up or unfavorable event (relapse and/or death).
The Cox proportional regression model was used for multivariate analysis of prognostic factors (including age, white blood cell count at diagnosis and hyperdiploid karyotype presence) and also to estimate the association between lower- or higher-than-median expression values and risk of an unfavorable event, with calculation of the hazard ratio (HR) and 95% confidence interval (95% CI).
Bioinformatic analysisIn order to determine the uc.112 expression in non-tumor B and T blast cells, we obtained high-throughput RNA sequencing (RNAseq) data from Casero et al., and evaluated the uc.112 expression in fully B-cell-committed progenitors (CD34+CD38+CD19+) from bone marrow and fully T-cell-committed populations (CD4+CD8+) from the thymus.13
First, we downloaded the raw sequence files that are available at the NCBI Gene Expression Omnibus website, with the access code GSE69239. The FastQC,14 MultiQC,15 and Trim Galore16 software was used to analyze the quality control of raw sequence data and adapter trimming. Next, the abundance of transcripts was quantified by the methods of Salmon17 and Kallisto,18 which are based on the idea of pseudoalignment determining the compatibility of reads with targets, without the need for alignment. The tximport19 package was used to read the previously generated quantification files, thus generating the counting table for differential expression analysis, using the DESeq2 package.20
Regulatory elements associated with the genomic position of uc.112 were evaluated with “The Encyclopedia of DNA Elements (ENCODE)” data available at the University of California, Santa Cruz (UCSC) platform (http://genome.ucsc.edu/).
The chr3:18169564-18169909 position was visualized with a zoom out of 3×, by accessing the UCSC Genome Browser GRCh37/hg19 Assembly and information on transcription factors was included by combining chromatin immunoprecipitation assays with sequencing (ChIP-seq). The UCSC contained the transcription factor ChIP-seq, evaluated from 161 factors in 91 cell types from ENCODE.21
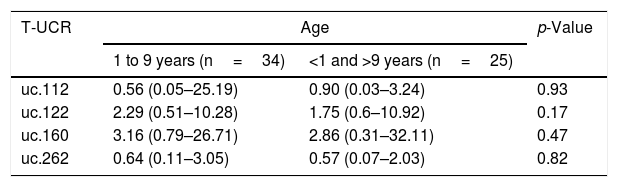
ResultsWe evaluated the expression levels of uc.112, uc.122, uc.160, uc.262 and the association between variables (age, white blood cell count at diagnosis, immunophenotype, hyperdiploid karyotype, and t(12;21) presence). The uc.122, uc.160, and uc.262 were not associated with the variables analyzed, including survival analysis (Tables 1 and 2).
Minimum, maximum and median T-UCR expression levels of multiples comparisons in ALL samples.
| T-UCR | Age | p-Value | |
|---|---|---|---|
| 1 to 9 years (n=34) | <1 and >9 years (n=25) | ||
| uc.112 | 0.56 (0.05–25.19) | 0.90 (0.03–3.24) | 0.93 |
| uc.122 | 2.29 (0.51–10.28) | 1.75 (0.6–10.92) | 0.17 |
| uc.160 | 3.16 (0.79–26.71) | 2.86 (0.31–32.11) | 0.47 |
| uc.262 | 0.64 (0.11–3.05) | 0.57 (0.07–2.03) | 0.82 |
| T-UCR | WBC at diagnosis | p-Value | |
|---|---|---|---|
| ≤50,000/mm3 (n=26) | >50,000mm3 (n=33) | ||
| uc.112 | 0.82 (0.03–25.19) | 0.53 (0.05–10.37) | 0.90 |
| uc.122 | 1.8 (0.51–10.92) | 2.19 (0.7–7.49) | 0.66 |
| uc.160 | 4.03 (0.79–32.11) | 2.56 (0.31–14.07) | 0.11 |
| uc.262 | 0.64 (0.07–2.61) | 0.53 (0.11–3.05) | 1.00 |
| T-UCR | Immunophenotype | p-Value | |
|---|---|---|---|
| B-ALL (n=30) | T-ALL (n=32) | ||
| uc.112 | 0.43 (0.05–1.46) | 1.10 (0.03–25.19) | 0.003 |
| uc.122 | 1.76 (0.51–4.02) | 2.19 (0.29–10.92) | 0.08 |
| uc.160 | 2.48 (0.79–11.41) | 4.03 (0.31–32.11) | 0.12 |
| uc.262 | 0.67 (0.11–3.05) | 0.36 (0.07–32.11) | 0.44 |
| T-UCR | Hyperdiploid | p-Value | |
|---|---|---|---|
| Presence (n=9) | Absence (n=21) | ||
| uc.112 | 0.95 (0.70–1.46) | 0.30 (0.05–1.06) | <0.001 |
| uc.122 | 2.12 (1.46–3.32) | 1.61 (0.6–4.02) | 0.47 |
| uc.160 | 4.69 (2.09–11.41) | 1.73 (0.92–7.28) | 0.12 |
| uc.262 | 0.8 (0.33–0.8) | 0.53 (0.14–3.05) | 0.25 |
| T-UCR | t(12;21) | p-Value | |
|---|---|---|---|
| Presence (n=7) | Absence (n=23) | ||
| uc.112 | 0.26 (0.06–1.06) | 0.51 (0.05–1.46) | 0.24 |
| uc.122 | 1.15 (0.51–2.46) | 2.12 (0.6–4.02) | 0.23 |
| uc.160 | 1.71 (0.79–7.2) | 2.73 (0.92–11.41) | 0.48 |
| uc.262 | 0.67 (0.49–2.61) | 0.69 (0.11–3.05) | 0.45 |
WBC: white blood cell count at diagnosis. The p-value calculated by the Mann–Whitney test. Bold value indicates statistically significant (p<0.05).
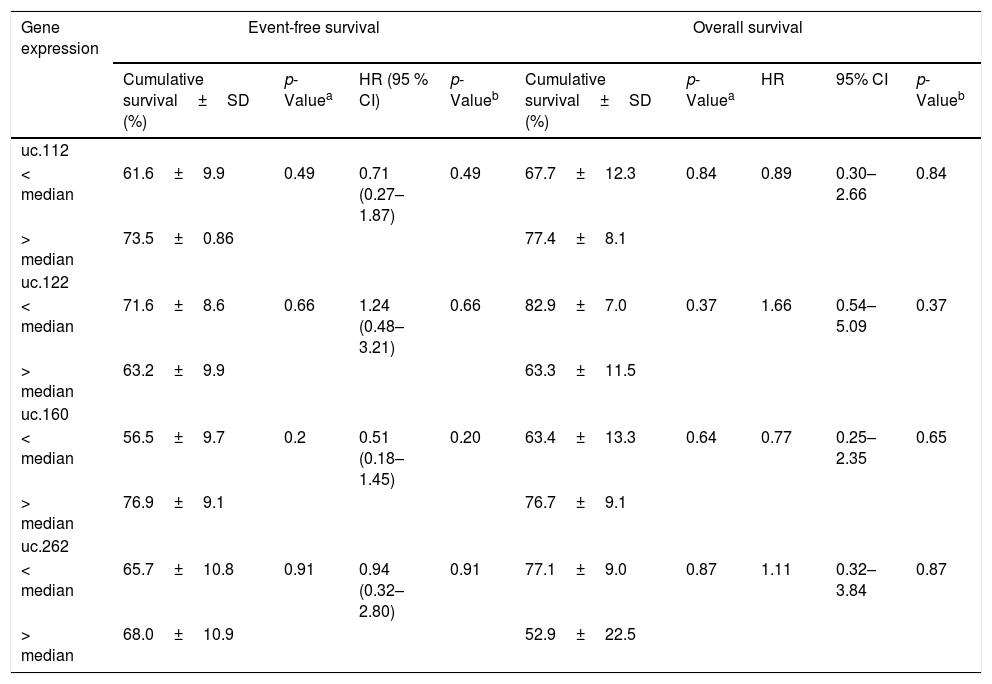
Association with event-free survival (EFS), overall survival (OS) and gene expression levels of T-UCRs in children with ALL.
| Gene expression | Event-free survival | Overall survival | |||||||
|---|---|---|---|---|---|---|---|---|---|
| Cumulative survival±SD (%) | p-Valuea | HR (95 % CI) | p-Valueb | Cumulative survival±SD (%) | p-Valuea | HR | 95% CI | p-Valueb | |
| uc.112 | |||||||||
| < median | 61.6±9.9 | 0.49 | 0.71 (0.27–1.87) | 0.49 | 67.7±12.3 | 0.84 | 0.89 | 0.30–2.66 | 0.84 |
| > median | 73.5±0.86 | 77.4±8.1 | |||||||
| uc.122 | |||||||||
| < median | 71.6±8.6 | 0.66 | 1.24 (0.48–3.21) | 0.66 | 82.9±7.0 | 0.37 | 1.66 | 0.54–5.09 | 0.37 |
| > median | 63.2±9.9 | 63.3±11.5 | |||||||
| uc.160 | |||||||||
| < median | 56.5±9.7 | 0.2 | 0.51 (0.18–1.45) | 0.20 | 63.4±13.3 | 0.64 | 0.77 | 0.25–2.35 | 0.65 |
| > median | 76.9±9.1 | 76.7±9.1 | |||||||
| uc.262 | |||||||||
| < median | 65.7±10.8 | 0.91 | 0.94 (0.32–2.80) | 0.91 | 77.1±9.0 | 0.87 | 1.11 | 0.32–3.84 | 0.87 |
| > median | 68.0±10.9 | 52.9±22.5 | |||||||
SD: standard deviation; HR: Hazard ratio; 95% CI: 95% confidence interval.
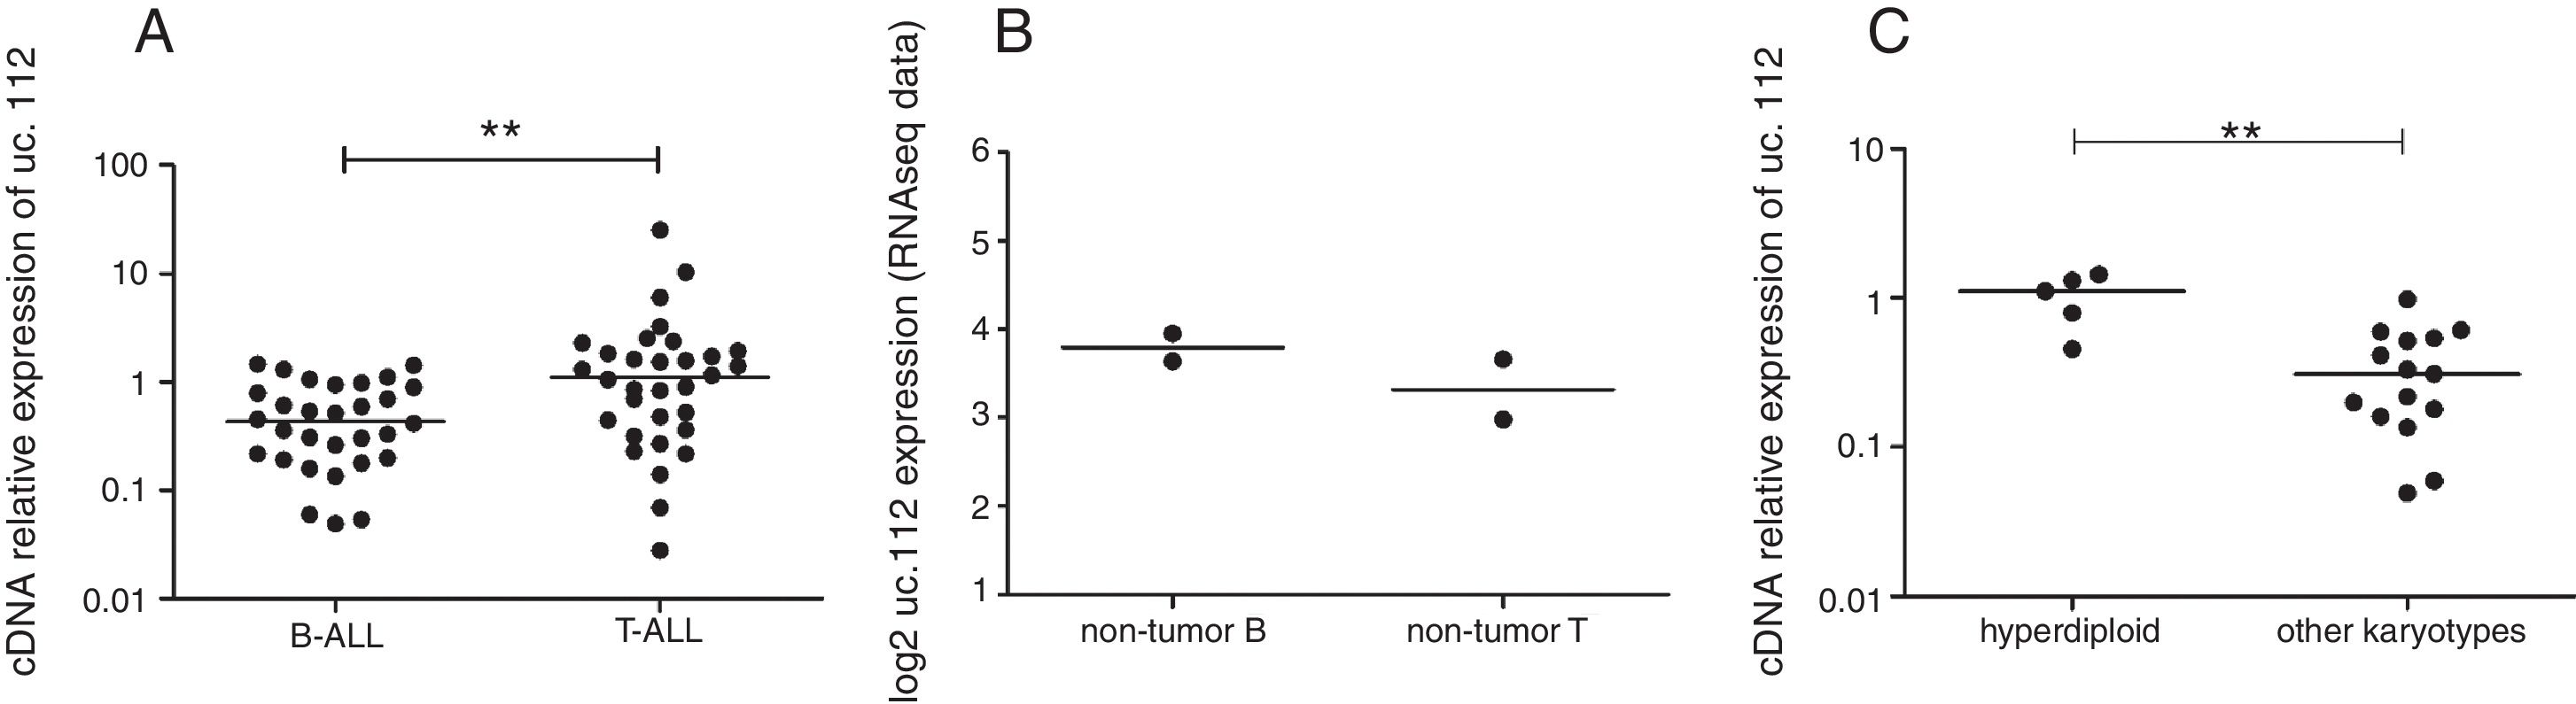
Higher expression levels of uc.112 were found in patients with T-ALL compared to patients with B-ALL (log2foldchange 4.08, p=0.003) (Fig. 1A). Additionally, Ct values of endogenous genes did not differ (p>0.05) among variables, reinforcing the feasibility of these endogenous genes for comparative expression analysis.
 and non-tumor cells. (A) Relative expression in patients with B-ALL (left) or T-ALL (right). (B) Expression value in non-tumor B precursor cells (left) or non-tumor T precursor (right). RNAseq values from public data,8 no significant difference. (C) Relative expression in patients with hyperdiploid karyotype (right) and absence of hyperdiploidy (left). **p<0.001, Mann–Whitney test.")
Expression levels of uc.112 in acute lymphoblastic leukemia (ALL) and non-tumor cells. (A) Relative expression in patients with B-ALL (left) or T-ALL (right). (B) Expression value in non-tumor B precursor cells (left) or non-tumor T precursor (right). RNAseq values from public data,8 no significant difference. (C) Relative expression in patients with hyperdiploid karyotype (right) and absence of hyperdiploidy (left). **p<0.001, Mann–Whitney test.
When the uc.112 expression was determined in non-tumor precursors from public data,13 no significant difference was observed between T and B cells (log2foldchange 0.82, p=0.49, Salmon analysis; log2foldchange 0.88, p=0.46, Kallisto analysis) (Fig. 1B).
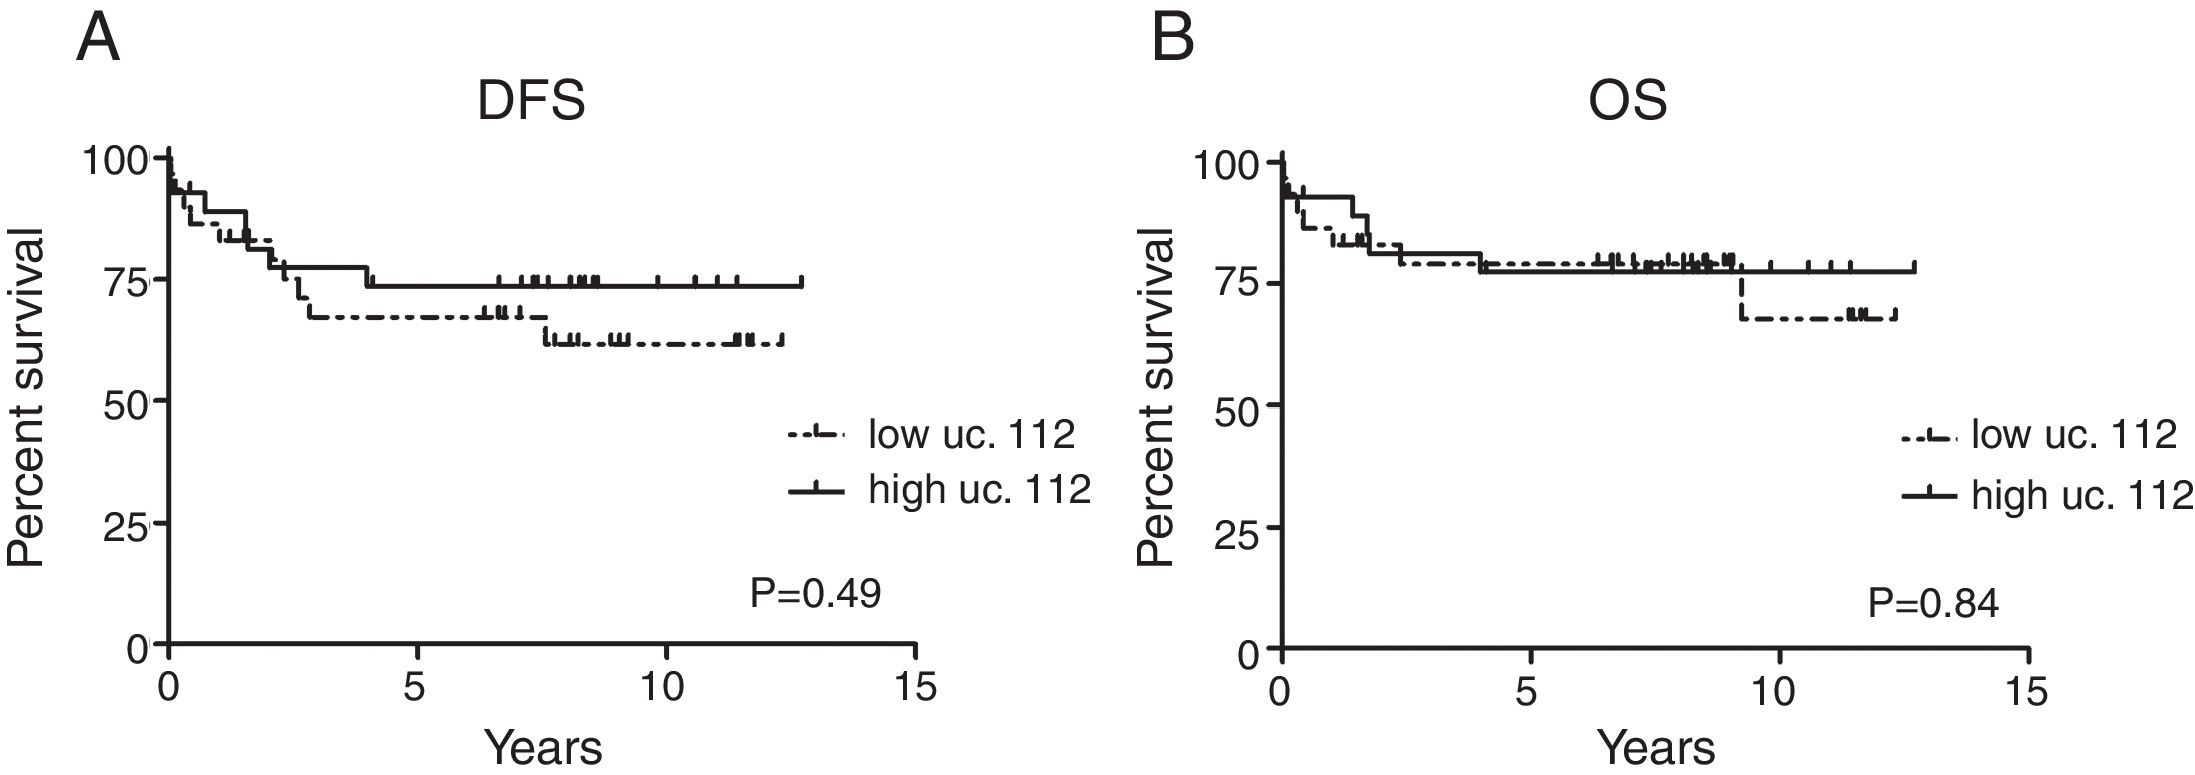
Additionally, among B-ALL patients, uc.112 was also found to be increased in patients with hyperdiploidy (p=0.0003) (Fig. 1C). Survival analysis was not significantly different according to the uc.112 expression values (Fig. 2, Table 3).
. B. Overall survival (OS). Log-rank test according to higher- or lower-than-median gene expression values.")
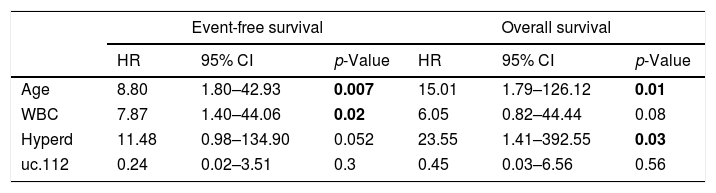
Multivariate Cox regression analysis of ALL patients with uc.112 expression data.
| Event-free survival | Overall survival | |||||
|---|---|---|---|---|---|---|
| HR | 95% CI | p-Value | HR | 95% CI | p-Value | |
| Age | 8.80 | 1.80–42.93 | 0.007 | 15.01 | 1.79–126.12 | 0.01 |
| WBC | 7.87 | 1.40–44.06 | 0.02 | 6.05 | 0.82–44.44 | 0.08 |
| Hyperd | 11.48 | 0.98–134.90 | 0.052 | 23.55 | 1.41–392.55 | 0.03 |
| uc.112 | 0.24 | 0.02–3.51 | 0.3 | 0.45 | 0.03–6.56 | 0.56 |
WBC: White blood cell count at diagnosis; Hyperd: hyperdiploid karyotype. HR: Hazard ratio; 95% CI: 95% confidence interval; bold - statistically significant (p<0.05).
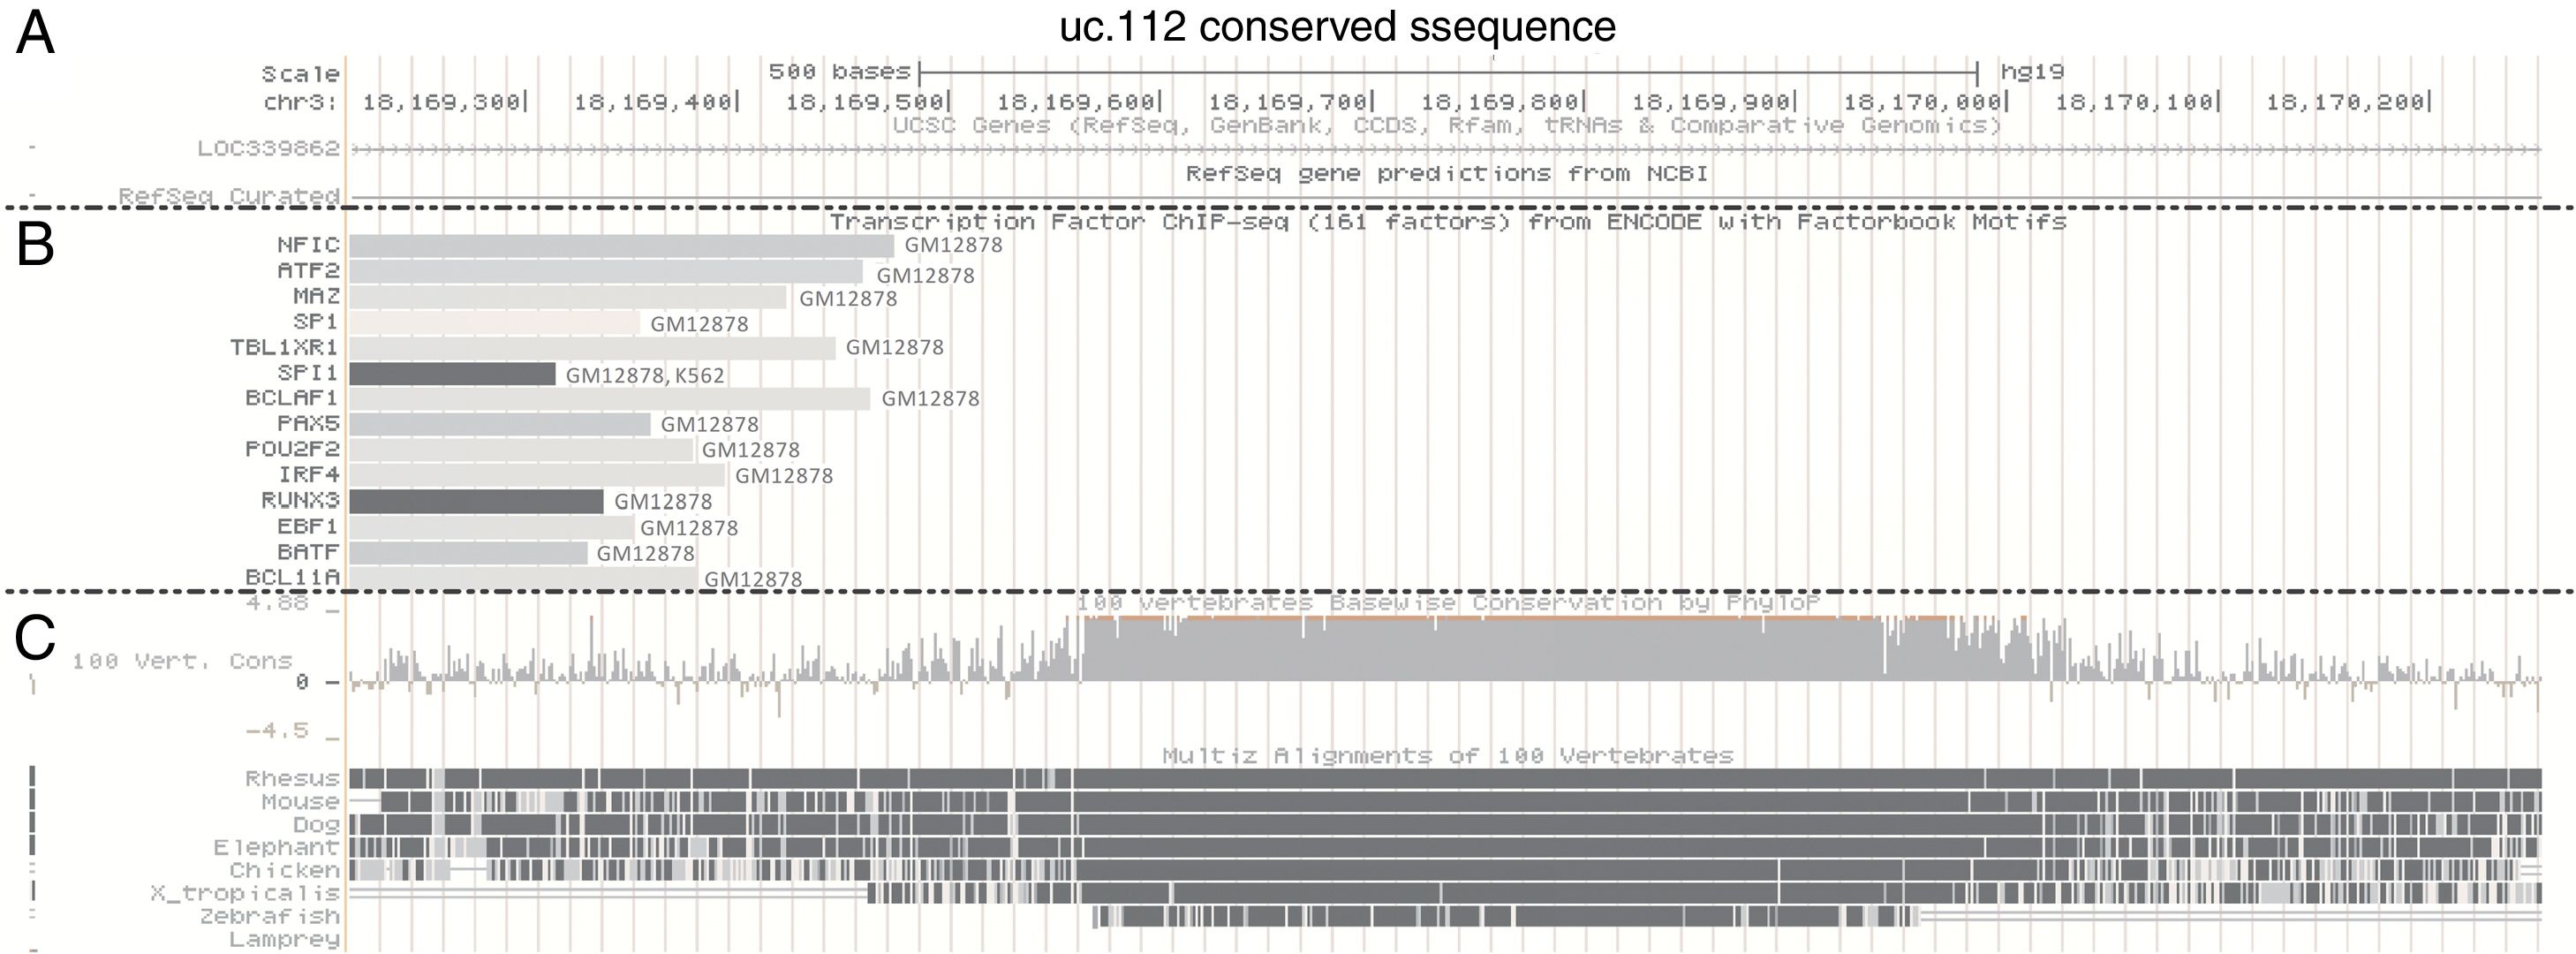
Using bioinformatic approaches,21 we evaluated potential regulatory elements associated with the uc.112 genomic position. In the UCSC Genome Browser, it is possible to access data of genome sequences related to a specific transcription factor binding by combining chromatin immunoprecipitation assays with DNA sequencing (CHIP-seq). These data are public, and the UCSC contained information about 161 factors in 91 different cell types from ENCODE.
In this analysis, the uc.112 region was found to be bound with the transcription factors (TFs) NFIC, ATF2, MAZ, SP1, TBL1XR1, BCLAF1, PAX5, POU2F2, IRF4, RUNX3, EBF1, BATF and BCLA11 and these TFs were found to be bound at the uc.112 genome position only in the GM12878 cell line (Fig. 3). The GM12878 is a B-lymphoblastoid cell line established by Epstein-Barr Virus transformation of peripheral blood mononuclear cells. The factor SPI1 was also found in the GM12878 and K562 cells, isolated from chronic myelogenous leukemia.
 Chromosome localization. (B) Transcription factor immunoprecipitated according to ENCODE data (C) Conservation information. Data available accessing the position chr3:18169564-18169909, GRCh37/hg19 Assembly and visualized with zoom out of 3 times.")
UCSC Genome Browser histogram view for uc.112 region. (A) Chromosome localization. (B) Transcription factor immunoprecipitated according to ENCODE data (C) Conservation information. Data available accessing the position chr3:18169564-18169909, GRCh37/hg19 Assembly and visualized with zoom out of 3 times.
Since the initial evidence of the T-UCR association with cancer,6 many investigators have emphasized the T-UCR deregulation in several tumor types. For example, Scaruffi et al. showed that T-UCR expression is associated with the outcome in high-risk neuroblastoma (NB).9 Likewise, uc.347, uc.350, uc.279, uc.379, uc.460, uc.446 and uc.364 were found to be upregulated in the NB by myelocytomatosis viral homologue (MYCN) amplification.22 In addition, after retinoic acid treatment the levels of the uc.300a expression were linked to viability, invasion and the inhibition of differentiation of the NB cell lines.23
In colorectal cancer, uc.73 and uc.388 were decreased, whereas uc.73 showed a positive correlation with overall survival.24 On the other hand, in human hepatocellular carcinoma, uc.338 is upregulated in comparison to adjacent noncancerous tissues.25 Furthermore, low expression of uc.306 was associated with shorter overall survival in hepatitis B (HBV)-related hepatocarcinoma.26
Upregulation of uc.58, uc.202, uc.207, and uc.223 and downregulation of uc.214 were also detected in Barrett-related adenocarcinoma27 and high levels of uc.190, uc.233 and uc.270 were identified in pancreatic adenocarcinoma.28 Overexpression of the uc.8 results in increased expression of the metalloprotease 9, increasing the invasive potential of bladder cancer cells.8
In prostate cancer, using a custom microarray with 962 probe sets, Hudson et al. observed the uc.106, uc.477, uc.363, and uc.454 expression levels significantly deregulated.29 Moreover, uc.63 promotes resistance to docetaxel through the regulation of androgen receptor signaling by interacting with miR-130b.30 The uc.63 expression is also associated with worse outcomes in patients with the luminal A subtype of breast cancer.31 Expression of uc.38 also is downregulated in breast cancer cells, inducing apoptosis and features associated with the progression of this tumor.32
Among hematological diseases, T-UCRs were evaluated only in chronic lymphocytic leukemia (CLL).6,33,34 The first T-UCR analysis in cancer included CLL patients.6 Furthermore, there are description of DNA sequence variations of ultraconserved genes in CLL patients33 and, recently, the prognostic value of uc.70 in CLL patients was highlighted.34
The intergenic T-UCRs in ALL patients evaluated in the present study were found to be deregulated in some cancers. The uc.122, uc.160 and uc.262 were upregulated in CLL, and uc.112 was highly expressed in colorectal cancer.6 Despite the description of some pattern of T-UCR expression in tumor versus normal tissue, few descriptions have focused on differences in subtypes in a specific disease.
The uc.112 expression, found to be high in colorectal cancer, was found to be downregulated in the bladder tumor.8 Herein, high uc.112 expression was found in patients with T-ALL and patients with a hyperdiploid karyotype of more than 50 chromosomes. The ENCODE data show that all transcription factors found in the uc.112 region were detected in lymphocyte cell lines. Although these results should be viewed with caution because they were not confirmed by a second specific experiment, they may provide some clues regarding the different expression between T-ALL and B-ALL.
Differentiation of hematopoietic stem cells into B lymphocytes requires the concerted action of specific transcription factors, such as PAX5, IRF4, EBF1, RUNX1 and others, some of these binding to the uc.112 genomic region. For example, PAX5, IRF4, EBF1, and TBL1XR1 are found to be associated with the uc.112 region and they are usually found genetically altered in a large portion of patients with B-ALL.35–37 Additionally, RUNX3, a downstream effector of the NOTCH pathway and KLF4, inactivated in children with T-ALL,38 were reported to bind to uc.112 in the CHIPseq data.
The uc.122 was previously reported to be highly expressed in CLL and associated with a better outcome in neuroblastoma.9 The uc.160 was previously found to be increased in CLL6 and downregulated in gastric cancer.10 Additionally, uc.262 was found to be one of the top UCRs differentially expressed in the granulocyte lineage when differentiation in the erythrocyte, megakaryocyte, monocyte, and granulocyte lineages was evaluated.11 However, no relevance of uc.122, uc.160, and uc.262 was found in ALL.
ConclusionsIn conclusion, uc.112 was found to be highly expressed in T-ALL patients, compared to patients with B-ALL, and among B-ALL patients, uc.112 was found to be increased in patients with a hyperdiploid karyotype. To our knowledge, this is the first study to analyze the expression of some T-UCRs in ALL patients, and our results emphasize the need for further investigation of T-UCR in pediatric ALL, mainly in specific subtypes.
Conflicts of interestThe authors declare no conflicts of interest.
This collaborative study was supported by the following Public Research Agencies: Conselho Nacional de Desenvolvimento Científico e Tecnológico (CNPq), grant no. 442583/2014-1; Coordenação de Aperfeiçoamento de Pessoal de Nível Superior (CAPES), Finance Code 001; Fundação de Amparo à Pesquisa do Estado de Minas Gerais (FAPEMIG) and Fundação de Amparo à Pesquisa do Estado de São Paulo (FAPESP).
The authors thank Mrs. Elettra Greene for revising the English text, and Leilane Sales de Oliveira and Rafael Fernandes Martins for technical assistance.
The following are Supplementary data to this article:


