
In order to standardize a thrombin generation() protocol, we analyzed the analytical variables and sensitivity of this test to hypo/hypercoagulability states.
MethodsThe effect of the tissue factor concentration and the intra- and interassay precision were analyzed. To evaluate the hypercoagulability status, the plasma of women under an oral contraceptive was tested, while plasma from hemophilia A patients at 1, 3 and 7 days after recombinant FVIII infusion, and lyophilized plasma deficient in FVII or FVIII were used for the evaluation of hypocoagulability.
ResultsThe intra-assay coefficient of variation was <10% with 1 and 5pM of low and high TF. The oral contraceptive users showed increased thrombin generation in comparison to non-users, which was more pronounced with low TF (endogenous thrombin potential ETP) p=0.0009; peak p=0.0009; lagtime p=0.0008). In relation to the FVIII-deficient plasma, a higher TG was observed as FVIII levels were increased and a better discrimination was obtained for different concentrations of FVIII with low TF (ETP p<0.0001; peak p<0.0001; lagtime p=0.0004). Using low TF, plasma from hemophilia A patients showed higher TG values after 1 day of recombinant FVIII infusion vs after 3 days (ETP p<0.0001; peak p<0.0001; lagtime p=0.0407), while the lowest values were observed after 7 days. With FVII-deficient plasma, thrombin generation was lower than normal plasma and a more pronounced difference was observed with high TF compared to low TF (ETP p<0.0001; peak p<0.0001; lagtime p<0.0001).
ConclusionUnder our conditions the thrombin generation test seems to be sensitive to evaluation of hyper/hypocoagulability states. Standardization of the thrombin generation test may have an application in the evaluation of bleeding and thrombotic disorders.
Thrombin is a key protein for the regulation of the hemostatic process, since it has procoagulant, anticoagulant, fibrinolytic and antifibrinolitic properties.1 Thrombin formation can be assessed by clot-based assays, prothrombin time and activated partial thromboplastin time, which are limited by an endpoint that occurs when only 5% of thrombin is produced. The thrombin generation test (TGT) was introduced by Macfarlane & Biggs in 1953 and the development of a commercial semi-automated Calibrated Automated Thrombogram (CAT) method (Thrombinoscope BV®, Maastricht, Netherlands), allowed for the measurement of thrombin generation (TG) potential in the plasma, over 60min, after addition of the tissue factor (TF), phospholipids and a fluorescent substrate containing calcium with consequent activation of coagulation.2–7 Using Thrombinoscope® software it is possible to obtain the TG curve (time versus thrombin concentration) and calculate TG parameters, such as the endogenous thrombin potential (ETP), peak, and lag time.
The TG curve is characterized by a lag time phase, followed by the formation of a large amount of thrombin (propagation), which culminates in a peak of thrombin concentration and finally, in the inhibition of thrombin by natural anticoagulants.8 The area under the curve, termed ETP, represents the total amount of thrombin formed over 60min.4 It is known that clot formation occurs at the end of the lag time, therefore the duration of this parameter corresponds to the coagulation time.9 From the analysis of these parameters in a TG curve, it can be suggested that a prolonged lag time and decrease of both the ETP and peak indicate a state of hypocoagulability, characterized by a lower thrombin formation. On the other hand, the increase in TG is characterized by a decrease in the lag time and an increase in ETP and peak values.10 Therefore, this method is sensitive to hypo- and hypercoagulability states and has numerous research and potential clinical applications, such as screening for genetic or acquired thrombotic disorders or estimation of bleeding risk for hemophiliac patients.10 Using platelet-poor plasma (PPP), the CAT method is sensitive to detect all coagulation factor deficiencies (except FXIII) and the effect of vitamin K antagonists, heparinoids, and direct oral anticoagulants. In platelet-rich plasma, the method is sensitive to the von Willebrand disease and can detect the effect of platelet inhibitors. In addition, in the presence of activated protein C or thrombomodulin, it is possible to study congenital or acquired disorders of the anticoagulant system.7,11,12
However, substantial differences in pre-analytical and analytical variables for the TG technique among laboratories currently still exist, which make the comparison of results from different studies difficult.1,13,14 Therefore, standardized pre-analytical conditions and a validated method are still needed to introduce this test in clinical practice. Since studies on the TGT standardization are still scarce, this study proposed to analyze some important analytical variables, as well as the sensitivity of this method in hypo- and hypercoagulability states in order to contribute to the standardization of the TGT by the CAT method.
Material and methodsPlasma pool preparationA blood sample was collected from 21 normal controls, who are students at the Federal University of Minas Gerais, with an age range of 19–40 years, mostly women. Blood samples were collected using Vacutainer® (Becton-Dickinson) tubes containing 3.2% buffered sodium citrate and separated by double centrifugation at room temperature within 3h of blood collection. Firstly, tubes containing blood samples were centrifuged at 1100×g for 15min and the supernatant (plasma) was aspirated carefully with a pipette, thereby staying 1cm away from the buffy coat. Then plasma samples were centrifuged again, in plastic tubes, at 1100×g for 15min to obtain PPP with a platelet count less than 10,000/mm3.
In order to standardize the optimum conditions to perform the TGT by the CAT method, the impact of different variables on TGT results was evaluated, including the following determinations: (1) titration of PPP-Reagent Low and PPP-Reagent High (Diagnostica Stago®, Asnières, France); (2) determination of intra- and interassay coefficients of variation (CVs); (3) effect of freezing and thawing plasma in TGT; (4) assessment of the method performance under conditions of hypo- and hypercoagulability.
In order to investigate the ability of this technique to detect a hypocoagulability state, lyophilized plasma samples of FVII (Sigma Aldrich Brasil Ltda®) and FVIII (Sigma Aldrich Brasil Ltda®) deficient plasmas were used. These were resuspended in 1mL distilled water and then immediately used in the TGT.
In the experiment using FVIII-deficient lyophilized plasma, the TGT was performed in 3 different concentrations of FVIII: (1) undiluted FVIII-deficient plasma (<1% FVIII activity [FVIII:C]); (2) FVIII-deficient plasma diluted ½ with normal pool plasma (50% FVIII:C) and (3) undiluted normal pool plasma (100% FVIII:C).
In addition, blood samples from 10 patients with hemophilia A were collected at a blood transfusion center (Fundação Hemominas, Brazil) at 1, 3 and 7 days after infusion of recombinant FVIII. The TGT was performed on PPP samples from these patients and the test was also performed in parallel on plasma samples from 12 healthy blood donors (control group). Before infusion of recombinant FVIII, all patients had FVIII:C levels below 2%. The dose of recombinant FVIII was adjusted according to the weight of each patient and the mean dose infused in prophylaxis treatment was 38.4IU/kg (±13.35).
To investigate the ability of this technique to detect a hypercoagulability state, two different PPP pools were used: (1) pool of four plasma samples from women not using an oral contraceptive (OC), with a mean age of 21 years; (2) pool of three plasma samples from women using an OC with a mean age of 21 years.
Thrombin generation testThe TGT was performed in a pooled plasma by the CAT method (Thrombinoscope BV®, Maastricht, Netherlands), using a 96-well plate. All TGT reagents were purchased from Stago®, France. This method monitors the cleavage of a low-affinity fluorogenic substrate and compares it to a known thrombin activity measured in parallel in a non-clotting sample. Briefly, the activity of the pooled sample was probed in 80μL of PPP and 5μL of the hepes+NaCl+albumin (HNBSA) buffer which were added into a well. All frozen PPP samples were thawed at 37 degrees for 10min immediately before being used in the test. For each different sample, a well was added to the calibrator, consisting of pooled plasma, HNBSA and 20μL of α2 M-Thrombin Calibrator reagent. Once the plate was filled with the pooled plasma samples to be tested and their respective calibrators, the plate was placed in the fluorimeter (Fluoroskan Ascent, Thermo Laboratories®) for incubation at 37°C for 10min. After incubation, 20μL of TF at high or low concentrations (PPP-Reagent High® or PPP Reagent Low®, respectively), were added only in wells with the pooled samples to be tested. Following this, 20μL of fluorescent substrate-CaCl2 (Fluca-Kit) were dispensed into all wells and the plate was read for 60min. The substrate is cleaved by the thrombin formed and liberates a fluorophore, which is converted to thrombin-equivalent concentrations (nM) using a reference curve determined by measuring the rate of conversion by a thrombin calibrator. The thrombinoscope® software was used to construct the curve of time (min) versus thrombin concentration (nM) and to calculate the TG parameters. The formation of this curve could be observed kinetically on the computer screen. The following TG parameters were measured and analyzed: (A) lag time (min), which is the time between addition of the trigger and the initiation of the TG; (B) peak (nM) refers to the maximum of thrombin concentration generated; (C) the endogenous thrombin potential (ETP) (nMmin) represents the amount of thrombin formed over 60min. The total amount of free thrombin produced is referred to as the area under the curve (AUC) or ETP, as described by Wolberg and Campbell.15
The TG tests were performed without the addition of corn trypsin inhibitor (CTI), an intrinsic pathway activation inhibitor, since it is not necessary to add CTI in blood collection tubes or after plasma separation for reactions performed with concentrations equal to or greater than 1.0pM of the TF.1,16,17
Statistical analysisAll data were analyzed for normal distribution by the Shapiro Wilks test. The results were presented as mean and standard deviation (SD) when they presented normal distribution, and as median and interquartile range (IQR), when their distribution was not normal. The Student t and Mann–Whitney tests were used for comparison of the two groups, when the data were normal or non-normal, respectively. The Kruskal–Wallis test (non-normal data) was used to compare three or more groups. The PRISMA 6.0 software was used to make these analyses. A p value less than 0.05 was considered statistically significant.
ResultsEffect of different concentrations of TF on thrombin generationDifferent concentrations of low and high TF corresponding to 0.25; 0.5; 0.75 and 1.0pM and 1.25; 2.5; 3.75 and 5.0pM, respectively, were obtained by pipetting a volume of 5, 10, 15 and 20μL of low and high TF reagents and completed to a total of 20μL with the HNBSA buffer, as recommended by the manufacturer (Stago®). Different concentrations of low and high TF reagents were tested in duplicate.
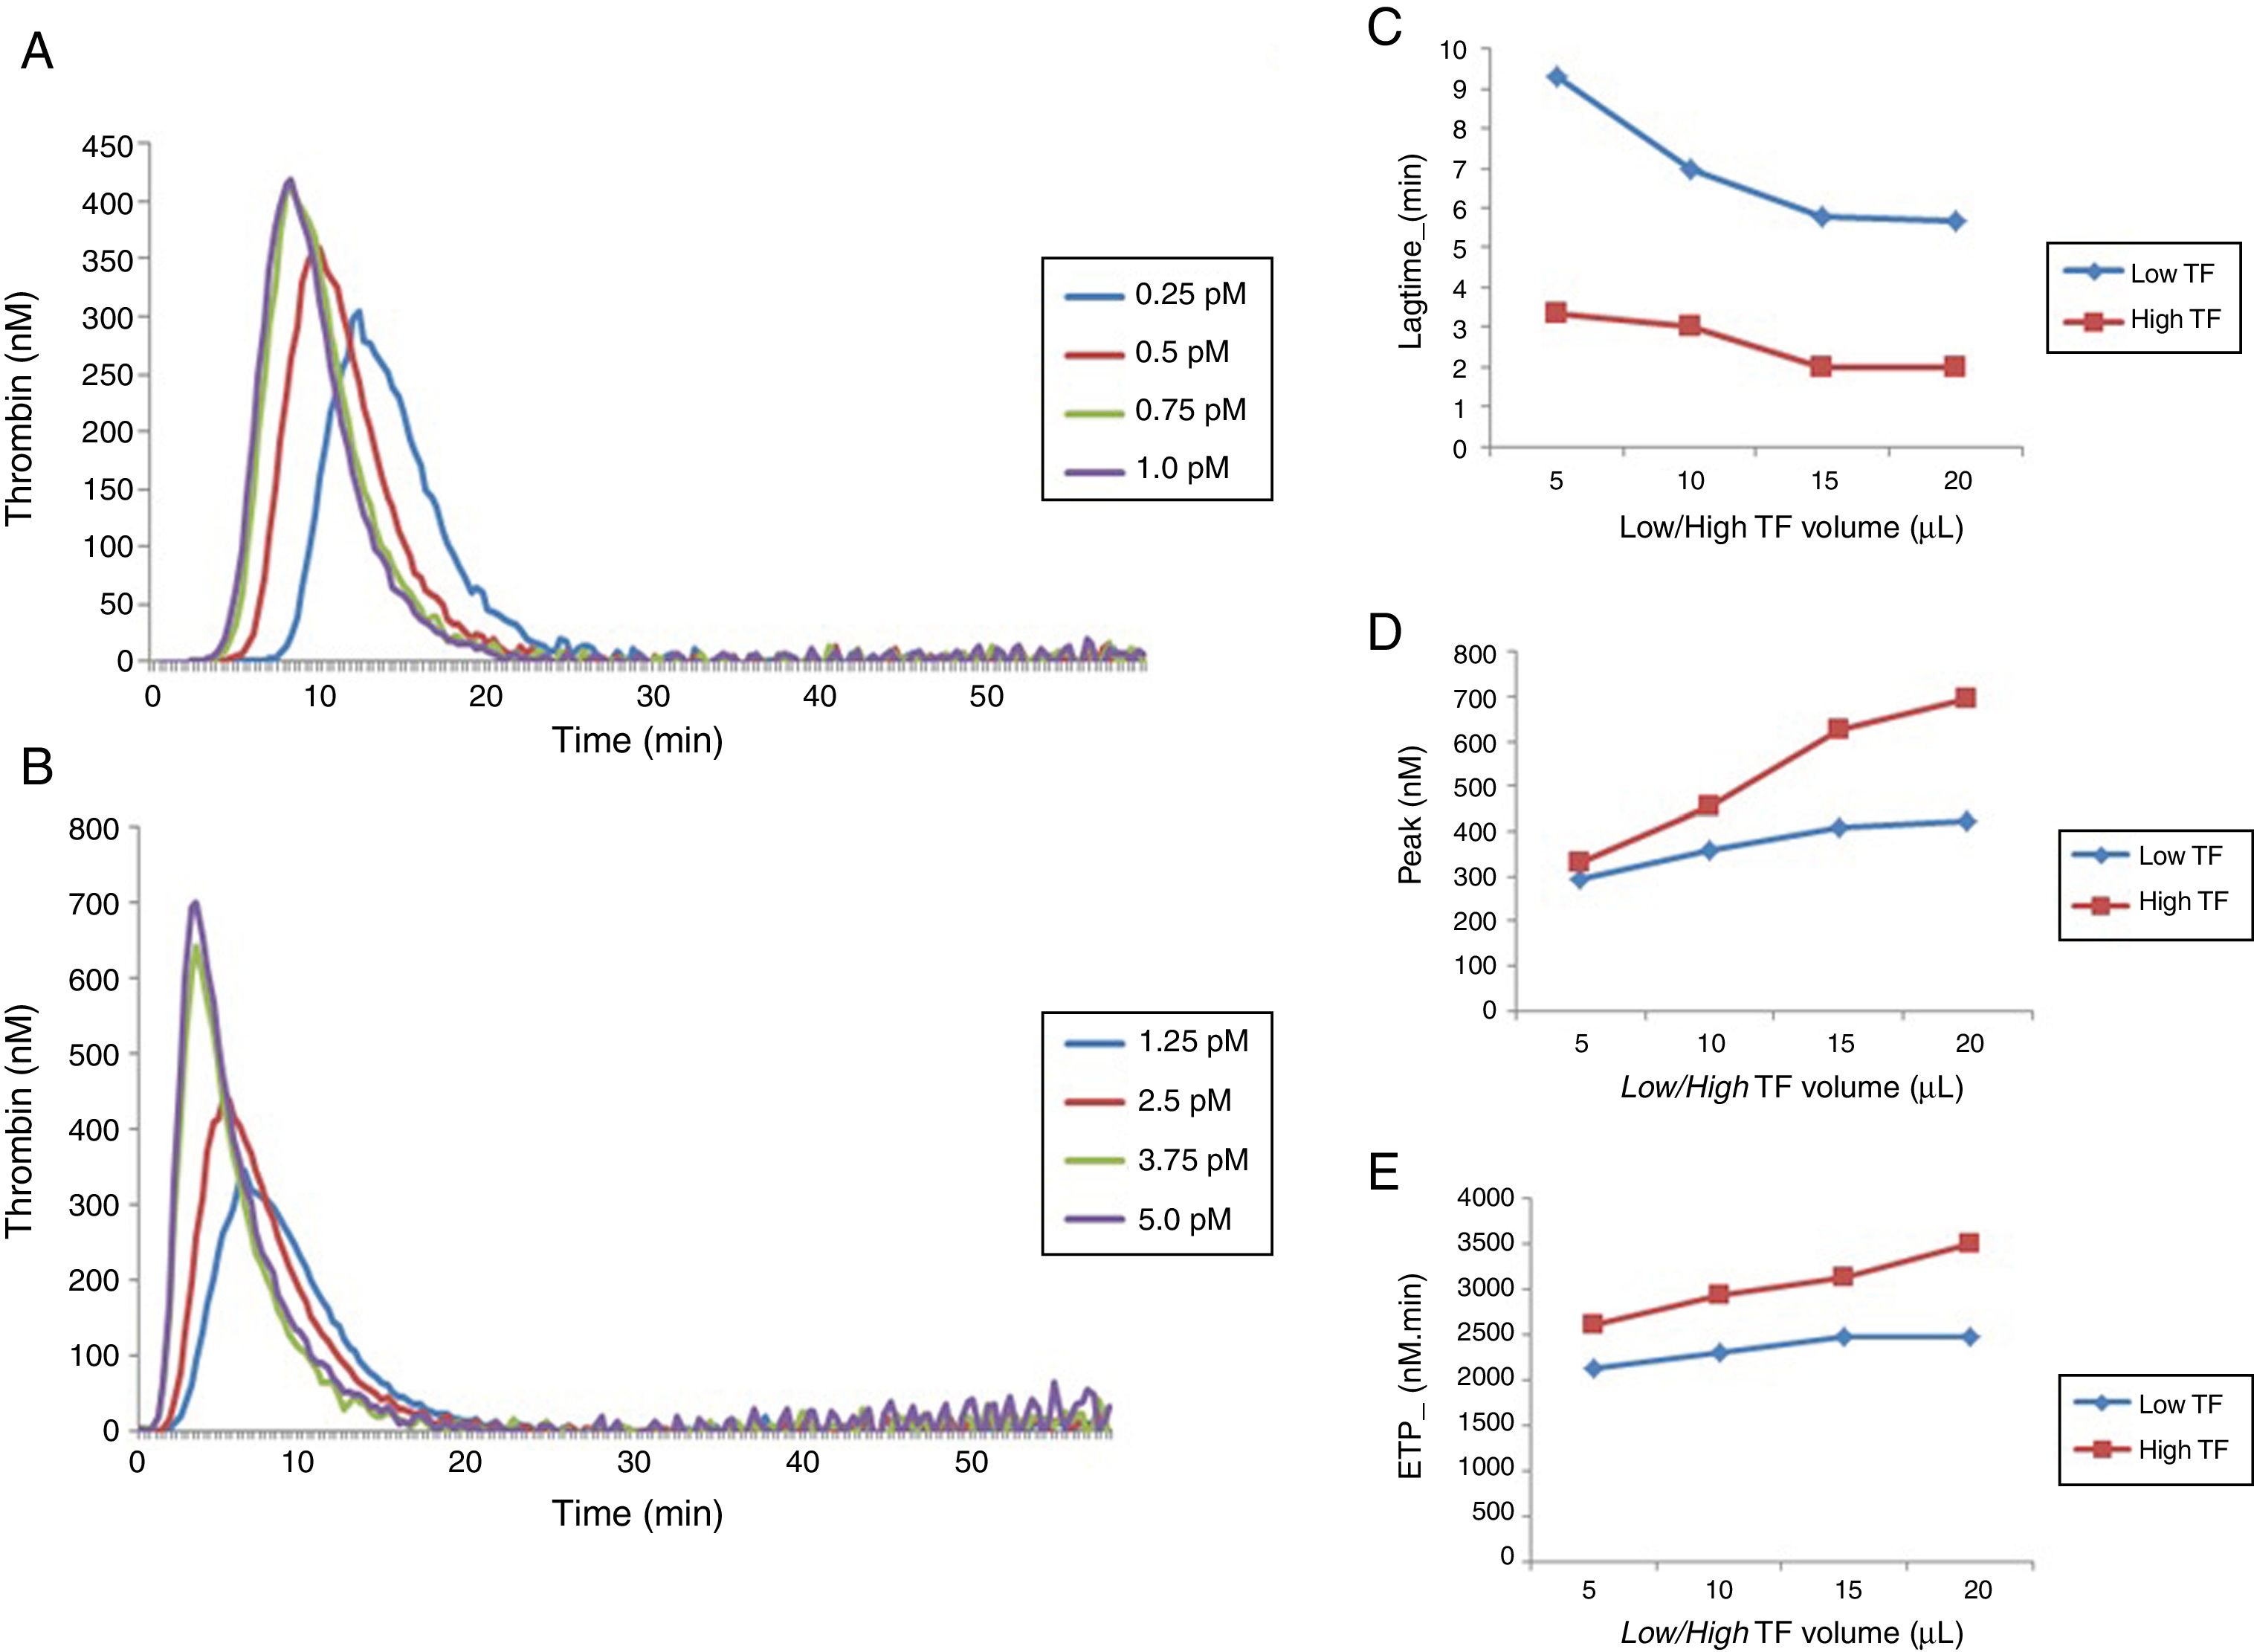
The results obtained for low and high TF titration (Figure 1) show that the volume of 20μL recommended by the manufacturer for both concentrations is ideal. From this experiment, 20μL with the final concentrations of 1pM of low TF (PPP Reagent Low®), and 5pM of high TF (PPP-Reagent High®) were used for all subsequent reactions.
. (A) TG curve with low TF. (B) TG curve with high TF. Comparison between lag time (C), peak (D) and ETP (E) values obtained with low and high TF titration. Each experiment was performed in duplicate for each dilution.")
Comparison of thrombin generation test parameters with low and high TF using normal poor platelet plasma (PPP). (A) TG curve with low TF. (B) TG curve with high TF. Comparison between lag time (C), peak (D) and ETP (E) values obtained with low and high TF titration. Each experiment was performed in duplicate for each dilution.
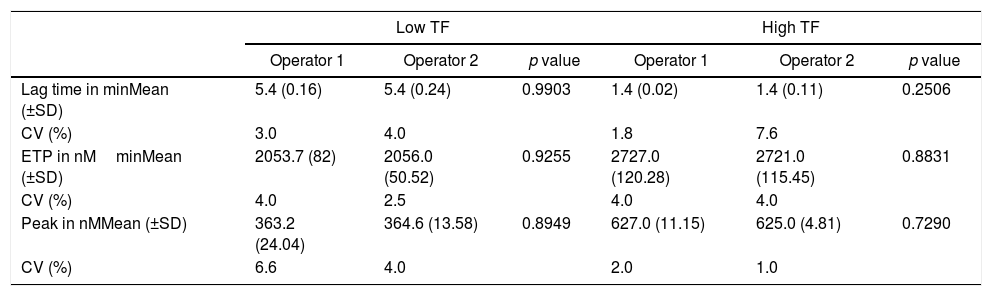
Repeatability was obtained by two different operators, through eight replicates, using low and high TF. The intra-assay coefficients of variation (CV) for each operator and the comparison between values for the lag time, ETP and peak parameters are shown in Table 1.
Comparison of thrombin generation test parameters for high and low tissue factor found by different operators.
| Low TF | High TF | |||||
|---|---|---|---|---|---|---|
| Operator 1 | Operator 2 | p value | Operator 1 | Operator 2 | p value | |
| Lag time in minMean (±SD) | 5.4 (0.16) | 5.4 (0.24) | 0.9903 | 1.4 (0.02) | 1.4 (0.11) | 0.2506 |
| CV (%) | 3.0 | 4.0 | 1.8 | 7.6 | ||
| ETP in nMminMean (±SD) | 2053.7 (82) | 2056.0 (50.52) | 0.9255 | 2727.0 (120.28) | 2721.0 (115.45) | 0.8831 |
| CV (%) | 4.0 | 2.5 | 4.0 | 4.0 | ||
| Peak in nMMean (±SD) | 363.2 (24.04) | 364.6 (13.58) | 0.8949 | 627.0 (11.15) | 625.0 (4.81) | 0.7290 |
| CV (%) | 6.6 | 4.0 | 2.0 | 1.0 | ||
t test values expressed as mean and standard deviation (SD). Results correspond to the mean of 8 replicates. CV: coefficient of variation.
The intra-assay CV for all the parameters was below 10%. In addition, no significant difference was observed in the TGT results between the two operators.
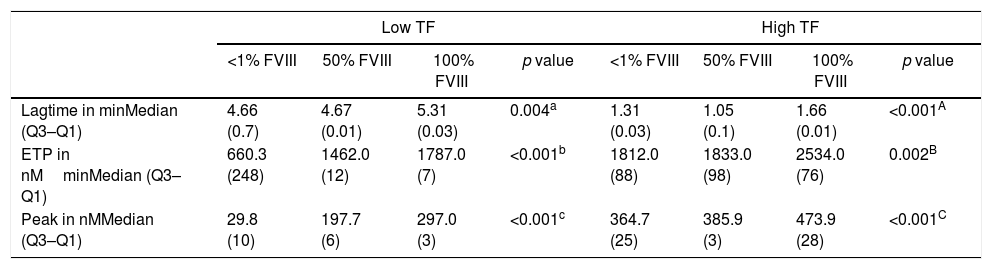
Thrombin generation test under conditions of hypocoagulability: FVIII and FVII deficienciesA comparison of the results of the lag time, ETP and peak for different concentrations of FVIII deficient lyophilized plasma using low and high TF can be seen in Table 2 while the TG profiles can be seen in Figure 2.
Thrombin generation parameters with varying concentrations of factor VIII.
| Low TF | High TF | |||||||
|---|---|---|---|---|---|---|---|---|
| <1% FVIII | 50% FVIII | 100% FVIII | p value | <1% FVIII | 50% FVIII | 100% FVIII | p value | |
| Lagtime in minMedian (Q3–Q1) | 4.66 (0.7) | 4.67 (0.01) | 5.31 (0.03) | 0.004a | 1.31 (0.03) | 1.05 (0.1) | 1.66 (0.01) | <0.001A |
| ETP in nMminMedian (Q3–Q1) | 660.3 (248) | 1462.0 (12) | 1787.0 (7) | <0.001b | 1812.0 (88) | 1833.0 (98) | 2534.0 (76) | 0.002B |
| Peak in nMMedian (Q3–Q1) | 29.8 (10) | 197.7 (6) | 297.0 (3) | <0.001c | 364.7 (25) | 385.9 (3) | 473.9 (28) | <0.001C |
Kruskal–Wallis and Mann–Whitney tests (values expressed as median and interquartile range: Q3–Q1). Results correspond to the mean of 8 replicates.
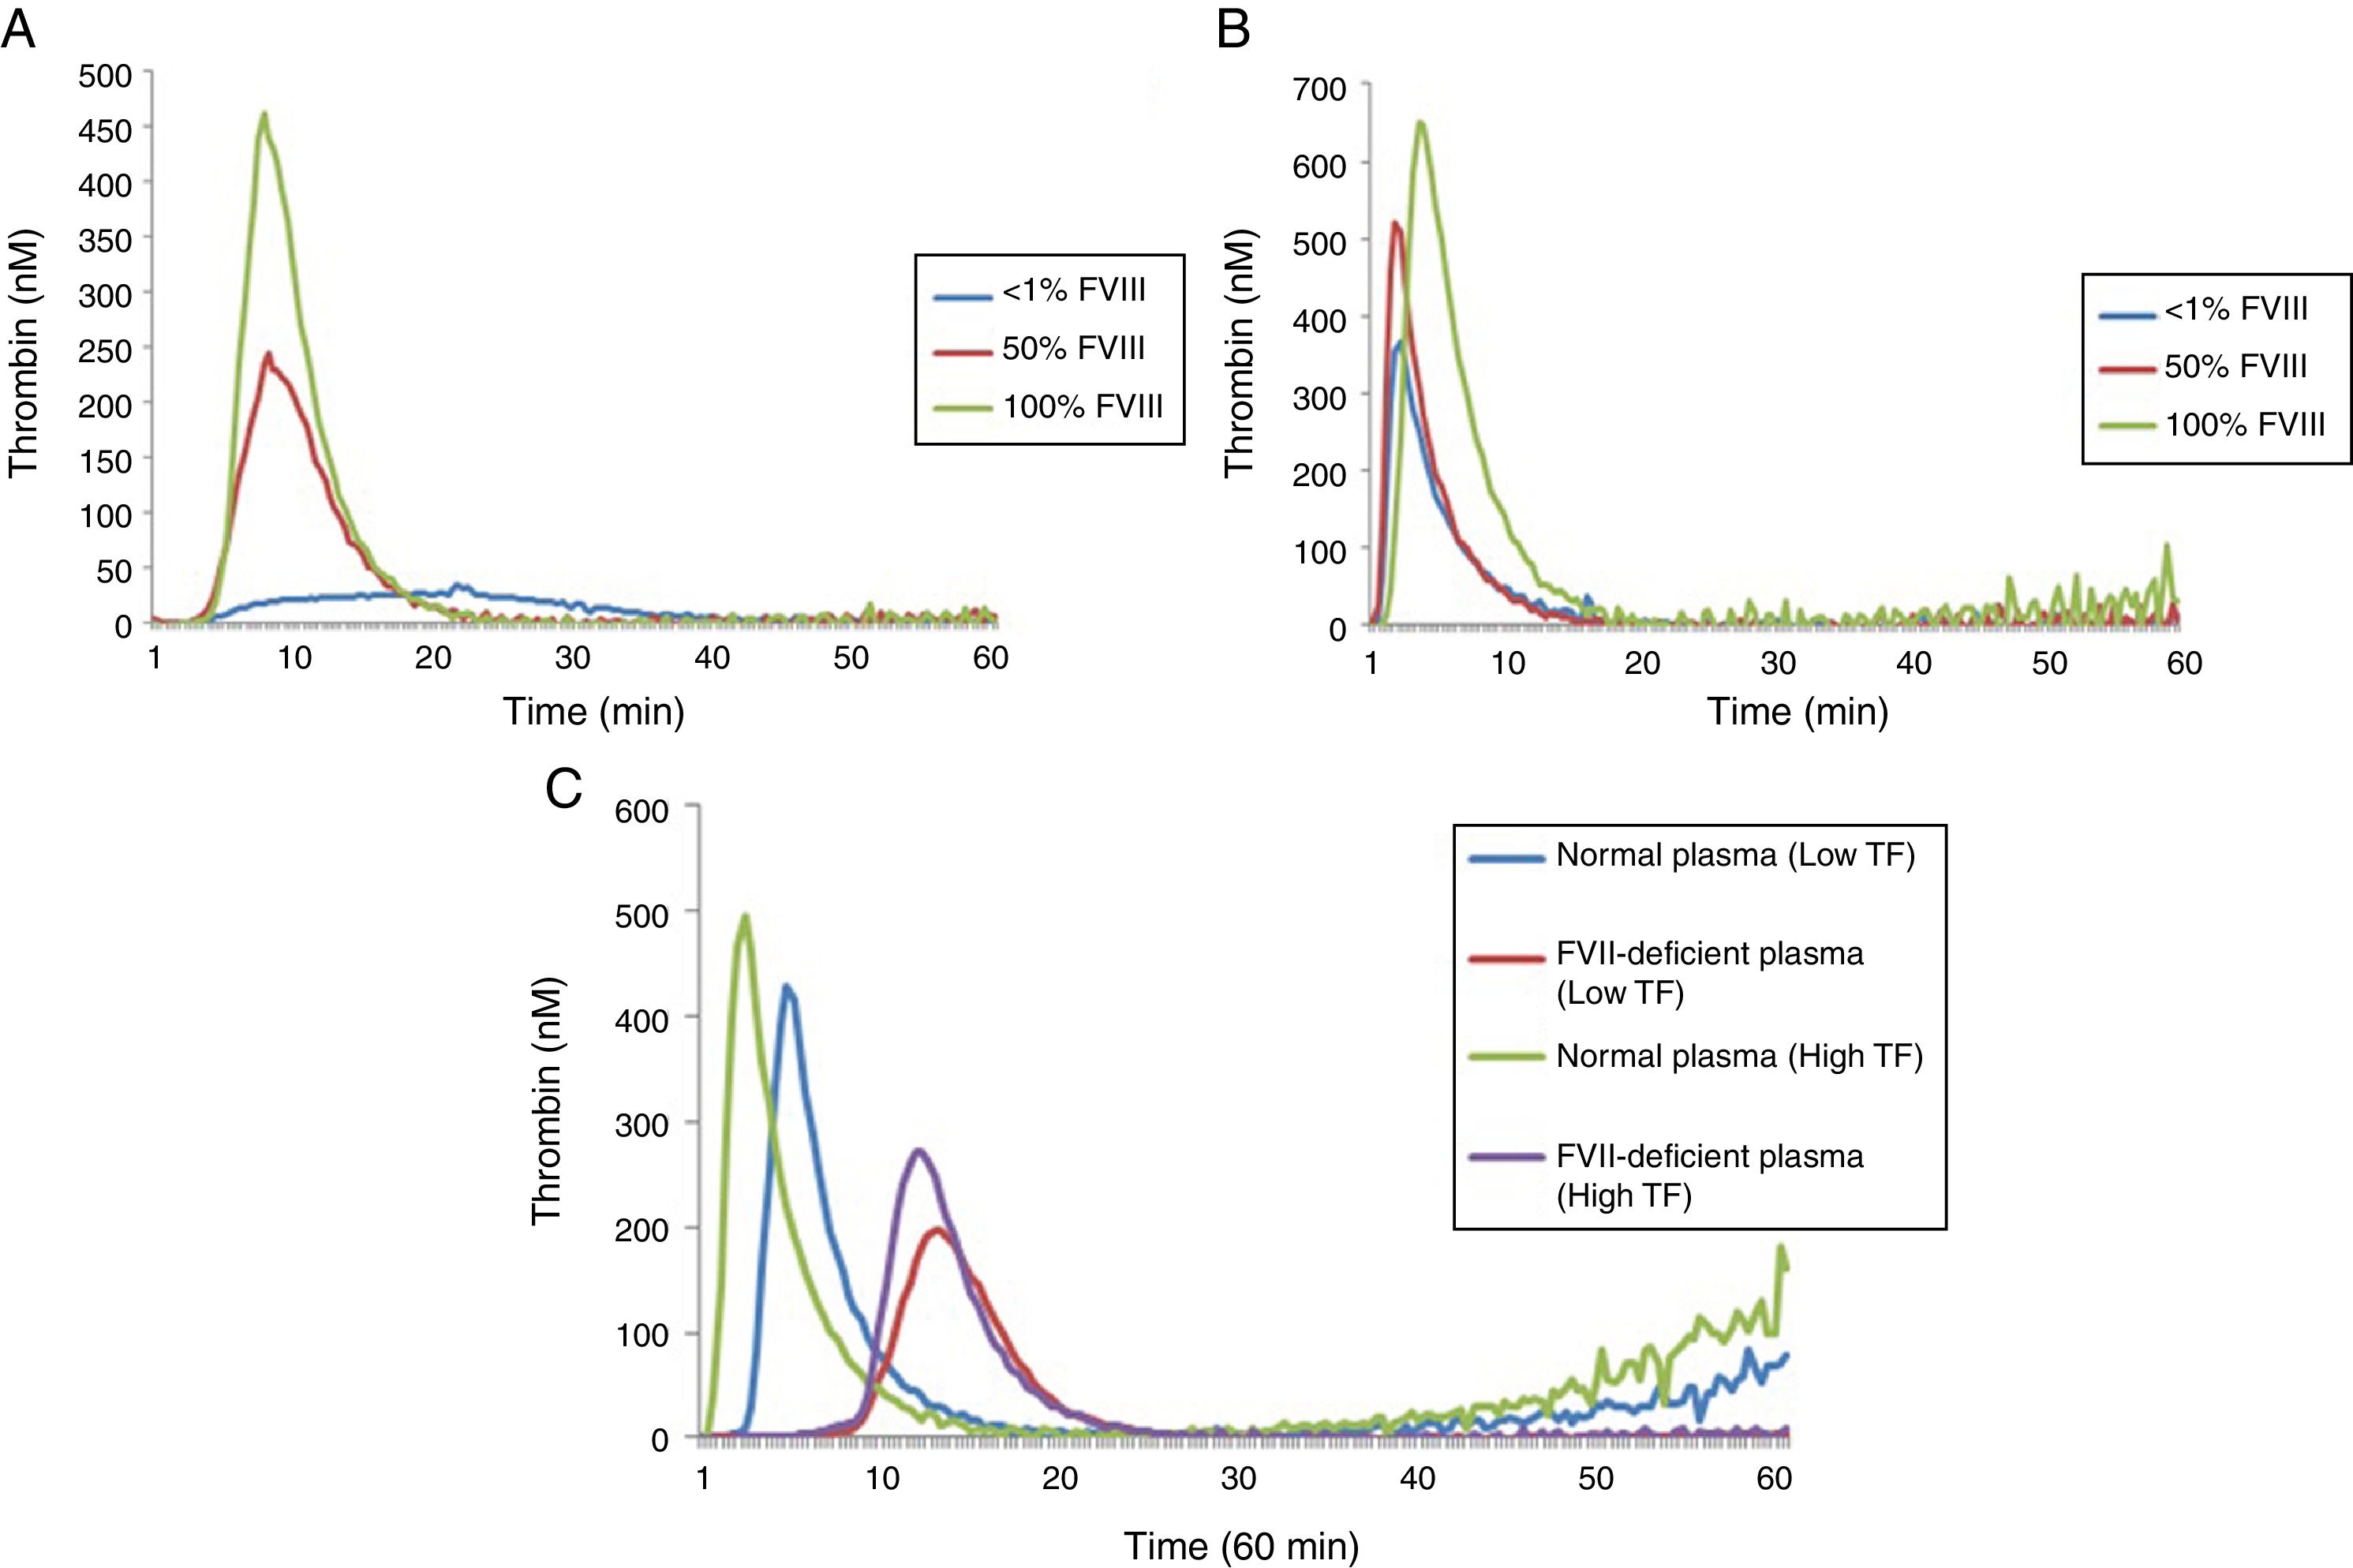
 low TF and (B) high TF; (C) TG profiles of FVII deficient plasma using low and high TF.")
In reactions performed with low and high TF, a significant increase in ETP and peak values was observed with the increase of FVIII concentrations (Table 2). However, in reactions performed with high TF (Figure 2B), the discrimination among the different concentrations of FVIII was not as evident when compared to the results of the reaction using low TF (Figure 2A). There was no difference in the ETP with FVIII<1% versus 50% (p=0.1031) in the reactions with high TF (Table 2). In addition, it can be observed that ETP and peak parameters were better to discriminate the different FVIII concentrations compared with lag time (Figure 2).
A second experiment was performed to compare the TGT results using lyophilized plasma deficient in FVII and the normal pool (Figure 2C). In reactions with low TF, the ETP was higher in the normal pool plasma, when compared to FVII-deficient plasma (1809.0±31.00 versus 1299.0±36.22nMmin; p<0.0001), respectively. The peak was also higher in the normal pool plasma when compared to FVII-deficient plasma (420.8±2.86 versus 268.3±9.13nM; p<0.0001), respectively.
Similarly, in reactions with high TF, the ETP was higher in the normal pool plasma when compared with FVII-deficient plasma (2013.0±77.54 versus 1550.0±11.86nMmin; p<0.0001), respectively. The peak was also higher in the normal pool plasma, when compared with FVII-deficient plasma (479.3±8.26 versus 277.0±7.76nM; p<0.0001), respectively.
A prolongation of lag time in low TF reactions was also observed when normal plasma was compared with FVII-deficient plasma (3.87±0.17 versus 11.25±1.611min; p<0.0001) and with high TF (1.68±0.015 versus 10.0±0.36min, p<0.0001).
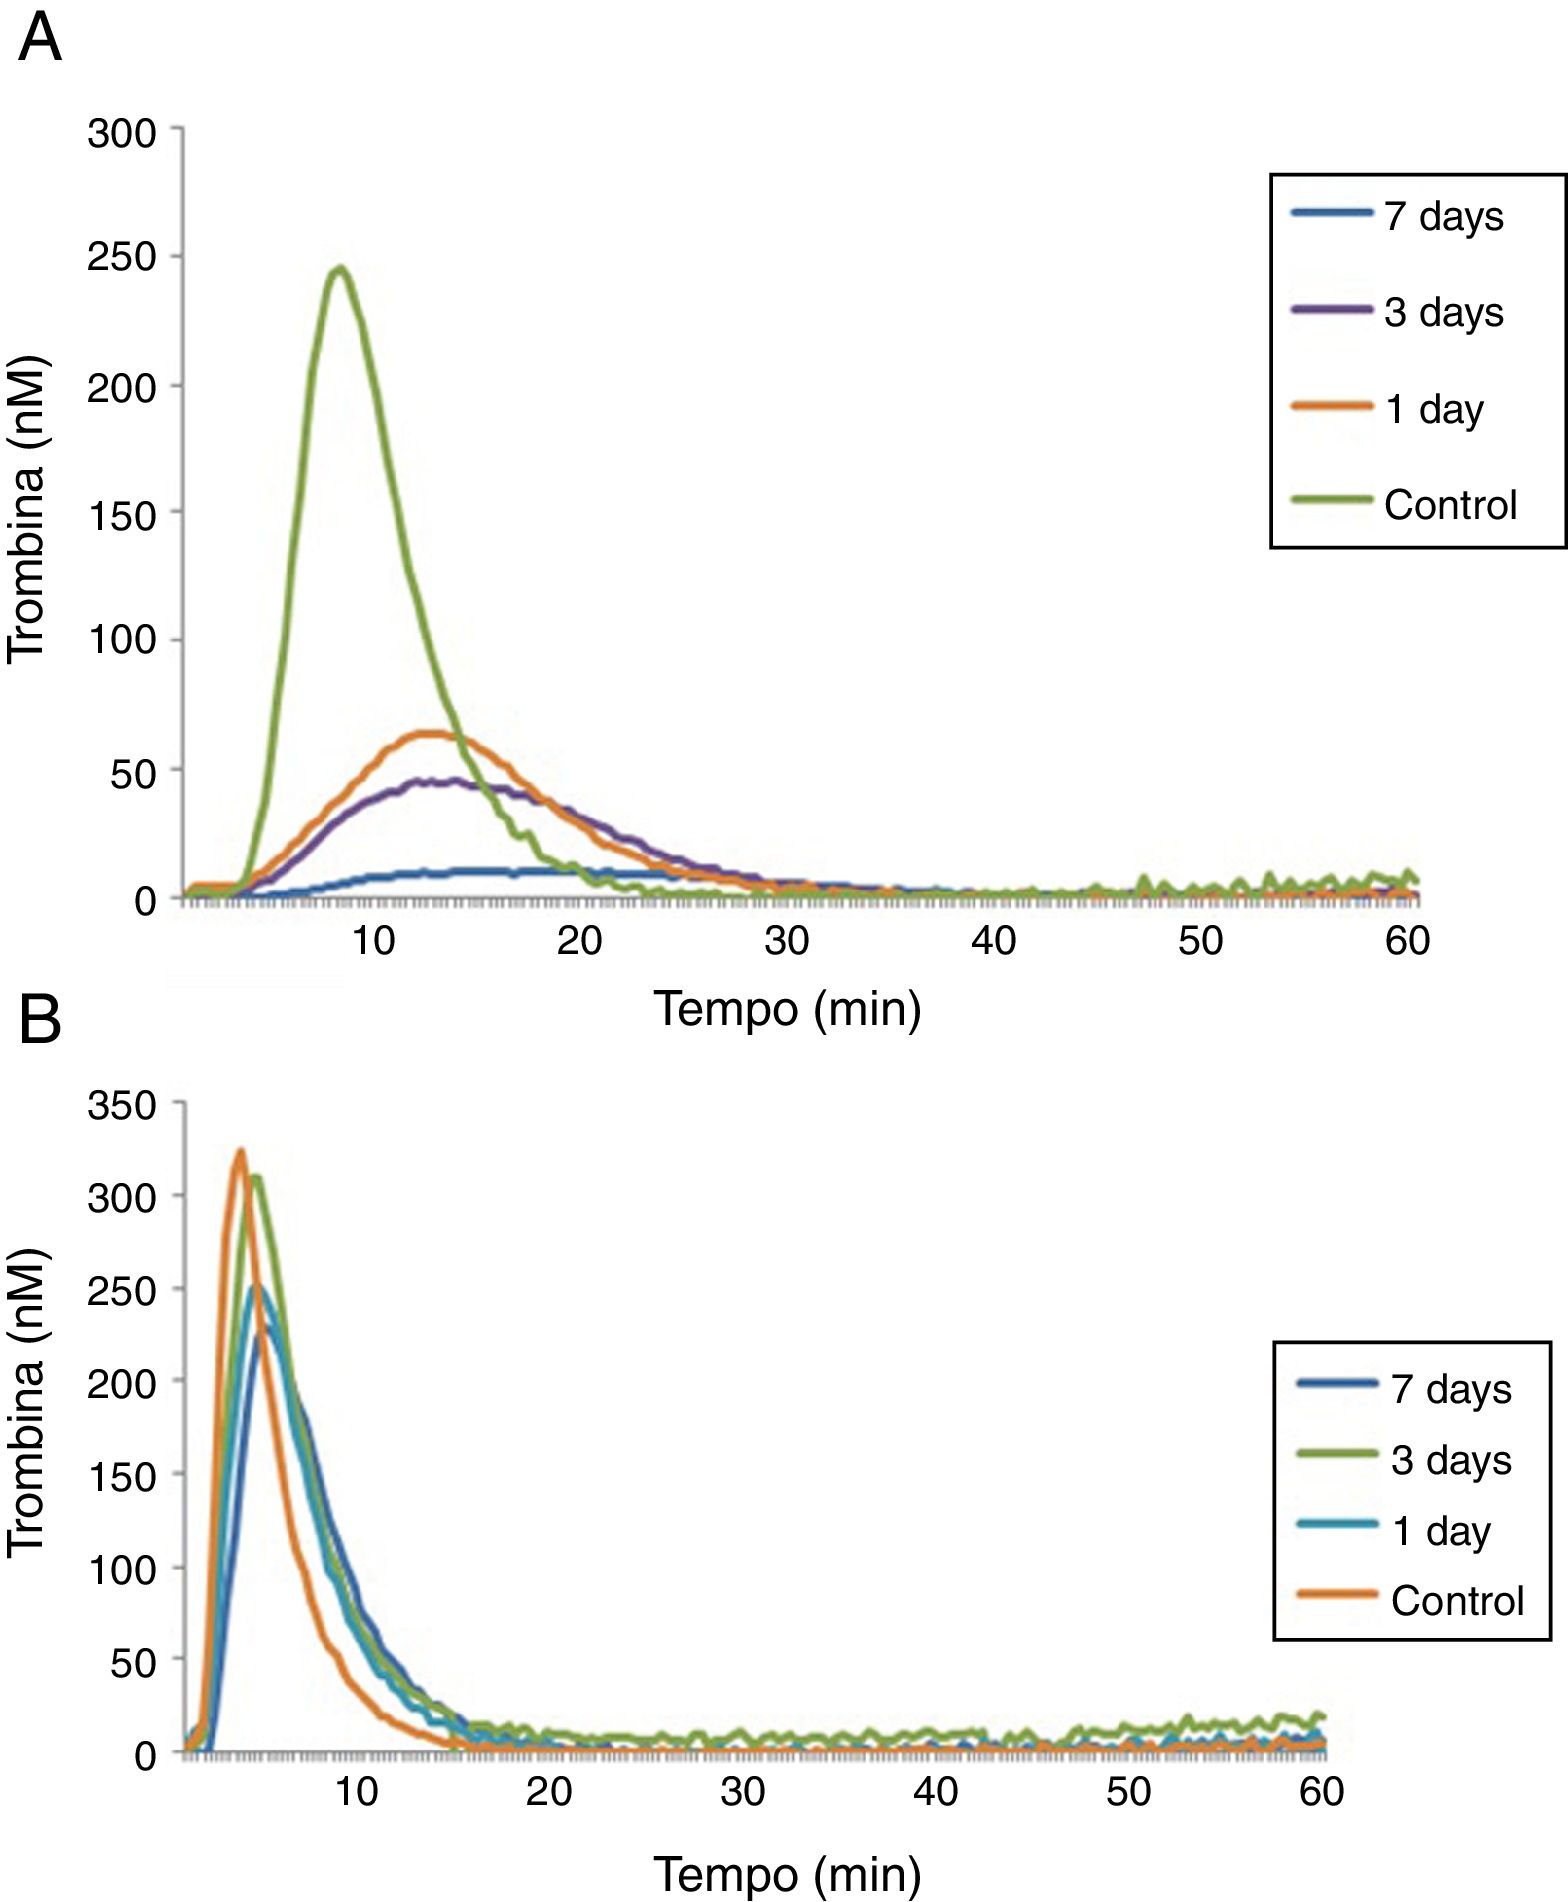
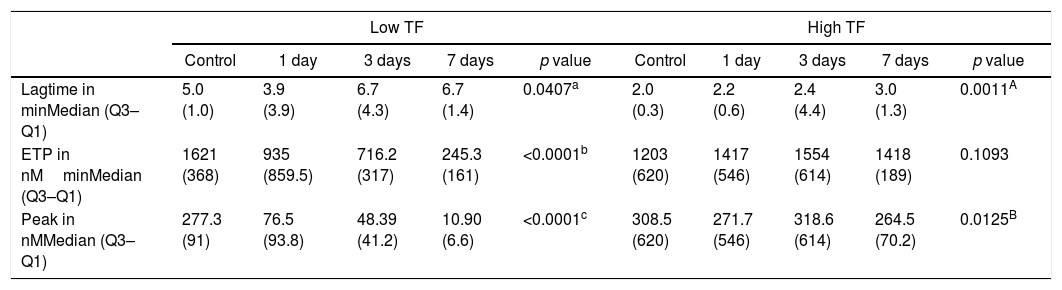
A last experiment was performed using plasma from patients with hemophilia A at 1, 3 and 7 days after the FVIII infusion and a control group (Table 3). After 1 day of recombinant FVIII infusion, a higher TG was observed than after 3 days, while the lowest TG values were observed after 7 days of FVIII infusion. As expected, in reactions performed with low a TF a better discrimination was observed between TG results on the different days of the FVIII infusion, compared to reactions with high TF (Figure 3).
Thrombin generation parameters with varying days after recombinant FVIII administration.
| Low TF | High TF | |||||||||
|---|---|---|---|---|---|---|---|---|---|---|
| Control | 1 day | 3 days | 7 days | p value | Control | 1 day | 3 days | 7 days | p value | |
| Lagtime in minMedian (Q3–Q1) | 5.0 (1.0) | 3.9 (3.9) | 6.7 (4.3) | 6.7 (1.4) | 0.0407a | 2.0 (0.3) | 2.2 (0.6) | 2.4 (4.4) | 3.0 (1.3) | 0.0011A |
| ETP in nMminMedian (Q3–Q1) | 1621 (368) | 935 (859.5) | 716.2 (317) | 245.3 (161) | <0.0001b | 1203 (620) | 1417 (546) | 1554 (614) | 1418 (189) | 0.1093 |
| Peak in nMMedian (Q3–Q1) | 277.3 (91) | 76.5 (93.8) | 48.39 (41.2) | 10.90 (6.6) | <0.0001c | 308.5 (620) | 271.7 (546) | 318.6 (614) | 264.5 (70.2) | 0.0125B |
Kruskal–Wallis and Mann–Whitney tests (values expressed as median and interquartile range: Q3–Q1). Results correspond to the mean of 8 replicates.
Control×1 day, p=0.1128; Control×3 days, p=0.0967; Control×7 days, p=0.0007; 1 day×3 day, p=0.7124; 1day×7 days, p=0.0985; 3 days×7 days, p=0.9575
Control×1 day, p=0.0002; Control×3 days, p=0.0002; Control×7 days, p=0.0002; 1 day×3 day, p=0.4295; 1day×7 days, p=0.0122; 3 days×7 days, p=0.0008.
Control×1 day, p=0.0002; Control×3 days, p=0.0002; Control×7 days, p=0.0002; 1 day×3 day, p=0.4295; 1day×7 days, p=0.0122; 3 days×7 days, p=0.0008.
 low TF and (B) high TF.")
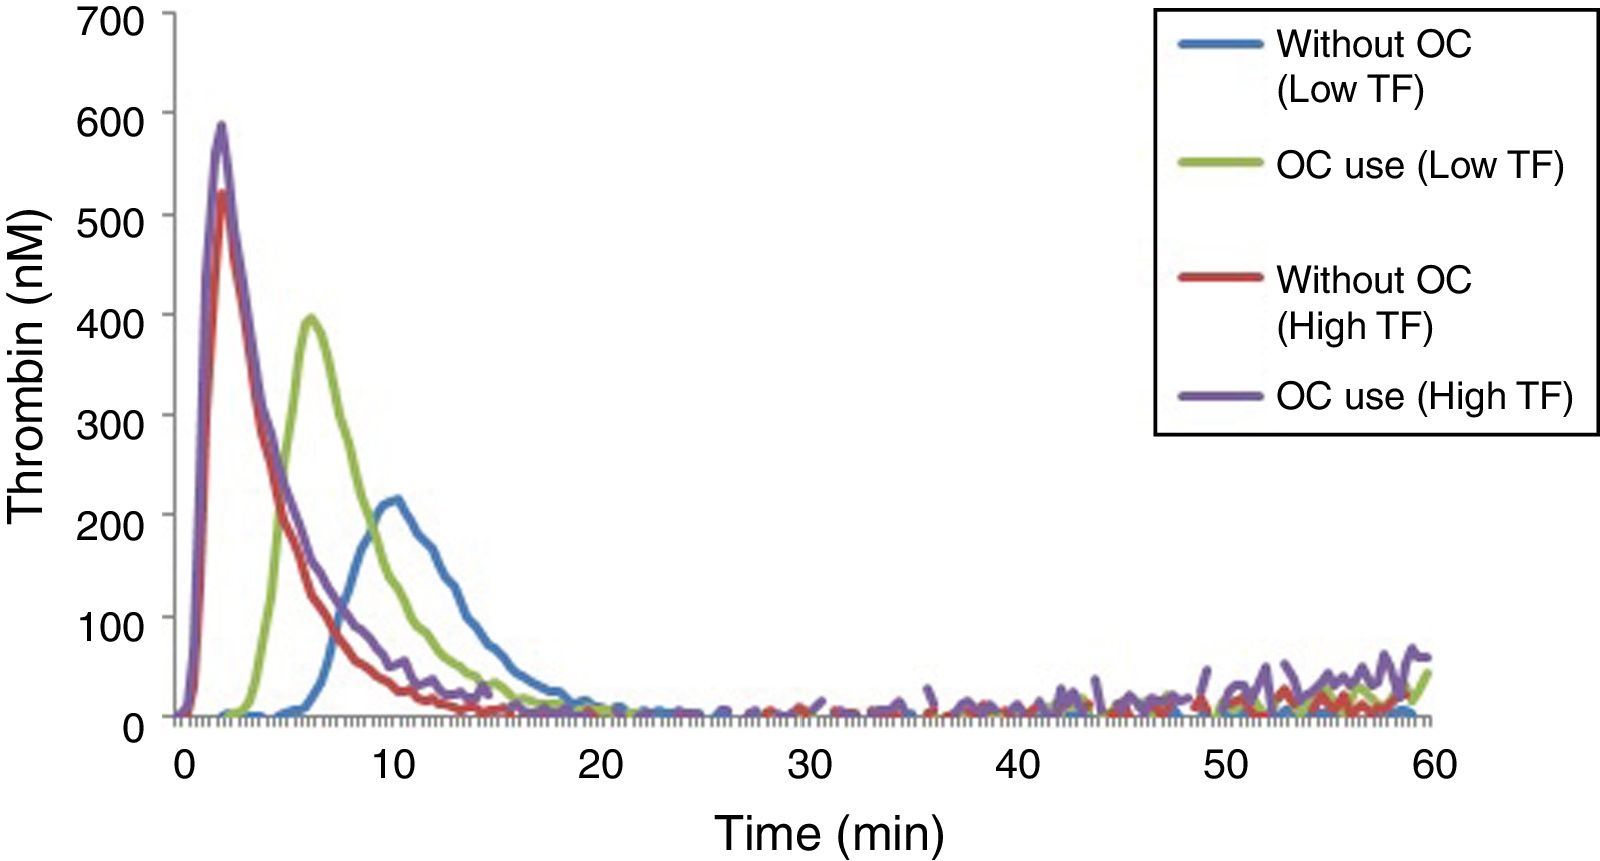
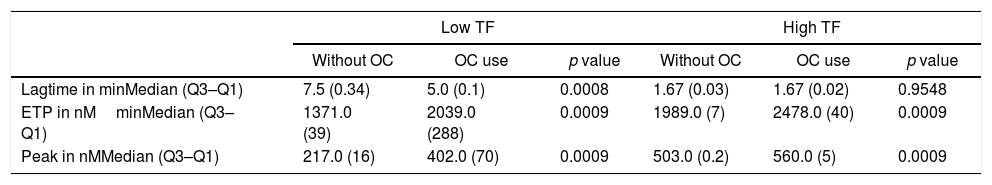
The results of lag time, ETP and peak parameters for women using or not an OC can be seen in Table 4, while the TGT profiles can be seen in Figure 4.
Comparison between thrombin generation test parameters in women using or not oral contraceptives.
| Low TF | High TF | |||||
|---|---|---|---|---|---|---|
| Without OC | OC use | p value | Without OC | OC use | p value | |
| Lagtime in minMedian (Q3–Q1) | 7.5 (0.34) | 5.0 (0.1) | 0.0008 | 1.67 (0.03) | 1.67 (0.02) | 0.9548 |
| ETP in nMminMedian (Q3–Q1) | 1371.0 (39) | 2039.0 (288) | 0.0009 | 1989.0 (7) | 2478.0 (40) | 0.0009 |
| Peak in nMMedian (Q3–Q1) | 217.0 (16) | 402.0 (70) | 0.0009 | 503.0 (0.2) | 560.0 (5) | 0.0009 |
Mann–Whitney test (values expressed as median and interquartile range: Q3–Q1). Results correspond to the mean of 8 replicates. OC: oral contraceptives.

OC users had significantly higher levels of ETP and peak when compared with non-users, and this can be observed in the reactions performed with low and high TF (Table 4). However, this increase in TG parameters was more pronounced in reactions performed with a TF in low concentration. Regarding the lag time, no difference was observed in reactions performed with a high TF. In reactions with a low TF, there was a prolongation of the lag time in plasma samples of women who did not use an OC.
DiscussionThe TGT is a method with potential clinical application as a global assay directed to screen genetic or acquired thrombotic and bleeding disorders. However, substantial differences in pre-analytical and analytical variables still exist, which make the comparison of results from different studies difficult.1,13,14 Since studies on TGT standardization are still scarce, this study aimed at evaluating the analytical variables, as well as the performance of the TGT in hypo- and hypercoagulability states. We found that OC use was associated with increased TG, which was more pronounced in reactions performed with low TF. In FVIII-deficient plasma, higher TG was associated with higher FVIII levels with a better discrimination with a low TF. In FVII-deficient plasma, the TG was lower when compared to normal plasma, and a more pronounced difference was observed when the reactions were performed with a high TF. The intra-assay CV was below 10% when using both a low and a high TF.
Under the conditions of hypocoagulability, in the test with FVIII-deficient lyophilized plasma, with a low TF, an increase of 121% in the ETP and 563% in the peak was observed in the plasma with 50% of FVIII:C compared to <1% of FVIII:C. Furthermore, there was an increase of 22% in the ETP and 50% in the peak in plasma with 100% of FVIII, compared to 50% of this factor.
Salvagno et al.18 studied the TG in a normal pool plasma diluted with FVIII-deficient plasma to obtain concentrations between 5% and 100% of FVIII. The reaction was performed with 0.179pM of TF and the researchers observed an increase in the TG, with an increase in the FVIII concentration. They concluded that the TG is an adequate technique to evaluate the global hemostatic capacity of patients with hemophilia A.
In reactions with a high TF, there was a reduced discrimination between different concentrations of FVIII, since an increase of only 1% in the ETP and 6% in the peak was observed in plasma with 50% of FVIII:C compared to <1%, and an increase of 38% in the ETP and 23% in the peak in plasma with 100% of FVIII:C compared to plasma with 50% FVIII:C. In the experiment with plasma samples from patients with hemophilia A at 1, 3 and 7 days after the infusion of FVIII, we observed that the TGT was able to detect differences in the hemostatic profile after the infusion of recombinant FVIII at different times. An analysis of the TG profile revealed decreasing values as a function of the time of infusion of FVIII, i.e., the longer the time elapsed after taking FVIII concentrate, the higher the hypocoagulability state became. Consistent with the results already observed for the FVIII-deficient lyophilized plasma, 1pM TF reactions were more sensitive to detect different factor concentrations.
As expected, the TG profile with a low TF better discriminated the different concentrations of FVIII, since the TF at low concentrations makes the reaction slower. Therefore, a low TF is more sensitive to study the deficiencies of factors related to the intrinsic pathway (FVIII, IX and XI). In conclusion, the concentration of TF influences the sensitivity of the test to different coagulation factors and when high TF was used, a good discrimination between the different concentrations of FVIII was not found.10,19
In the experiment with FVII-deficient plasma, the results with low and high TF were similar, showing a decrease of 23% in the ETP and 42% in the peak using high TF, and a decrease of 28% in the ETP and 36% in the peak using a low TF. A more expressive difference was in the lag time, which increased 83% with a high TF and 66% with a low TF in FVII-deficient plasma, when compared to normal plasma. This can be explained because the lag time corresponds to the initiation phase of the TG and, according to Dielis,11 this parameter is determined by the FVII. The coagulation cascade is initiated by the binding of TF to FVII. In addition, a longer lag time was observed in the reactions with a high TF because the use of high concentrations of TF makes the reaction faster and more sensitive to the changes in extrinsic pathway factors.
The TGT in hypercoagulable states showed that reactions with the TF in low concentration (1pM), OC users had higher TG when compared to non-users. In reactions with a high TF, OC users also had a higher potential for TG in relation to non-users, but the increase was less obvious. A comparison of the TG results using a low and a high TF reveals that OC users appeared to be more “hypercoagulable” compared to non-users, with a more pronounced difference when the reaction was performed with a low TF.
Combined oral contraceptives may induce significant changes in the coagulation system, such as increased coagulation factors (fibrinogen, VII, VIII, IX, X, XII and XIII), reduction of the anticoagulants protein S (PS) and antithrombin, and acquired resistance to the activated protein C, culminating in the increase in the TG.20 In this study, reactions with a low TF better discriminated the differences for ETP and peak values between OC users vs non-users. The increase in the TG in OC users may be related to an increase in FVIII and a decrease in the PS and (TFPI). The reaction with a low concentration of TF is more sensitive to changes in the intrinsic pathway and deficiencies in the TFPI, which requires a slower reaction to exert its effect. The decrease in PS levels may lead to a decrease in the action of the TFPI, since the PS is a cofactor of the TFPI.21–23 The results obtained in the present study suggest that the plasma of OC users show parameters in the TGT which are compatible with hypercoagulability, when compared to non-users. Such differences are more evident when the reactions occur with low TF concentrations.
As a limitation of this study, it should be noted that, unfortunately, it does not solve the main problems with the TGT, that is, the variation in the results of the inter-laboratory tests. However, this is beyond the scope of our study. As a manner of minimizing errors and decreasing intra- and inter-assay coefficients of variation, we decided to work only with Stago® kits and not with homemade reagents. According to Dargaud et al.,24 the use of reagents from the same source, as well as the use of the same procedure/technical protocol, significantly reduces the variability in the results.
Finally, in agreement with previous findings, we recommend the ideal conditions for the performance of the TGT as: (i) if the TG test is performed with Stago® reagents (PPP-Reagent Low® or PPP Reagent High®), 20μL of 1pM (lower concentration of TF) should be used or 5pM of TF (higher concentration of TF), according to the coagulation pathway to be evaluated, whether intrinsic or extrinsic; (ii) using low concentrations of TF (1pM – 20μL of PPP-Reagent Low®) the test is more sensitive to changes in the intrinsic pathway and (iii) using high concentrations of TF (5pM – 20μL of PPP-Reagent High®) the test is more sensitive to changes in the extrinsic pathway.
ConclusionThe TGT by the CAT method using a low and a high TF at concentrations of 1.0 and 5.0pM, respectively, can be reproducible with acceptable precision, with low inter- and intra-assay coefficients of variation. In addition, the TGT proved to be sensitive to detect hypo- and hypercoagulability states. The TGT may have useful applications in the hemostatic evaluation of bleeding and thrombotic disorders. However, a standardized protocol for the TGT is important to minimize the large inter-laboratory variability in results. We suggest that a multicenter study be undertaken to validate the use of the TGT in hyper- and hypocoagulability states in clinical practice.
Conflicts of interestThe authors declare no conflicts of interest.
We thank the Brazilian agencies FAPEMIG/SES and MS/CNPq for funding this study.


