
The osmotic fragility test (OFT), conventionally used for assisting the diagnosis of many erythrocyte disorders, is a manual and time-consuming analysis not daily performed in many medical laboratories. This study was aimed at defining the stability of whole blood samples used for assessing erythrocyte osmotic resistance.
MethodsTwenty-one consecutive routine whole blood samples collected into 5.4 mg K2EDTA were tested immediately after collection (day 0) and at different time intervals afterward (day 1, 2, 3, 4, 7, 10 and 14) after storage at 4 °C. The OFT was performed with the Osmored Monotest (1.3% glycerol; Eurospital, Trieste, Italy). Results at the different time points were compared with those obtained at day 0 and with the reference change value (i.e., 33%).
ResultsThe median value of both hyperosmolar and hyposmolar resistance increased from baseline, reaching statistical significance at day 7 for hyperosmolar resistance and at day 1 for hyposmolar resistance, respectively. The median relative increase of hemolysis percentage values become greater than the reference change value at day 3 for hyposmolar resistance, while this limit was never overcome for hyperosmolar resistance. A significant inverse association was found between the mean increase in hyperosmolar resistance and the baseline value of hyperosmolar resistance (r = −0.92), mean corpuscular volume (MCV; r = −0.46) or mean corpuscular hemoglobin (MCH; r = −0.44), as well as between the mean increase in hyposmolar resistance and the baseline value of hyposmolar resistance (r = −0.86), or patient age (r = −0.56).
ConclusionsThe sample stability seems critical for the OFT. Whole blood specimens should not be stored refrigerated at 4 °C for >2 days before testing.
The osmotic fragility test (OFT) is conventionally used for assessing erythrocyte resistance to hemolysis, thus assisting in the diagnosis of several erythrocyte disorders, such as hemolytic anemia, hereditary spherocytosis, elliptocytosis and thalassemia.1 Introduced at first in clinical laboratories by Dacie in 1954, the OFT analyzes erythrocyte hemolysis using a series of hypotonic solutions of sodium chloride (NaCl). In 1980, Zanella et al. introduced a modified version of the classic Dacie method, by adding glycerol to an isotonic phosphate buffered saline.2 The light wavelength commonly used for measurement is 540 nm, with only hemoglobin (as the major erythrocyte protein) contributing to absorption. Erythrocyte osmotic fragility is then defined by shifts in the hemolysis curve, by correlating light absorbance and NaCl concentration.2
The OFT is an essentially manual, labor-intensive and time-consuming analysis, so it cannot be performed daily in most clinical laboratories.1 Whole blood samples may hence be stored for days before testing.3 Several lines of evidence now demonstrate that most laboratory errors occur in the preanalytical phase, primarily due to the lack of standardized procedures for sample collection (i.e., transport, handling and preparation before testing) and storage.4 Within certain areas of testing, such as laboratory hematology, the consequences of errors might often be serious, especially those related to specialized diagnostic tests, since they may lead to the generation of false positive or negative test results and misdiagnosis, thus jeopardizing patient safety and producing an incremental but avoidable expense for the healthcare system. The clinical consequences of laboratory errors may be detrimental because they may contribute to the disruption of both clinical and therapeutic decisions.5 According to the International Standards Organization (ISO) 15189:2012 document, medical laboratories should always verify blood sample stability and assess potential influence of some preanalytical variables (i.e., time and temperature of storage before analyses).6 Regarding the OFT, this test may be influenced by several preanalytical variables related to the erythrocyte anaerobic metabolism.7 This study was therefore aimed at verifying the stability of whole blood samples used for assessing the erythrocyte osmotic resistance.
Materials and methodsTwenty-one consecutive routine whole blood samples (mean patient age, 68 ± 9 years; 6 women and 15 men), collected into 5.4 mg K2EDTA tubes (Vacutest Kima, Padova, Italy) and referred to the local laboratory for assessment of the erythrocyte osmotic resistance, were tested immediately after collection (day 0) and at different time intervals afterward (1, 2, 3, 4, 7, 10 and 14 days). During the study period, all samples were kept refrigerated at 4 °C. The OFT was performed with the Osmored Monotest (1.3% glycerol; Eurospital, Trieste, Italy), which uses both hyperosmotic (normal value, >70%) and hyposmotic (normal value, <30%) solutions. Results at the different time points of storage were compared with those obtained at day 0 with the Mann-Whitney paired test. The relative variation of the OFT results over time was also compared with the reference change value (i.e., 33%), calculated from the local analytical variability of the assay (i.e., 1.3%) and from recently published data on the biological variation in the erythrocyte osmotic stability (i.e., 12%) in healthy, physically active subjects.8 Potential associations were tested with Spearman’s correlation. The statistical analysis was performed with Analyse-it (Analyse-it Software Ltd, Leeds, UK). Statistical significance was set at p < 0.05. The study was based on anonymized routine samples referred for routine OFT, so that written informed consent was unnecessary. The research was cleared by the local Ethical Committee (University Hospital of Verona, n. 971CESC, July 25, 2016) and conducted in accordance with the Helsinki Declaration, as revised in 2008.
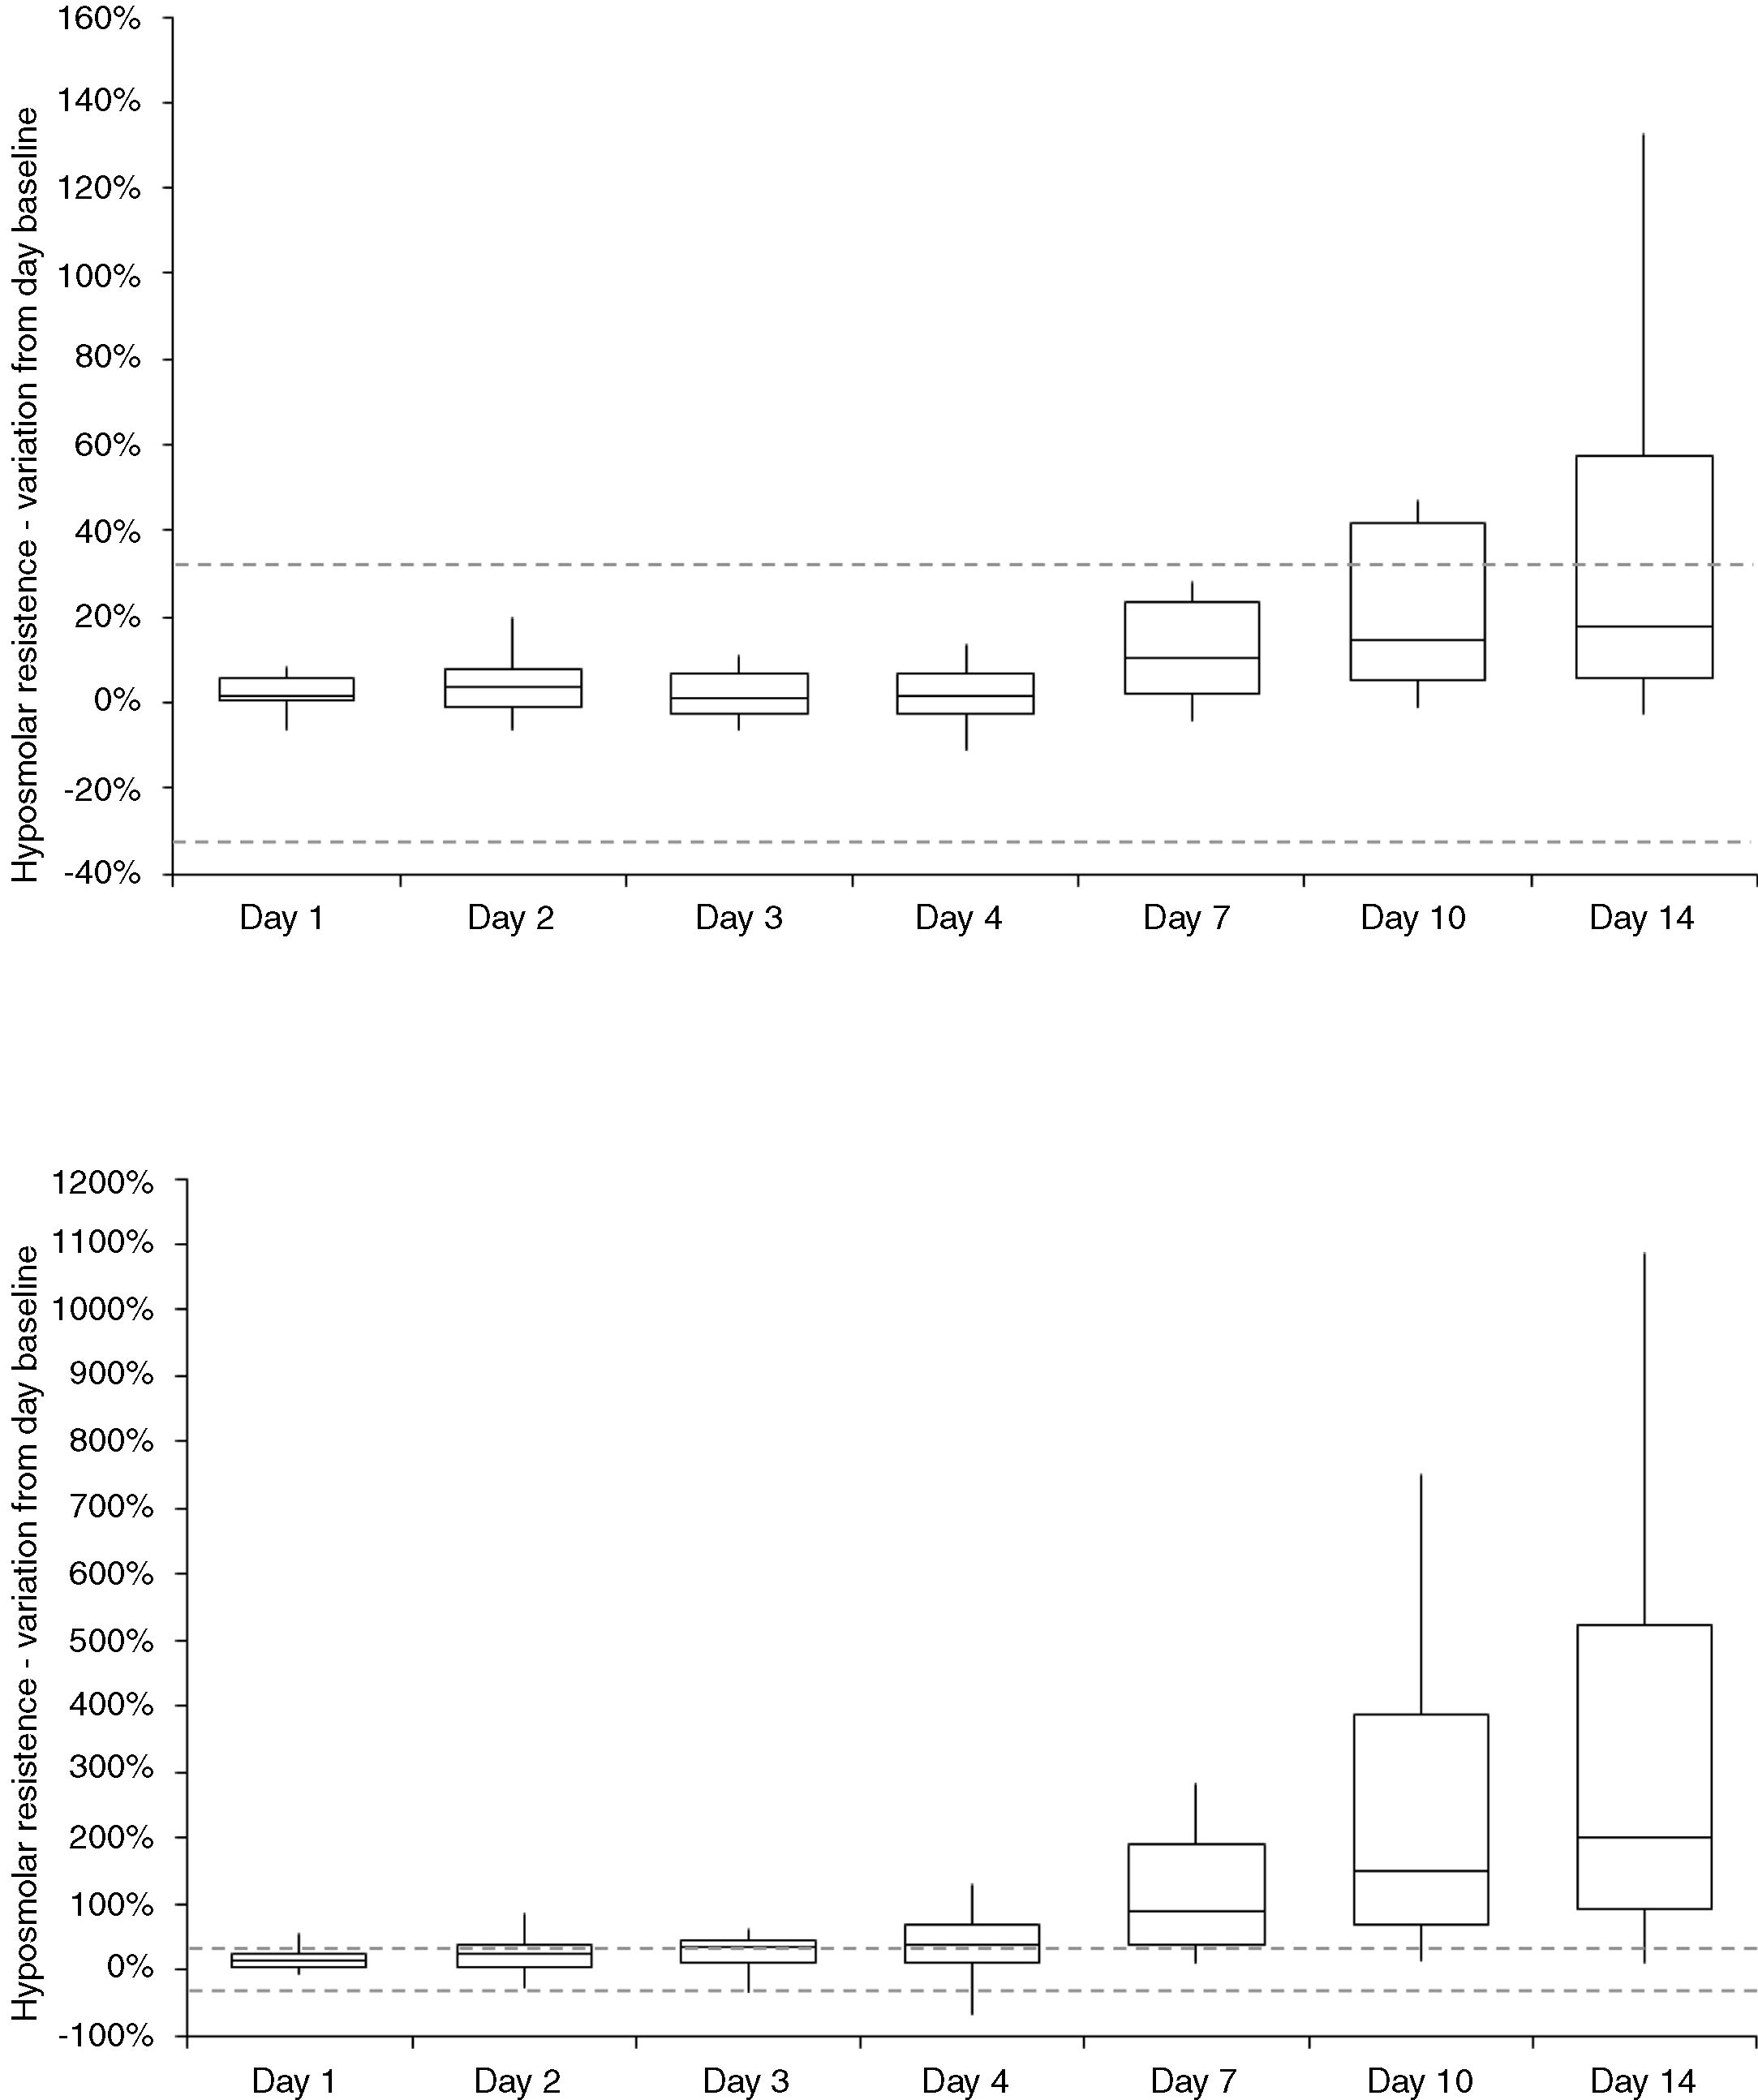
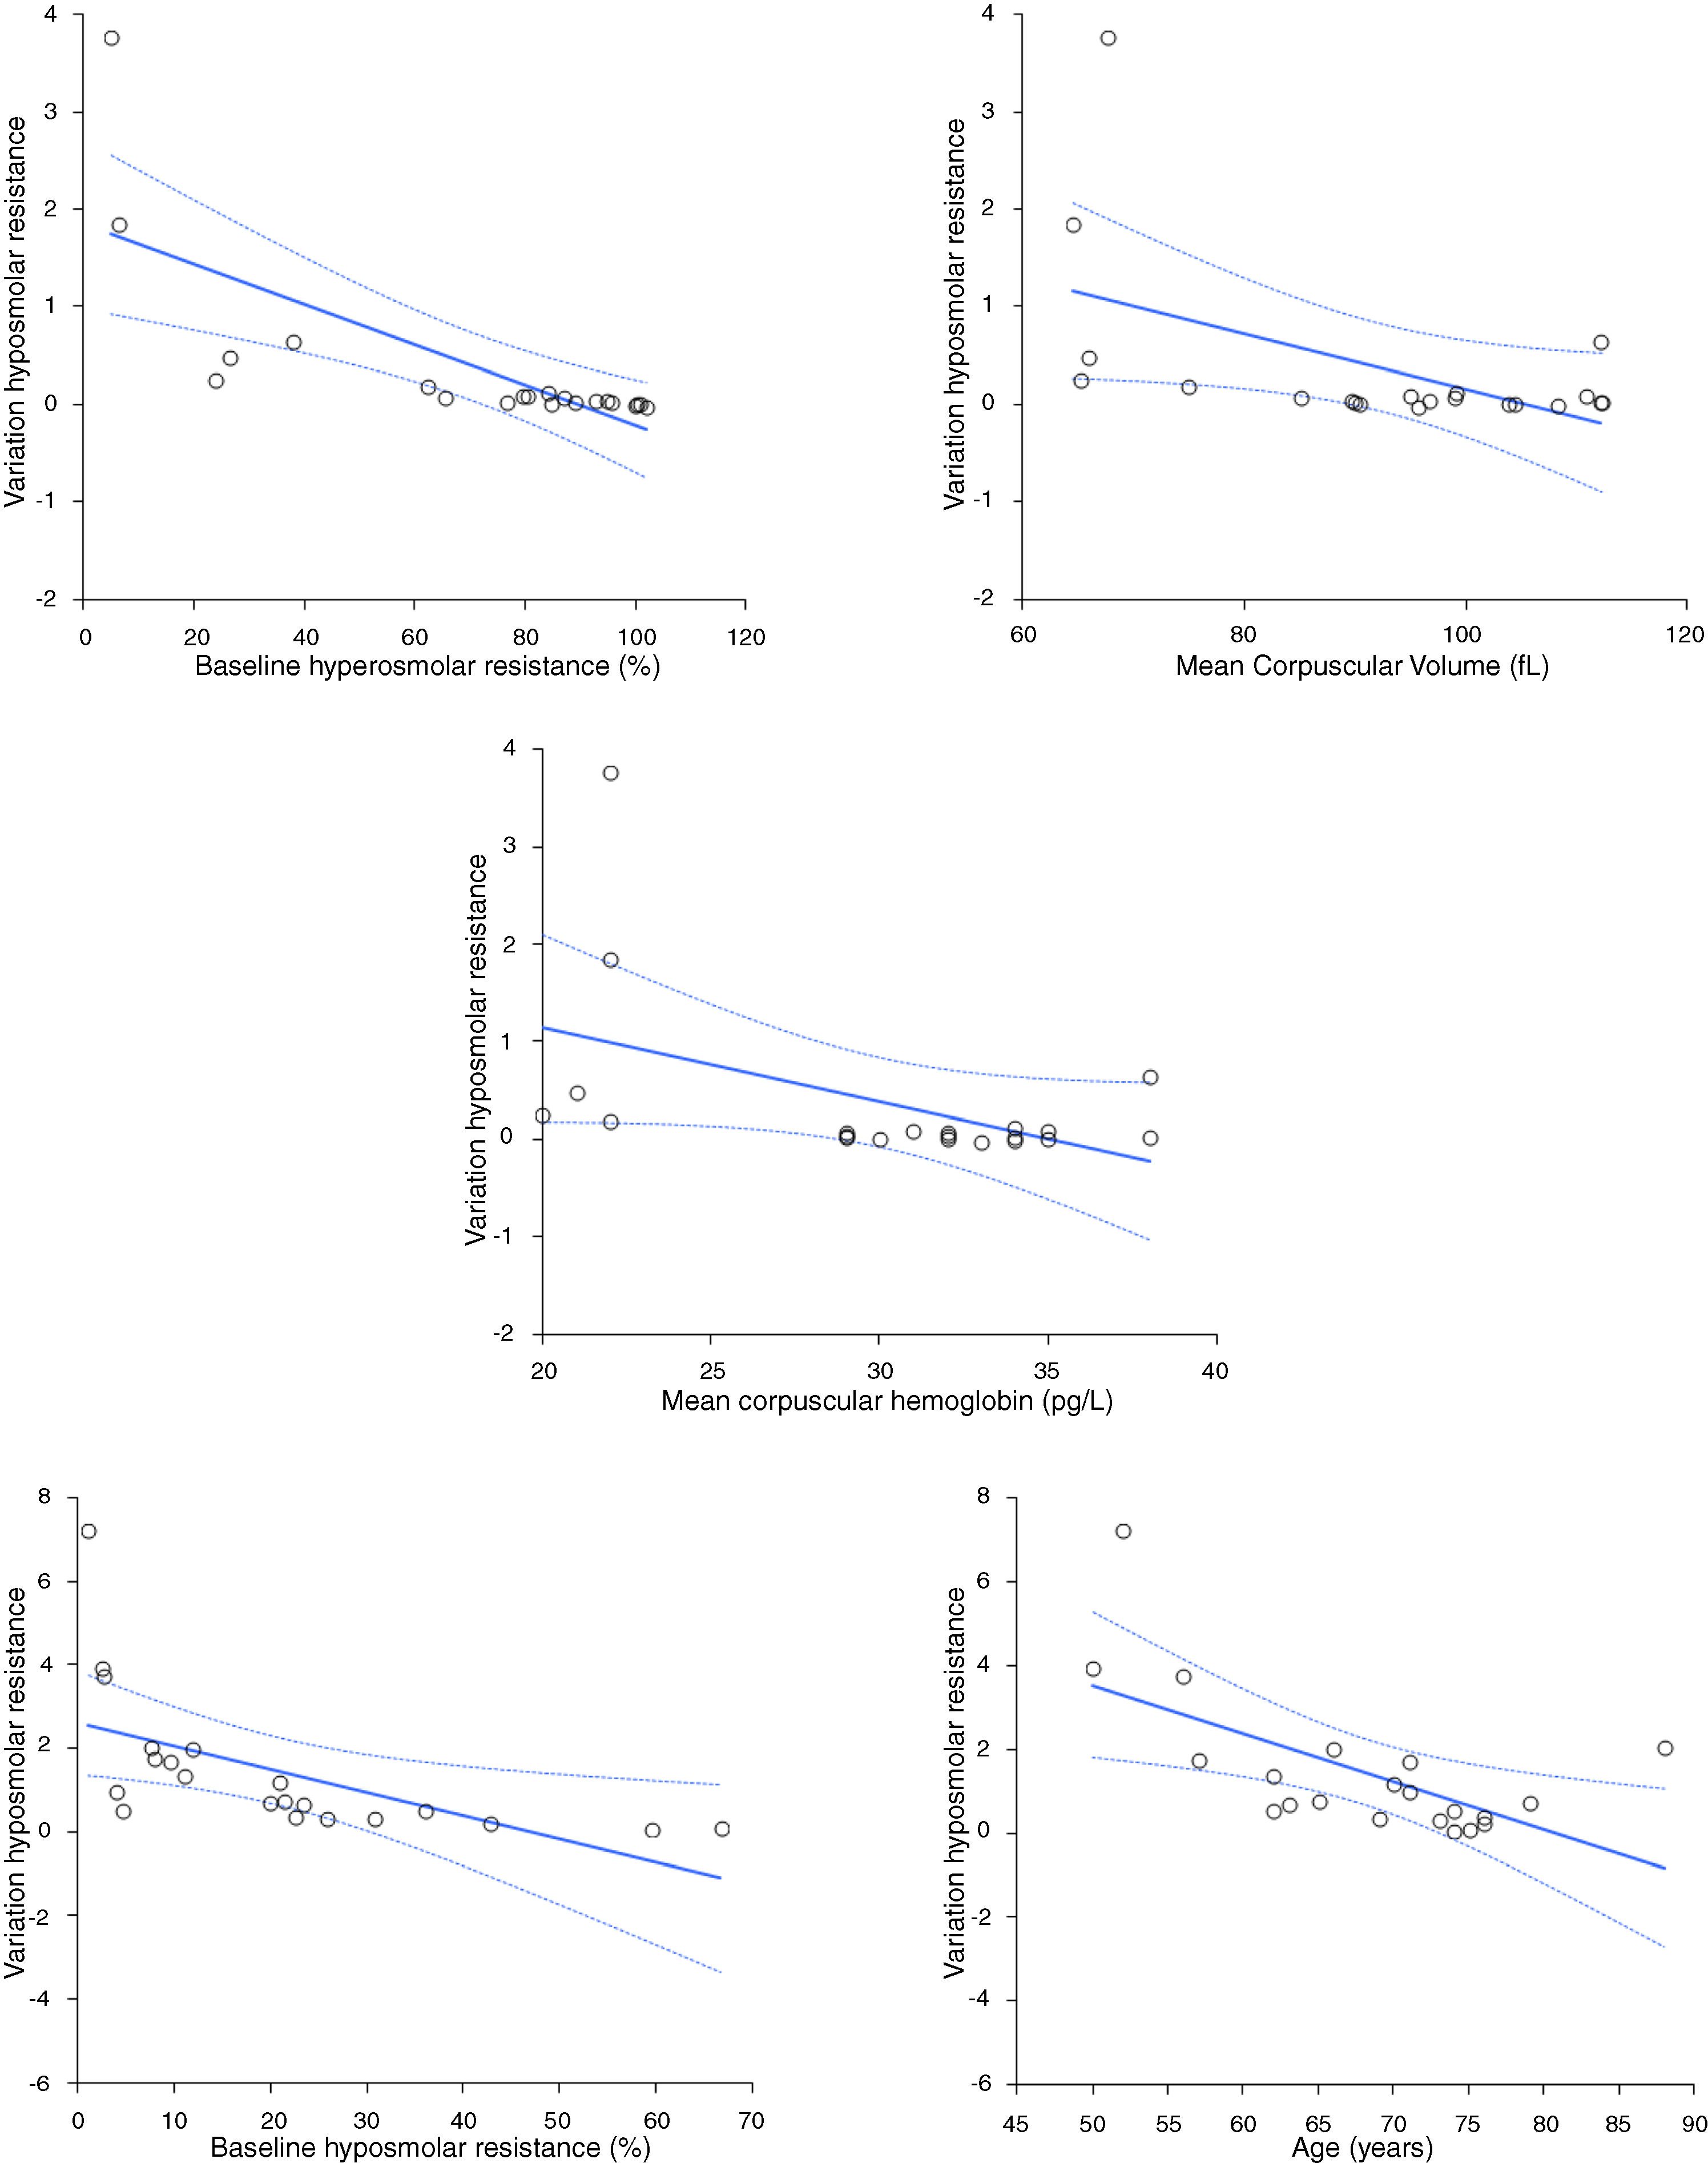
ResultsThe variation of hyperosmolar and hyposmolar resistance (hemolysis percentage) in whole blood samples stored for up to 14 days at 4 °C is shown in Table 1. The median value of both hyperosmolar and hyposmolar resistance progressively increased from baseline, reaching statistical significance at day 7 for hyperosmolar resistance and at day 1 for hyposmolar resistance, respectively. The median relative increase in hemolysis percentage values become higher than the reference change value (i.e., 33%) at day 3 for hyposmolar resistance, while this limit was never reached during the study period for hyperosmolar resistance (Fig. 1). A significant inverse association was found between the mean increase in hyperosmolar resistance over time and the baseline value of hyperosmolar resistance (r = −0.92; p < 0.001), mean corpuscular volume (MCV; r = −0.46; p = 0.034) or mean corpuscular hemoglobin (MCH; r = −0.44; p = 0.048), as well as between the mean increase in hyposmolar resistance over time and the baseline value of hyposmolar resistance (r = −0.86; p < 0.001), or age of patients (r = −0.56; p = 0.008) (Fig. 2). Unlike these findings, the mean increase in the hyperosmolar resistance was not associated with the age (r = −0.41; p = 0.067) or sex of patients (r = 0.00; p = 1.00) or hemoglobin value (r = −0.14; p = 0.559), while the mean increase in hyposmolar resistance was not associated with the sex of patients (r = 0.00; p = 1.00), hemoglobin (r = 0.30; p = 0.189), MCV (r = −0.29; p = 0.194) or MCH (r = −0.18; p = 0.444).
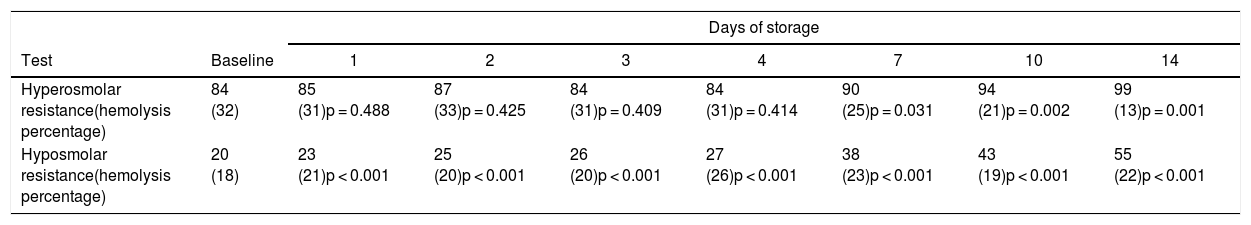
Variation in hyperosmolar and hyposmolar resistance (hemolysis percentage; median values and interquartile range) in whole blood sample stored for up to 14 days at 4 °C.
| Days of storage | ||||||||
|---|---|---|---|---|---|---|---|---|
| Test | Baseline | 1 | 2 | 3 | 4 | 7 | 10 | 14 |
| Hyperosmolar resistance(hemolysis percentage) | 84 (32) | 85 (31)p = 0.488 | 87 (33)p = 0.425 | 84 (31)p = 0.409 | 84 (31)p = 0.414 | 90 (25)p = 0.031 | 94 (21)p = 0.002 | 99 (13)p = 0.001 |
| Hyposmolar resistance(hemolysis percentage) | 20 (18) | 23 (21)p < 0.001 | 25 (20)p < 0.001 | 26 (20)p < 0.001 | 27 (26)p < 0.001 | 38 (23)p < 0.001 | 43 (19)p < 0.001 | 55 (22)p < 0.001 |
 in whole blood sample stored for up to 14 days at 4 °C. The horizontal dotted lines define the reference change value in osmotic resistance.")

In 2011, the World Health Organization (WHO) reinforced the concept that appropriate management of patient samples is critical for the accuracy and reliability of laboratory testing, as well as for the safeguarding of the clinical decision making.9 Therefore, laboratories must be proactive in ensuring that all samples meet the necessary requirements for producing accurate test results, since sample management is part of the process control and one of the essential aspects of the quality management system.9 Blood sample quality remains a mainstay for the quality of the total testing process because the receipt of unsuitable samples may be associated with diagnostic delay, missed or wrong diagnoses, but may also generate remarkable economic constraints on hospital and laboratory budgets.10
According to the ongoing reorganization of medical laboratory services, increasingly integrated within large networks of facilities (i.e., the so-called “hub-and-spoke” paradigm), strengthened efforts will be necessary in the monitoring of the quality of diagnostic blood samples.11 Reliable evidence suggests that the preanalytical phase is the most critical part of the total testing process, since up to 70% of diagnostic errors are related to inappropriate procedures for sample collection, handling, transportation, and storage.10
The OFT, one of the oldest hematology laboratory tests used for assessing the physical state of erythrocytes, remains an essential analysis for screening red blood cell (RBC) disorders. Briefly, the OFT measures the surface/volume ratio of erythrocytes as it exists when they are suspended in an isotonic medium, thus reflecting the extent of membrane redundancy when RBCs are in equilibrium within an isotonic salt solution with or without glycerol.12 However, the blood sample storage conditions may have a profound influence on erythrocyte shape, volume and integrity, due to the continuous anaerobic metabolism of these blood elements. Rapoport originally described that membrane injuries may occur during erythrocyte storage, which may then lead to spherical transformation, lower membrane redundancy and increased vulnerability at a relatively high osmotic strength.13 Beutler et al. also demonstrated that osmotic fragility variation is not only due to loss of membrane integrity, but also to the presence of osmotically active substances (i.e., lactate) within the cell, which would then make the intracellular space hyperosmolar when the cell is immersed in isotonic saline.12
Taken together, our findings demonstrate that prolonged storage of whole blood may have a substantial influence on the diagnostic accuracy of the OFT, especially for hyposmolar resistance. Therefore, whole blood specimens should not be stored refrigerated at 4 °C for >2 days before testing. These results are in accordance with those published nearly 25 years ago by Saxena et al.,14 who showed that storage at 4 °C for up to 15 days of heparinized samples of whole blood was associated with a modest increase in erythrocyte osmotic fragility (assessed using hypotonic saline solutions), although no experiment were performed for evaluating the stability of hyposmolar resistance.
In conclusion, the results of our study demonstrate that sample stability seems critical for the OFT, especially for hyposmolar resistance. This finding could help laboratory professionals to define clear policies for sample storage requirements for OFT testing in laboratory handbooks.
Conflicts of interestThe authors declare no conflicts of interest.
Authorship contributionsGLS and GL conceived and designed the study, analyzed the data, performed the statistical analysis and drafted the manuscript; DD and FD, performed the experiments; GLS and GL interpreted the data and wrote the manuscript. All authors critically revised the manuscript and approved the final version.


