

The novel SARS-CoV-2 infection has been spreading around the world since January 2020 causing the Corona Virus Disease 2019. Leukopenia, lymphopenia and hypercoagulability with elevated D- Dimers have been described in COVID-19 patients to date. This study aimed to clarify if some blood parameters can be used as biomarkers to facilitate diagnosis and establish prognosis. Methods: We selected patients who had tested positive for SARS-CoV-2 and had had a hemogram performed between the March 15 and April 15, 2020. Socio-demographic and analytical data were obtained from 274 patients at admission in two Portuguese public hospitals. We then analyzed the hemogram parameters at admission in the intensive care and collected data on patient survival during the SARS-CoV-2 disease follow-up. The data were analyzed using appropriate statistical tests. Results: Patients requiring the intensive care unit (ICU) present an increase in leukocytes and neutrophils (+3.1 × 10⁹/L and +6.4 × 10⁹/L, respectively), a lymphocyte decrease and a platelet rise (-1.6 × 10⁹/L and +60.8 × 10⁹/L, respectively). The erythrocytes, hemoglobin and median globular volume tend to decrease (-0.5 × 10¹², - 1.2 g/dL; -3 fL, respectively). The lactic acid dehydrogenase (LDH) at admission was significantly higher (+58.1 U/L). The age, sex, platelets, lymphocyte count neutrophil counts, neutrophil/lymphocyte ratio, erythrocytes and cell hemoglobin concentration mean (CHCM) are independently associated with mortality (odds ratio (OR) = 0.046, p < 0.001; OR = 0.2364, p = 0.045; OR = 9.106, p = 0.001; OR = 0.194, p = 0.033; OR = 0.062, p = 0.003; OR = 0.098, p = 0.002; OR = 9.021, p < 0.001; OR = 7.016, p = 0.007, respectively).
ConclusionThe hematological data at admission in the health care system can predict the mortality of the SARS-CoV-2 infection and we recommend its use in the clinical decisions and patient prognosis evaluation.
The novel severe acute respiratory syndrome coronavirus 2 (SARS-CoV-2) has been spreading around the world since January 2020, causing the Corona virus disease 2019 (COVID – 19). This infectious disease presents itself mainly with fever, fatigue, non-productive cough and dyspnoea.
But what are the hematological findings? Can we use some blood parameters to facilitate diagnosis? Are there any indicators of poor prognosis/worse survival?
The following are the facts associated with COVID- 19 to date:
- 1.
Leukopenia: the normal or reduced leucocyte count is frequent.1
- 2.
Lymphopenia: a reduced lymphocyte count has been described as “frequent” and presents a prognostic value; there is likely an association between lymphopenia and the need for the Intensive Care Unit (ICU) care, acute respiratory distress syndrome and longer stay at the hospital.1,2,3,4 These findings may be related to the expression of the ACE2 receptor on the lymphocyte surface and the direct infection of these cells by the virus.5,6
- 3.
Increased neutrophils: an elevation in neutrophils has also been associated with the increased risk of death.4
- 4.
Hypercoagulability and elevated D-dimers: blood hypercoagulability is common among hospitalized COVID- 19 patients and venous thromboembolic events seem to be more frequent in the critically ill patients admitted to the ICU with this syndrome.6,7 The correlation between the hypercoagulability and a worse outcome may be justified by the progression to disseminated intravascular dissemination (DIC) and/or the microvascular thrombosis that leads to hypoxemic respiratory failure.7
The procoagulant changes are characterized by elevated fibrinogen and D-Dimers. 6,7 A gradual increase in the D-Dimers during the disease is associated with a worse outcome (increased risk of acute respiratory distress syndrome (ARDS) and death), with significantly higher values in patients requiring the ICU.3,4 Some authors have suggested that a prophylactic dose of heparin is able to decrease the death rate in COVID-19 positive patients.6,8
- 1.
Platelet counts: some studies have suggested that thrombocytopenia is associated with the severity of the disease.9 Other authors highlighted that patients with significantly elevated platelets had longer average hospitalization stays.1 The second hypothesis is consistent with the correlation between the platelet count and the SARS-COV-2-associated cytokine storm, as the IL-6 promotes the generation of megakaryocytes by stimulating the increase of TPO levels. 1
- 2.
Platelet/lymphocyte Ratio: the platelet to lymphocyte ratio at the time of the platelet peak (especially during the cytokine storm) is reported as an independent prognostic factor for the more prolonged hospitalization, the higher the platelet peak, which means a more pronounced cytokine storm. The higher the increase of the ratio during treatment, the longer the hospitalization stay and the greater the likelihood of severe pneumonia.1,6
- 3.
Age: ICU patients are approximately a decade older than the non-ICU patients. 10
This study aimed to clarify if some blood parameters can be used as biomarkers to facilitate diagnosis and establish prognosis.
Here are the questions we raised:
How prevalent are hematologic changes in COVID patients?
- A)
What findings are more frequent? Do any of the hematologic changes have a relevant prognostic value?
- B)
Is there a pattern of hematologic alterations in the initial hemogram of patients who are admitted to intensive care?
- C)
Is there a pattern of hematologic alterations in the initial study of patients who die (within a month) after the diagnosis of COVID-19?
- D)
How does the lymphocyte/platelet index vary and what is its prognostic value?
We selected all patients who had tested positive for SARS-COV-2 between March 15 and April 15, 2020. We included in this study all the patients with hemograms dated from 48h before to 48h after the positive test. The hemogram selected from each patient was the one with the lower time interval from the positive SARS-COV-2 test, using the following criteria:
1st - hemogram from the same day as the SARS-COV-2 test
OR
2 nd - hemogram from 24h after the SARS-COV-2 + test
OR
3rd - hemogram from 24h before the SARS-COV-2 + test
OR
4th - hemogram from 48h after the SARS-COV-2 + test
OR
5th - hemogram from 48h before the SARS-COV-2 + test
We also analyzed the hemogram parameters at admission to the intensive care unit (besides the hemogram in the first contact with healthcare) in the same population.
We then compared the hematologic changes between admission and admission to the intensive care unit.
Later we compared hematologic changes at admission between patients who survived and those who died.
Statistical analysis
The Kolmogorov-Smirnov test was used to evaluate the variable distributions for normality. Normally distributed variables are presented as the mean ± standard deviation (SD), whereas non-normal data are presented as the median [interquartile range (IQR)]. Multiple comparisons between groups (age groups) were performed by the one-way ANOVA, supplemented with the Tukey's HSD post-hoc test. The paired-samples T-test or Wilcoxon tests were used to compare data from patients requiring or not intensive care and comparing data from patients who died or not. A logistic regression was performed, with dead/not dead as the dependent variable. For this analysis, quartiles were used to transform continuous into discrete variables.
Univariate logistic regression models were made, considering each covariate, to identify potential factors associated with mortality. All covariates were included in a multivariate logistic regression model. The odds ratios (ORs) and their 95% confidence intervals (CIs) were reported.
Significance was defined at p less than 0.05. For statistical analysis, we used the Statistical Package for Social Sciences (SPSS), version 26.0.
Hypercoagulability and elevated D-dimers were not measured, due to insufficient data.
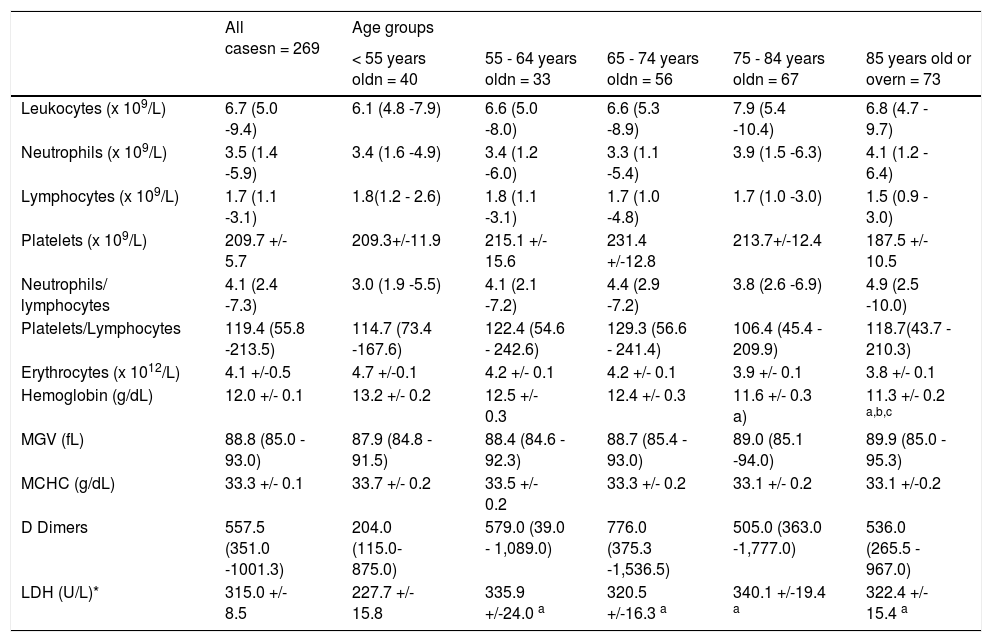
ResultsAge comparisons (Table 1):
Age comparison.
| All casesn = 269 | Age groups | |||||
|---|---|---|---|---|---|---|
| < 55 years oldn = 40 | 55 - 64 years oldn = 33 | 65 - 74 years oldn = 56 | 75 - 84 years oldn = 67 | 85 years old or overn = 73 | ||
| Leukocytes (x 109/L) | 6.7 (5.0 -9.4) | 6.1 (4.8 -7.9) | 6.6 (5.0 -8.0) | 6.6 (5.3 -8.9) | 7.9 (5.4 -10.4) | 6.8 (4.7 - 9.7) |
| Neutrophils (x 109/L) | 3.5 (1.4 -5.9) | 3.4 (1.6 -4.9) | 3.4 (1.2 -6.0) | 3.3 (1.1 -5.4) | 3.9 (1.5 -6.3) | 4.1 (1.2 - 6.4) |
| Lymphocytes (x 109/L) | 1.7 (1.1 -3.1) | 1.8(1.2 - 2.6) | 1.8 (1.1 -3.1) | 1.7 (1.0 -4.8) | 1.7 (1.0 -3.0) | 1.5 (0.9 - 3.0) |
| Platelets (x 109/L) | 209.7 +/- 5.7 | 209.3+/-11.9 | 215.1 +/- 15.6 | 231.4 +/-12.8 | 213.7+/-12.4 | 187.5 +/- 10.5 |
| Neutrophils/ lymphocytes | 4.1 (2.4 -7.3) | 3.0 (1.9 -5.5) | 4.1 (2.1 -7.2) | 4.4 (2.9 -7.2) | 3.8 (2.6 -6.9) | 4.9 (2.5 -10.0) |
| Platelets/Lymphocytes | 119.4 (55.8 -213.5) | 114.7 (73.4 -167.6) | 122.4 (54.6 - 242.6) | 129.3 (56.6 - 241.4) | 106.4 (45.4 - 209.9) | 118.7(43.7 - 210.3) |
| Erythrocytes (x 1012/L) | 4.1 +/-0.5 | 4.7 +/-0.1 | 4.2 +/- 0.1 | 4.2 +/- 0.1 | 3.9 +/- 0.1 | 3.8 +/- 0.1 |
| Hemoglobin (g/dL) | 12.0 +/- 0.1 | 13.2 +/- 0.2 | 12.5 +/- 0.3 | 12.4 +/- 0.3 | 11.6 +/- 0.3 a) | 11.3 +/- 0.2 a,b,c |
| MGV (fL) | 88.8 (85.0 - 93.0) | 87.9 (84.8 - 91.5) | 88.4 (84.6 - 92.3) | 88.7 (85.4 - 93.0) | 89.0 (85.1 -94.0) | 89.9 (85.0 - 95.3) |
| MCHC (g/dL) | 33.3 +/- 0.1 | 33.7 +/- 0.2 | 33.5 +/- 0.2 | 33.3 +/- 0.2 | 33.1 +/- 0.2 | 33.1 +/-0.2 |
| D Dimers | 557.5 (351.0 -1001.3) | 204.0 (115.0-875.0) | 579.0 (39.0 - 1,089.0) | 776.0 (375.3 -1,536.5) | 505.0 (363.0 -1,777.0) | 536.0 (265.5 - 967.0) |
| LDH (U/L)* | 315.0 +/- 8.5 | 227.7 +/- 15.8 | 335.9 +/-24.0 a | 320.5 +/-16.3 a | 340.1 +/-19.4 a | 322.4 +/- 15.4 a |
1. The LDH is significantly higher in patients over 55 years old (yrs).*
In patients over 75 yrs, the hemoglobin value was up to 1.9 g/dL, lower (11.3 g/dL) than that of the group under 55 (Hb = 13.2 g/dL).*
The elderly group (age > 85 yrs) had lower hemoglobin (-1.2g/dL; 11.3 g/dL) than the 55- to 64-year-old group (Hb=12.5 g/dL).*
Patients who were admitted to the intensive care unit were significantly younger (minus 9 yrs; Age = 67 yrs), compared to those who were not (age = 76 yrs).*
*p < 0.05
Comparisons with intensive care unit stay (Table 2)
Comparison between “At admission” and “At admission in intensive care”
| All casesn = 269 | Patients admitted to the intensive care unit(n = 12) | ||
|---|---|---|---|
| At hospital admission | At intensive care admission | ||
| Age, years | 76.0 (63.0 - 85.5) | 67 (57.8 - 70.8) | |
| Sex, % Male | 42.4% (n = 114) | 66.7% (n = 8) | |
| Leukocytes (x109/L) | 6.7 (5.0 - 9.4) | 6.6 (5.1-8.3) | 9.7 (7.4-13.4) a |
| Neutrophils (x109/L) | 3.5 (1.4 - 5.9) | 1.6 (1.0 - 5.2) | 8.0 (5.0 - 10.3) a |
| Lymphocytes (x109/L) | 1.7 (1.1 - 3.1) | 2.4 (1.1 - 5.2) | 0.8 (0.5 - 1.3) a |
| Platelets (x109/L) | 209.7 +/- 5.7 | 184.2 +/- 15.6 | 245.0 +/- 29.8 a |
| Neutrophils/ lymphocytes | 4.1 (2.4 - 7.3) | 3.2 (2.0 - 8.5) | 0.2 (0.1 - 5.9) |
| Platelets/Lymphocytes | 119.4 (55.8 -213.5) | 59.4 (42.3 - 200.9) | 49.4 (23.2 - 131.4) |
| Erythrocytes (x1012/L) | 4.1 +/- 0.5 | 4.2 +/- 0.2 | 3.7 +/- 0.2 a |
| Haemoglobin (g/dL) | 12.0 +/- 0.1 | 12.6 +/- 0.6 | 11.4 +/- 0.5 a |
| MGV (fL) | 88.8 (85.0 - 93.0) | 93.0 (84.0 - 99.0) | 90.0 (85.1 - 96.8) a |
| MCHC (g/dL) | 33.3 +/- 0.1 | 33.6 +/- 0.3 | 33.8+/-0.3 |
| D Dimers | 557.5 (351.0 -1001.3) | 917.0 (823.0 -954.0) | 1,327.5 (871.0 -1,901.8) |
| LDH (U/L) | 315.0 +/- 8.5 | 387.4 +/- 33.5 | 445.5 +/- 22.7 |
In patients requiring the intensive care unit, we observed the following changes between admission and during the intensive care unit stay (Table 2):*
1. A significant elevation of leukocytes (+3.1 × 10⁹/L), neutrophils (+6.4 × 10⁹/L) and platelet count (+60.8 × 10⁹/L).
2. A significant decrease in the lymphocyte count (-1.6 × 10⁹/L), erythrocytes, hemoglobin and median globular volume (-0.5 × 10¹² - 1.2 g/dL; -3 fL, respectively).
*p < 0.05
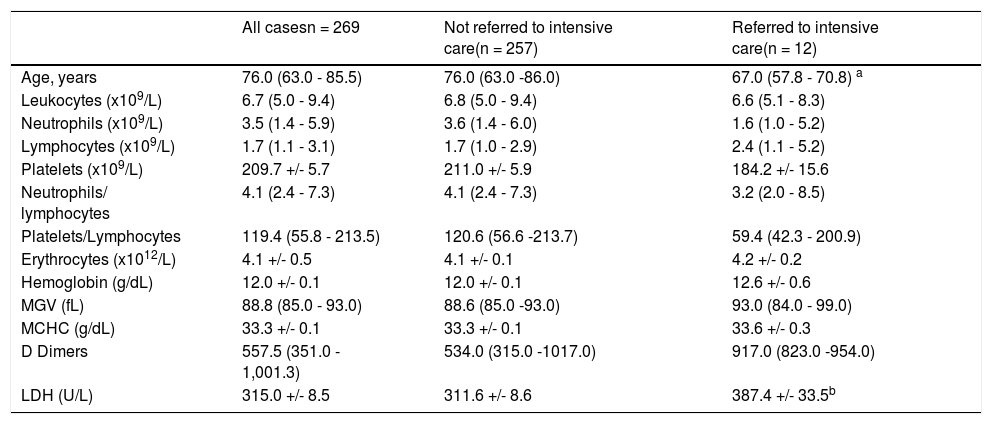
Between patients requiring the intensive care unit and those who did not (Table 3):
comparison between “Not referred to intensive care” and “Referred to intensive care”
| All casesn = 269 | Not referred to intensive care(n = 257) | Referred to intensive care(n = 12) | |
|---|---|---|---|
| Age, years | 76.0 (63.0 - 85.5) | 76.0 (63.0 -86.0) | 67.0 (57.8 - 70.8) a |
| Leukocytes (x109/L) | 6.7 (5.0 - 9.4) | 6.8 (5.0 - 9.4) | 6.6 (5.1 - 8.3) |
| Neutrophils (x109/L) | 3.5 (1.4 - 5.9) | 3.6 (1.4 - 6.0) | 1.6 (1.0 - 5.2) |
| Lymphocytes (x109/L) | 1.7 (1.1 - 3.1) | 1.7 (1.0 - 2.9) | 2.4 (1.1 - 5.2) |
| Platelets (x109/L) | 209.7 +/- 5.7 | 211.0 +/- 5.9 | 184.2 +/- 15.6 |
| Neutrophils/ lymphocytes | 4.1 (2.4 - 7.3) | 4.1 (2.4 - 7.3) | 3.2 (2.0 - 8.5) |
| Platelets/Lymphocytes | 119.4 (55.8 - 213.5) | 120.6 (56.6 -213.7) | 59.4 (42.3 - 200.9) |
| Erythrocytes (x1012/L) | 4.1 +/- 0.5 | 4.1 +/- 0.1 | 4.2 +/- 0.2 |
| Hemoglobin (g/dL) | 12.0 +/- 0.1 | 12.0 +/- 0.1 | 12.6 +/- 0.6 |
| MGV (fL) | 88.8 (85.0 - 93.0) | 88.6 (85.0 -93.0) | 93.0 (84.0 - 99.0) |
| MCHC (g/dL) | 33.3 +/- 0.1 | 33.3 +/- 0.1 | 33.6 +/- 0.3 |
| D Dimers | 557.5 (351.0 - 1,001.3) | 534.0 (315.0 -1017.0) | 917.0 (823.0 -954.0) |
| LDH (U/L) | 315.0 +/- 8.5 | 311.6 +/- 8.6 | 387.4 +/- 33.5b |
There was a statistically significant difference (but for p < 0.1) in the LDH value at admission between patients requiring the intensive care and those who did not. The former presented a higher LDH value (+75.8 U/L) at admission to the hospital.
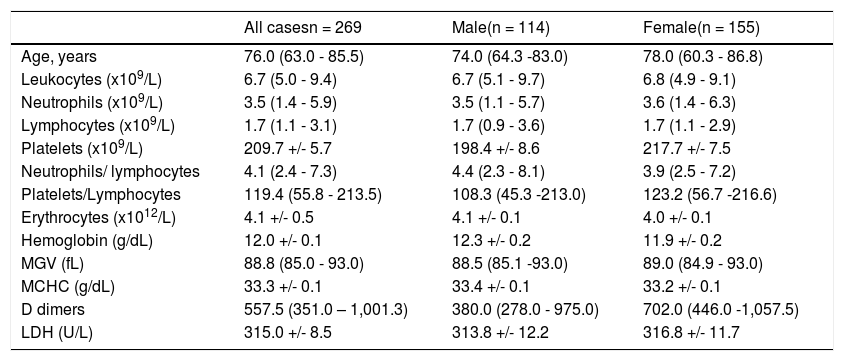
Gender comparison (Table 4)
Comparison between “Male” and “Female”.
No statistical difference between male and female.
- There were no significant differences between men and women.
*p < 0.05
Other findings:
There were no statistically significant changes in the lymphocyte/platelet index.
Patients who were admitted to the intensive care unit were significantly younger (9 yrs), compared to those who were not.*
*p < 0.05
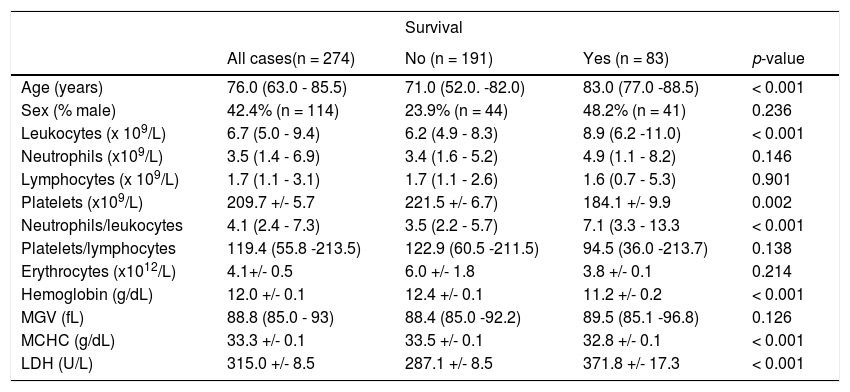
Mortality (Table 5)
Comparison between ‘survival’ vs. ‘non-survival’.
When we look at the overall mortality in a total of 274 patients, 30.2% (n = 83) died, 29.2% (n = 80) died within a month after testing positive for SARS-Cov-2 and 20.1% (n = 55) died within a week.
Only 4.7% (n = 13) were admitted to the intensive care unit and the overall mortality in this group was 15.4% (n = 2).
In the group of patients who died, our study showed significantly lower values* for platelet counts (mean 184.1 × 10⁹/L; mean 34 × 109/L decrease), hemoglobin concentration (mean 11.2 g/dL; 1.1 g/dL decrease) and MCHC (mean 32.8 g/dL; 0.7g/dL decrease); significantly higher* values were found for the leukocyte count (mean 8.9 × 10⁹/L; 2.7 × 10⁹/L higher), neutrophil/leukocyte ratio (mean 7.1; 3.6 higher) and LDH (mean 371.8 U/L; 84.7 U/L higher).
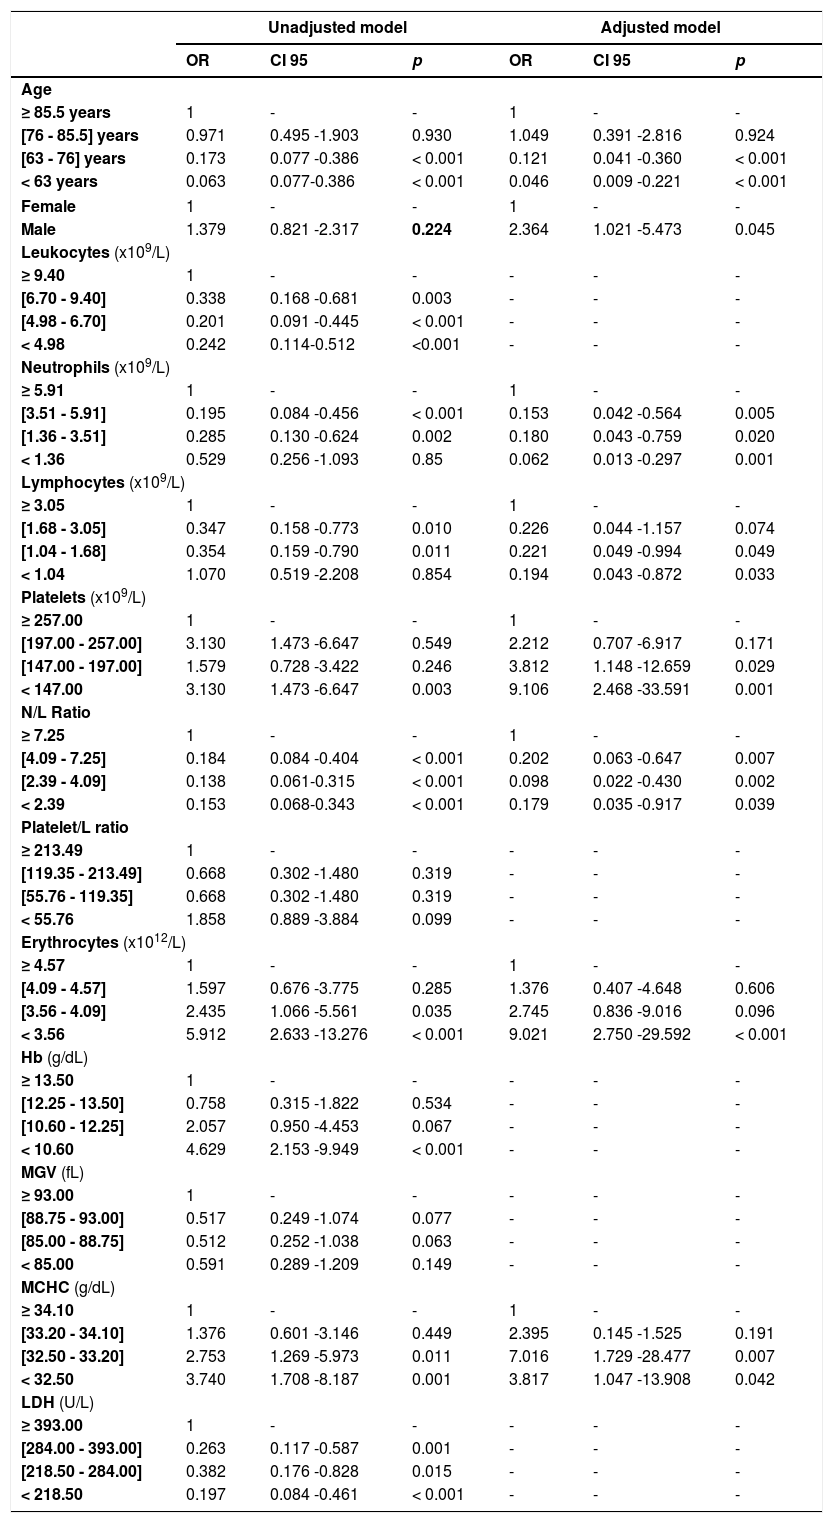
Analyzing the association between mortality and all studied variables, and using unadjusted models, we verified an association with age, leukocytes, neutrophil count, lymphocyte count, erythrocytes and platelet count, neutrophil/lymphocyte ratio, hemoglobin concentration and MCHC and LDH levels (Table 6). For the adjusted model, we found that age, sex, lymphocytes, neutrophils, neutrophil/lymphocyte ratio, platelets, erythrocyte count and MCHC at hospital admission are independent variables associated with mortality in patients with the COVID infection (Table 6). Patients over 85.5 years old have 21.7 times more risk of mortality, when compared with those under 63 years old, and the risk of mortality is 2.364 times higher in male patients. Concerning the hematological data, patients with a neutrophil count higher than 5.91 × 10⁹/L have a risk of mortality 16 times higher than those with less than 1.36 × 10⁹/L; patients with a lymphocyte count higher than 3.05 × 10⁹ have a risk of mortality 5 times higher than those with a lymphocyte count less than 1.04 × 10⁹/L; a platelet count less than 147 × 109/L showed a mortality risk 9.1 times higher, when compared with those with a platelet count higher than 257 × 109/L; an erythrocyte count less than 3.56 × 10¹²/L showed a mortality risk 9 times higher than those with an erythrocyte count higher than 4.57 × 10¹²/L, and; an MCHC less than 32.5 g/dL has almost 4 times more risk of mortality, compared to those with more than 34.1 g/dL of MCHC.
Association of explanatory variables with mortality; unadjusted and adjusted models.
How we answer the questions raised earlier:
A) What findings are more frequent?
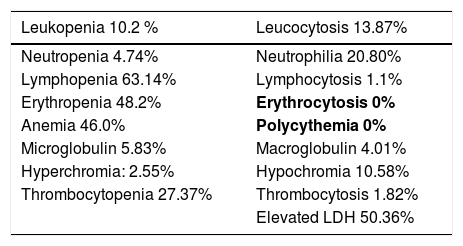
- Lymphopenia is frequent (63.14%), which is consistent with previous SARS-COV-2 studies that describe it as frequent.
- Elevated LDH at 50.36%; anemia at 46.0% and low erythrocytes at 48.2% (Table 7). These findings are consistent with our other results, showing that the elevated LDH and anemia are more frequent in the elderly; our population's median age is 75.
Hematologic change prevalence (out of the intensive care unit).
With the following reference values: The normal range considered for Hemoglobin was 11.5 g/dL < Hb < 16.5 g/dL for the female gender and 13 g/dL < Hb < 18 g/dL for the male gender. Red blood cell count was considered between 3.8 and 5.8 × 10¹²/L for the female gender and between 4.5 and 6.5 × 10¹²/L for the male gender. Normal Range considered for the mean corpuscular hemoglobin concentration (MCHC) 32 - 36 g/dL Mean cell volume 80 - 100 fl Normal range considered for white cell count 4 - 11 × 109/L Normal range considered for neutrophil count 2 - 7.5 × 10⁹/L Normal range considered for lymphocyte count x 109/L Platelet count 150 - 450 × 109/L LDH < 248 U/L)
We did not find leukopenia to be frequent, as described in other studies.
B) Is there a pattern of hematologic alterations in the initial hemogram of patients who are later admitted to the intensive care unit?
We demonstrated, with statistical significance, that patients with leukocyte elevation, neutrophil elevation, lymphocyte decrease or platelet count increase during the hospital stay are more likely to end up in the intensive care unit. The same is observed if there is a decrease in the erythrocytes, hemoglobin and median globular volume. Elevated LDH at admission to the hospital may be a predictor of eventual admission to the intensive care unit.
Consistent with studies that state that the higher the platelet count is, the higher the cytokine storm. An exuberant cytokine storm usually means a worse clinical condition and longer average hospital stay. Our ICU patients tend to have high platelets.
Our ICU patients were, contrary to the bibliography, actually younger (9 years less). Age and comorbidities were an important cutoff for admission to the ICU.
C) Is there a pattern of hematologic alterations in the initial study of patients who died (within a month) after the diagnosis of COVID-19?
Some blood parameters can singlehandedly help to predict mortality (Table 1): Our results show that older age, male gender, higher lymphocyte counts, higher neutrophil counts and neutrophil/lymphocyte ratio at admission are predictors of SARS-CoV-2 infection mortality. The same is evident for lower platelet counts (thrombocytopenia is correlated to the severity of the disease), erythrocytes and MCHC values at admission.
Elevated neutrophils and higher mortality are in line with recent studies stating that increased neutrophils mean an increased risk of death.
D) How does the lymphocyte/platelet index vary and what is its prognostic value?
Our data do not support any response.
ConclusionsSome hematological changes during hospital stay increase the likelihood of admission to the ICU.
Hematological data at admission in the health care system can predict the mortality of the SARS-CoV-2 infection and we recommend its use in clinical decisions and the patient prognosis evaluation.
Dr. Fernando Rodrigues, Diretor de Serviço, Serviço de Patologia Clínica do Centro Hospitalar Universitário de Coimbra Dr. Elmano Ramalheira, Diretor de Serviço, Serviço de Patologia Clínica do Centro Hospitalar Baixo Vouga Dr. Carlos Seabra, Serviço de Patologia Clínica do Centro Hospitalar Baixo Vouga Dra. Priscila Silva, Serviço de Patologia Clínica do Centro Hospitalar Baixo Vouga.


