
The availability of a clinical decision algorithm for diagnosis of chronic lymphocytic leukemia (CLL) may greatly contribute to the diagnosis of CLL, particularly in cases with ambiguous immunophenotypes. Herein we propose a novel differential diagnosis algorithm for the CLL diagnosis using immunophenotyping with flow cytometry.
MethodsThe hierarchical logistic regression model (Backward LR) was used to build a predictive algorithm for the diagnosis of CLL, differentiated from other lymphoproliferative disorders (LPDs).
ResultsA total of 302 patients, of whom 220 (72.8%) had CLL and 82 (27.2%), B-cell lymphoproliferative disorders other than CLL, were included in the study. The Backward LR model comprised the variables CD5, CD43, CD81, ROR1, CD23, CD79b, FMC7, sIg and CD200 in the model development process. The weak expression of CD81 and increased intensity of expression in markers CD5, CD23 and CD200 increased the probability of CLL diagnosis, (p < 0.05). The odd ratio for CD5, C23, CD200 and CD81 was 1.088 (1.050 - 1.126), 1.044 (1.012 - 1.077), 1.039 (1.007 - 1.072) and 0.946 (0.921 - 0.970) [95% C.I.], respectively. Our model provided a novel diagnostic algorithm with 95.27% of sensitivity and 91.46% of specificity. The model prediction for 97.3% (214) of 220 patients diagnosed with CLL, was CLL and for 91.5% (75) of 82 patients diagnosed with an LPD other than CLL, was others. The cases were correctly classified as CLL and others with a 95.7% correctness rate.
ConclusionsOur model highlighting 4 markers (CD81, CD5, CD23 and CD200) provided high sensitivity and specificity in the CLL diagnosis and in distinguishing of CLL among other LPDs.
Chronic lymphocytic leukemia (CLL) is the most frequent leukemia in Western countries.1 In the 2016 revision of the World Health Organization (WHO) classification of lymphoid neoplasms, CLL was described as leukemic lymphocytic lymphoma, only to be distinguishable from small lymphocytic lymphoma (SLL) by its leukemic presentation.2 It is important to distinguish CLL from the different disease entities belonging to mature B-cell lymphoid neoplasms and there are still difficulties in defining some cases.2,3 Despite advances in cytogenetics and molecular biology having led to a significant improvement in the diagnosis of lymphoproliferative diseases, it is necessary to evaluate the blood smear and immunophenotype for the successful differential diagnosis of CLL.3,4 A recent, large harmonization study confirmed that a panel of CD19, CD5, CD20, CD23, kappa and lambda is usually adequate for the diagnosis of CLL,5 however, in borderline cases, more markers are needed to make a diagnosis. In ambiguous immunophenotypes, the markers, such as CD43, CD79b, CD81, CD200 or ROR1, may help to refine the diagnosis.6
Healthcare providers use medical clinical decision algorithms based on a set of decision rules to improve care, diagnose, determine the risk for medical conditions and reduce costs.7 A machine learning approach for immunophenotyping with flow cytometry may reduce the cost of diagnostic procedures of lymphoproliferative disease, particularly CLL. The availability of a clinical decision algorithm for diagnosis of CLL would benefit patients with ambiguous immunophenotypes by providing the opportunity to diagnose CLL with reasonable accuracy. Previous studies proposed a decision-tree approach to improve the flow cytometry utilization in the differential diagnosis of lymphoproliferative diseases.8,9 However, the differential diagnosis of LPD has long been considered a difficult task, as it requires the differential diagnosis between different subtypes of heterogeneous and highly variable diseases.10
This study was designed to create a useful and feasible tool for CLL diagnosis, using immunophenotyping with flow cytometry. A predictive model using the Backward LR was built to estimate the diagnostic value of antigens used in routine CLL immunophenotyping and propose a novel differential diagnosis algorithm for B- cell LPD.
MethodsStudy populationsThe medical records of the patients diagnosed at the Ankara Numune Training and Research Hospital between November 2016 and May 2019 were retrospectively evaluated. A total of 302 patients were included in the study, of whom 220 (72.8%) had CLL and 82 (27.2%), B-cell lymphoproliferative disorders other than CLL. One hundred and sixty-one (53.3%) patients were male and 141 (46.7%) were female. The median age was 64 years (35 - 95 years). Five (6.1%) patients included in the others group had diffuse large B cell lymphoma (DLBCL), 17 (20.7%), hairy cell leukemia (HCL), 28 (34.1%), mantle cell lymphoma (MCL), 21 (25.6%), marginal zone lymphoma (MZL) and 11 (13.5%), splenic marginal zone lymphoma with circulating villous lymphocytes (SMZL).
The complete blood count, peripheral blood smear and/or bone marrow aspiration stained with May-Grünwald-Giemsa for morphological assessments were obtained from all patients. The peripheral blood or bone marrow aspiration sample was collected in a 4-mL tube containing K3EDTA as an anticoagulant (BD Biosciences, Vacutainer®, CA, USA) and analyzed within 2 hours of sampling. The diagnosis of LPD was established according to the 2016 revision of the WHO classification of lymphoid neoplasms, based on clinical data and the morphologic, immunophenotypic and genetic criteria.2 Immunohistochemical staining with cyclin D1 in bone marrow biopsies or assessment of t (11;14) with fluorescence in situ hybridization were performed to diagnose MCL. All the cases included in the study were pathologically and immunohistochemically confirmed. This study was approved by the Local Ethics Committee and conducted in accordance with the Declaration of Helsinki.
Immunophenotyping with flow cytometryPeripheral blood/bone marrow samples were collected in tubes containing EDTA (BD Biosciences, Vacutainer®, CA, USA) and analyzed immediately after sampling. According to direct immunofluorescence staining of whole blood using a lyse/wash procedure, cells in suspension (2 × 10⁶ cells in 50 - 100 µL per tube) from the peripheral blood or bone marrow samples were stained with monoclonal antibodies (MoAbs) directed against cell surface markers.
The following 8-color panel for CD19/CD10/CD5/CD81/CD43/CD79b/CD200/CD20, CD19/CD103/CD22/CD11c/CD25/CD23/ROR1/CD3 and CD19/CD5/CD22/sIgκ/sIgʎ were used for labeling in flow cytometry. These MoAbs were commercially purchased from BD Biosciences (San Jose, CA, USA). Each MoAb conjugate was titrated to establish the optimal concentration.
According to the EuroFlow-recommended antibody panels for diagnosis, classification and monitoring of hematological malignancies,11 the following MoAbs were used: CD19 PECy7 (Beckman Coulter, clone J3-119), CD10 PE (Beckman Coulter, clone ALB1), CD5 PerCPCy5.5 (BD Biosciences, clone L17F12), CD81 APCH7 ((BD Biosciences, clone JS-81), CD43 APCH7 (BD Biosciences, clone IG10), CD79b PerCPCy5.5 (BD Biosciences, clone SN8), CD200 APC (BD Biosciences, clone OX104), CD20 PacB (BioLegend, clone 2H7), CD103 FITC (BD Biosciences, clone Ber-ACT8), CD22 PerCPCy5.5 (BD Biosciences, clone S-HCL-1), CD11c PerCPCy5.5 (BD Biosciences, clone B-Ly6), CD25 PE (BD Biosciences, clone 2A3), CD23 FITC (Dako, clone MHM6), SmIgk PE (Cytognos, polyclonal) and SmIgλ FITC (Cytognos, polyclonal). In addition to the EuroFlow-recommended antibody panels, the FMC7/CD19 panel was used by request of the clinicians who treat the patients. The FMC7 FITC (BD Biosciences, clone FMC7) and CD19 PECy7 (Beckman Coulter, clone J3-119) were the additional markers.
Erythrocytes were then lysed with 450 µL of the BD FACS lysing buffer (BD Biosciences, San Jose, CA, USA) and incubated for 15 minutes at room temperature in the dark. While studying the CD19/CD5/CD20/CD23/sIgκ/sIgʎ tube, unlike the other tubes, MoAbs were added after performing irrigations twice using CellWASH (BD Biosciences, San Jose, CA, USA) by adding 2.5 mL CellWASH to each 0.5 mL peripheral blood/BM aspiration sample. The Facs-Canto (BD Biosciences, San Jose, CA, USA) was used to analyze the mixture. Prior to sample analysis, a series of quality control microspheres and reagents in a flow cytometry system were used for instrument calibration and compensation settings. On daily checks of the instrument, at least 5 × 10⁴ cells was acquired and the collected data were analyzed using the BD FACSDIVA™ software (Becton Dickinson). The proposed model was created based on the mean fluorescence intensity (MFI) expression of all the markers included in the study.
Statistical analysesThe demographic characteristics of the patients and the data related to the disease were summarized appropriately. Descriptive statistics were presented in a table for numeric and categorical variables using appropriate methods, such as minimum, maximum, average, median, standard deviation and percentage. The data set was divided into two groups, the training set and the test set. A total of 80% of the data set was comprised of the training set and 20%, the test set. The hierarchical logistic regression model was used for CLL diagnosis with the training set. The hierarchical (Backward LR method) logistic regression model validity was tested with the test set. The model performance indices, including the correct classification rate (CCR), sensitivity, specificity, positive predictive value (PPV) and negative predictive value (NPV), were used in both the training set and test set. In addition, the model performance was compared with model classifications obtained with alternative diagnosis scores (Matutes score and a new score proposed by D'Arena et al.).12 The IBM SPSS Statistics for Windows version 25.0 (IBM Corp. released 2017. Armonk, NY, USA) was used for the statistical analysis. A type-I error of 5% (two-sided) was used to infer statistical significance in all analyses.
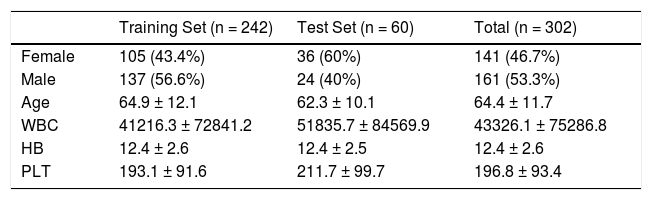
ResultsThe data set was divided into two groups, the training set and the test set. A total of 302 patients were included, of whom n = 242 (80%) were in the training set and 60 (%20), in the test set. Descriptive statistics for the patients were presented in Table 1 for the training set, test set and total.
Demographic features of the patients for both training and test sets.
WBC: white blood count, HB: hemoglobin, PLT: thrombocyte.
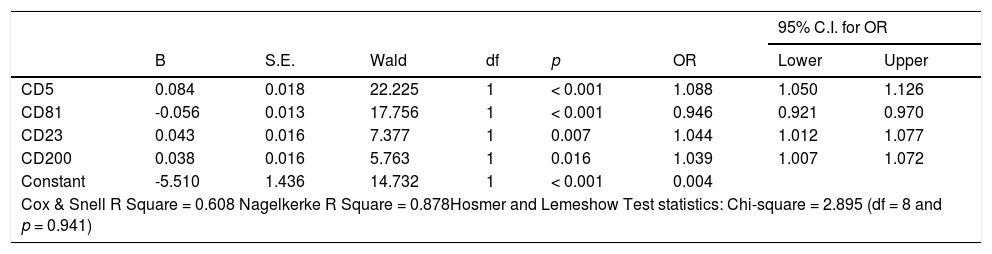
The CD5, CD43, CD81, ROR1, CD23, CD79b, FMC7, sIg and CD200 were the variables included the modeling process. The logistic regression analysis with the backward elimination method (Backward LR) for the training set with CD5, CD43, CD81, ROR1, CD23, CD79b, FMC7, sIg and CD200 independent variables and the binary outcome variable CLL (CLL and others) was performed. According to the hierarchical (Backward LR) logistic regression result, the CD5, CD81, CD23, CD200 and FMC7 markers remained in the model after 5 steps (p-values 0.094 for FMC7 and < 0.05 for others). At the end of five steps, the FMC7 variable with a value of p = 0.094 was also removed from the model manually and the model with the results in Table 2 was obtained.
Results of logistic regression model for CLL prediction.
Variable(s) entered in step 1: CD5, CD43, CD81, ROR1, CD23, CD79b, FMC7, sIg, CD200.
B: Coefficent of regression; S.E.: Standard Error of B; df: degrees of freedom; OR: Odds Ratio; CI: Confidence Interval.
In our model, the decrease in the CD81 intensity and increase in the intensity of other markers (CD5, CD23 and CD200) increased the probability of the diagnosis of CLL, (p < 0.05). The odds ratios for the CD5, C23, CD200 and CD81 variables were 1.088 (1.050 - 1.126), 1.044 (1.012 - 1.077), 1.039 (1.007 - 1.072) and 0.946 (0.921 - 0.970) [95% C.I.], respectively. The results of the logistic regression model for the CLL prediction are given in Table 2.
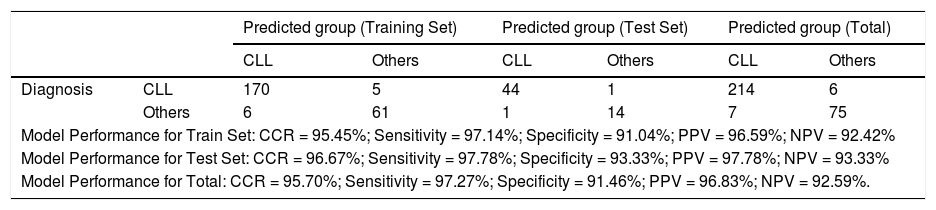
The classification performance (Model predictions) for both the training and test sets are presented in Table 3. The model was established with 95.7% of CCR, 95.27% of sensitivity, 91.46% of specificity, 96.83% of PPV and 92.59% of NPV for all the data.
Training set and test set predictions.
CCR: Correct Classification Rate; PPV: Positive Predictive Value; NPV: Negative Predictive Value.
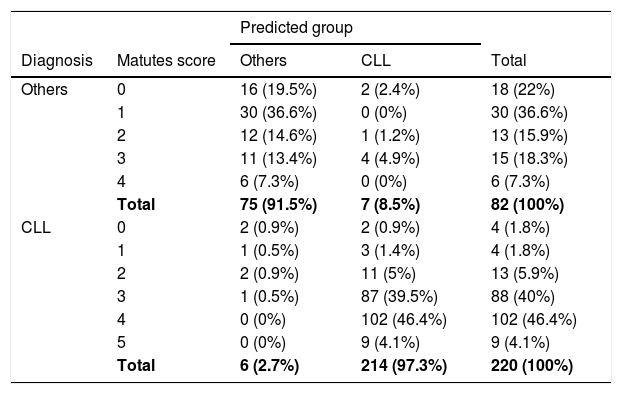
The number and percentages of the actual diagnosis class regarding the predictive value of the model and Matutes scores of all patients are given in Table 4. For 50.5% (102 + 9 = 111 people) of 220 patients diagnosed with CLL, the Matutes score was 4 and 5. The model estimation for all these 111 patients was CLL. The Matutes score was 3 for 40% (88 people) of 220 patients diagnosed with CLL and the model estimation for the 87 patients was CLL, with the exception of 1 of these 88 patients. The model estimation for 97.3% (214) of 220 patients diagnosed with CLL, was CLL. The Matutes score was 0, 1 and 2 for 74.5% (18 + 30 + 13 = 61 people) of the 82 patients diagnosed with lymphoproliferative disease other than CLL. The model estimation for 58 patients, with the exception of 3 of these 61 patients, was others (LPD other than CLL). For the 18.3% (15 people) of 82 patients diagnosed with others, the Matutes score was 3 and the model estimation for the 11 patients, with the exception of 4 of these 15 patients, was others. The model prediction for 91.5% (75) of 82 patients diagnosed with lymphoproliferative disease other than CLL, was others (Table 4).
Comparison of Matutes scores and model predictions.
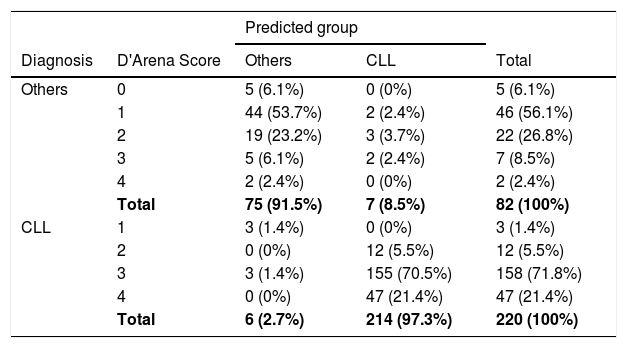
The comparison of the model and the new score proposed by D'Arena et al.12 is in Table 5. For 93.2% (158 + 47 = 205 people) of 220 patients diagnosed with CLL, the D'Arena score was 3 and 4. The model estimation for 202 patients, with the exception of 3 of these 205 patients, was CLL. The model estimation for 97.3% (214) of 220 patients diagnosed with CLL, was CLL. A total of 62.2% (5 + 46 = 51 people) of 82 patients diagnosed with LPD other than CLL had low D'Arena scores, including 0 and 1. The model estimation for 49 patients, with the exception of 2 of these 51 patients, was others. For the 26.8% (22 people) of 82 patients diagnosed with others, the D'Arena score was 2. The model prediction for the 19 patients, with the exception of 3 of these 22 patients, was others. The model prediction for 91.5% (75) of 82 patients diagnosed with lymphoproliferative disease other than CLL was others (Table 5).
Comparison of D'Arena scores and model predictions.
Flow cytometry immunophenotyping is an essential tool in the diagnostics of B-cell lymphoproliferative disease, including CLL.2,5,13 The Matutes score, based on the expression of CD5, CD23, FMC7, surface immunoglobulin (SmIg) and CD22/CD79b by leukemic cells, has been used for more than 20 years in the diagnosis of CLL.14,15 However, the differential diagnosis of CLL still remains a challenge due to ambiguous immunophenotypes. In this study, we tried to provide a novel scoring algorithm to overcome the diagnostic challenge of CLL.
A composite immunophenotypic panel of different B-cell markers is used to distinguish CLL from other B-cell LPDs because there is no single marker characteristic of a single disease entity. In the Matutes score system, positivity of CD23 and CD5 and weak or absent expression of CD79b (or CD22), FMC7 and SmIg are converted to a score of 0 - 5 and interpreted as CLL in patients with a score greater than 3.14 In addition, D'Arena et al. defined the simplified score, compared to the classical Matutes score, for the differential diagnosis of CLL—which only requires 4 markers, such as CD5, CD23, CD200 and SmIg.12
In our study, the model was created with the variables CD5, CD23, CD200 and CD81 obtained from the Backward LR method, which was established with CD5, CD43, CD81, ROR1, CD23, CD79b, FMC7, sIg and CD200. We found that a 1-unit increase in the MFI of CD5 increases the risk of CLL 1.088-fold, a 1-unit increase in the MFI of C23, 1.044-fold and a 1-unit increase in the MFI of CD200, 1.039fold. A 1-unit decrease in the MFI of CD81 increases the risk of CLL by 1.057-fold (1 / 0.946). In addition, our model estimation for 97.3% of 220 CLL patients with a Matutes score of 3, 4 and 5 was CLL. However, the model prediction for 91.5% of 82 patients diagnosed with lymphoproliferative disease other than CLL was others. The Matutes score of these 75 patients was 0, 1 and 2. We suggest that our model provides a novel diagnostic algorithm with 97.3% of sensitivity and 91.5% of specificity. Our model prediction for 97.3% (214) of 220 patients diagnosed with CLL was CLL and for 91.5% (75) of 82 patients diagnosed with lymphoproliferative disease other than CLL, others, according to the D'Arena score.
Previous studies incorporated antigens, such as CD200, CD43 and CD81, in diagnostic algorithms to facilitate the separation of CLL from another B-cell LPD. They all reported that quantitative evaluation of these markers may be a feasible manner to better identify B- lymphoproliferative disorders.16–20 Falay et al. recommended including the CD43, CD81, CD200 and ROR1 in the diagnostic tool of CLL, particularly in distinguishing it from MCL.21 We suggest that a new score of 4 markers (CD5, CD23, CD 200 and CD 81) is highly effective in distinguishing CLL from other LPDs.
ConclusionIn most cases complete blood counts, a blood smear and immunophenotyping are enough to establish the diagnosis of CLL. However, ambiguous immunophenotypes are common and remain a diagnostic challenge. Here, we propose a differential diagnosis algorithm with higher sensitivity and specificity than the classic Matutes score in diagnosing CLL, with 95.27% of sensitivity and 91.46% of specificity. Our model provides a novel diagnostic algorithm in which the cases were correctly classified as CLL and others, with a 95.7% correctness rate. We suggested that our novel diagnostic model may greatly contribute to the diagnosis of CLL, particularly in cases with ambiguous immunophenotypes.
Ethical statementAll procedures performed in this study were in accordance with the ethical standards of the Institutional Review Board of the Clinical Research Ethics Committee of the Ankara City Hospital and with the 1964 Helsinki declaration and its later amendments. Informed consent was obtained from all individual participants included in the study.
Funding statementNo funding.
Author contributionsStudy concepts by Mesude Falay and Zehra Narli Ozdemir; study design by Mesude Falay; data acquisition by Zehra Narli Ozdemir, Ozlem Beyler, Eylem Genç and Ahmet Kursad Gunes; quality control of data and algorithm by Mesude Falay, Funda Ceran and Simten Dagdas; data analysis and interpretation by Mesude Falay and Zehra Narli Ozdemir; statistical analysis by Ayhan Parmaksiz; manuscript preparation by Zehra Narli Ozdemir; manuscript editing by Mesude Falay, Simten Dagdas and Gulsum Ozet, and; manuscript review by Mesude Falay.


